GBPUSD Hits Resistance In Short-term Rally
Further to an earlier analysis, GBPUSD has started to lose its upside momentum.
Past performance is not an indicator of future results.
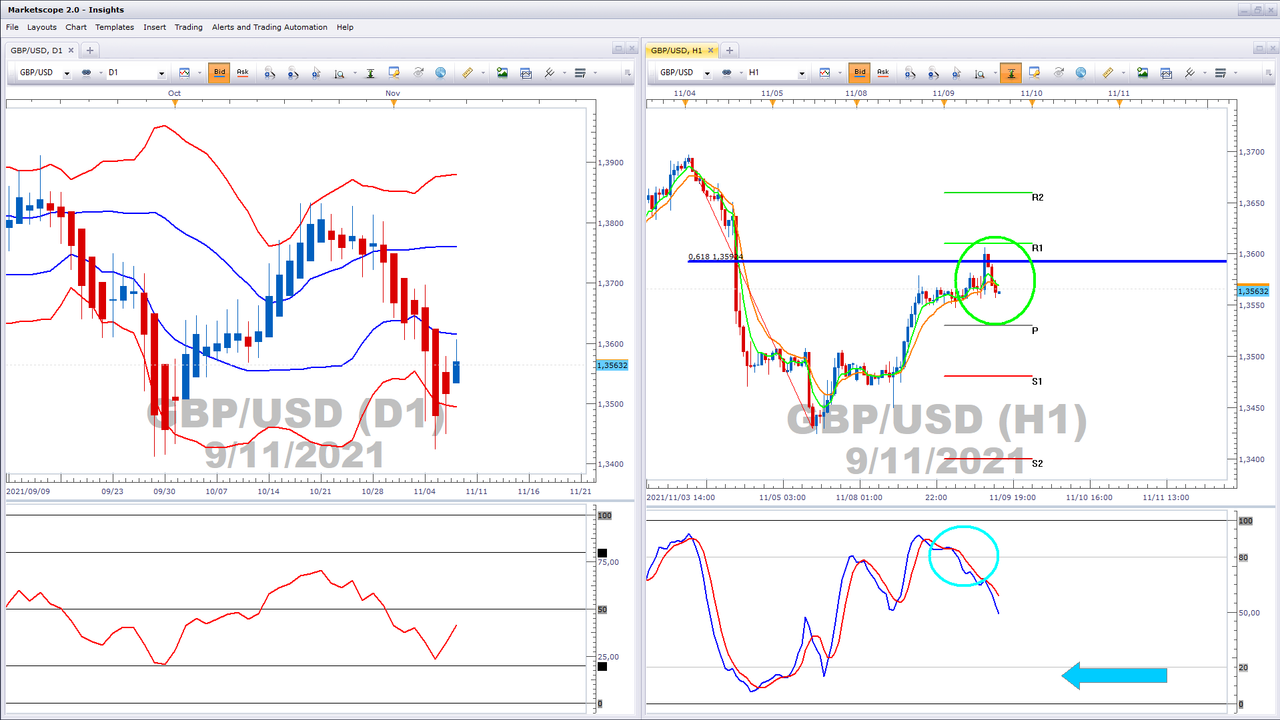
The right chart shows the daily GBPUSD time frame. Here, price is in the weak area between the lower blue and red bands. The daily RSI is also on the weak side of 50. The right chart shows the hourly times frame. Here, price has rallied to the R1 pivot/61.8% confluence of resistance and reacted. The stochastic has crossed bearishly (aqua ellipse) and the EMAs are looking to following (green ellipse). If the EMAs develop angle and separation and the stochastic makes its way to the 20 level, a downside momentum is likely building. If these chart, the stochastic reaching 20 and holding that level (aqua arrow), will increase the odds that current action is charting the next downside swing.
Russell Shor
Senior Market Strategist
Russell Shor is a Senior Market Strategist at FXCM, having been promoted to the role in 2025 in recognition of his depth of insight and consistent delivery of high-impact market analysis. He originally joined FXCM in October 2017 as a Senior Market Specialist.
Russell holds an Honours Degree in Economics from the University of South Africa, is a certified FMVA®, and a full member of the Society of Technical Analysts (UK). With over 20 years of experience in financial markets, his work is renowned for its clarity, precision, and strategic value across asset classes.
Any opinions, news, research, analyses, prices, other information, or links to third-party sites contained on this website are provided on an "as-is" basis, as general market commentary and do not constitute investment advice. The market commentary has not been prepared in accordance with legal requirements designed to promote the independence of investment research, and it is therefore not subject to any prohibition on dealing ahead of dissemination. Although this commentary is not produced by an independent source, FXCM takes all sufficient steps to eliminate or prevent any conflicts of interests arising out of the production and dissemination of this communication. The employees of FXCM commit to acting in the clients' best interests and represent their views without misleading, deceiving, or otherwise impairing the clients' ability to make informed investment decisions. For more information about the FXCM's internal organizational and administrative arrangements for the prevention of conflicts, please refer to the Firms' Managing Conflicts Policy. Please ensure that you read and understand our Full Disclaimer and Liability provision concerning the foregoing Information, which can be accessed here.