Commodities H2 2026 outlook: navigating the intersection of AI, cleantech, policy and geopolitics

The great reset: commodity markets in the age of AI and geopolitical uncertainty
The global commodity landscape is undergoing a profound transition, driven by the convergence of the AI revolution, the acceleration of clean energy adoption, heightened geopolitical instability and a fundamental shift in monetary policy. As hyperscalers race to build the infrastructure required for the next generation of computing and the transition toward sustainable power gathers momentum, demand for essential minerals and energy sources is being structurally reshaped.
Simultaneously, the geopolitical volatility stemming from the Middle East conflict introduces a complex variable into these markets, complicating supply-demand dynamics. These frictions are actively reshaping safe-haven flows, heightening stagflationary risks and altering the strategic trajectory of central banks worldwide. In this outlook, we examine how these defining forces are shaping the trajectories of oil, natural gas, copper, silver and gold as we navigate the second half of 2026.
The AI buildout: a commodity-intensive infrastructure cycle
AI proliferation has entered a more aggressive phase thanks to the rise of inference and Agentic AI. Deloitte identifies inference as the "hot new thing" for 2026 [1], expecting it to account for roughly two-thirds of all AI compute cycles, while Gartner projects that 40% of enterprise applications will feature AI agents this year. [2]
This shift accelerates and broadens hardware requirements. The battleground has expanded beyond GPUs to encompass custom silicon, advanced CPUs and high-bandwidth memory. Micron exemplifies these dynamics, posting record revenues and scaling capacity to meet unprecedented demand [3], while Nvidia continues to see strong growth, with revenue projections for the July quarter reaching 94.9% y/y. [4]
Hyperscalers are simultaneously the beneficiaries and the engine of this surge, pouring vast capital into the physical infrastructure required to power such proliferation. Alphabet posted record cloud revenue growth in the first quarter while nearly doubling its capex target for the year. Amazon.com, Microsoft and Meta Platforms are also raising their investments substantially.
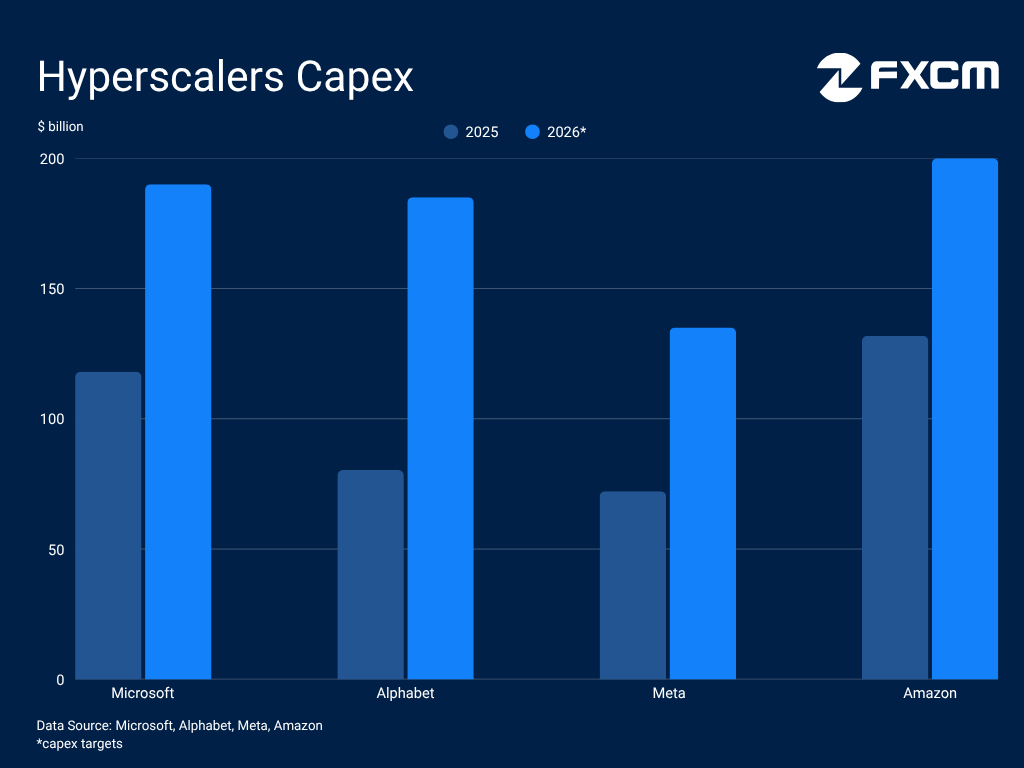
As the race to build the necessary infrastructure heats up, Goldman Sachs forecasts spending of $2.147 trillion on data centres alone by 2031 [5]. The WSTS expects the semiconductor market to accelerate this year and reach the $1.5 trillion [6]. This trajectory creates structural demand for metals like copper and silver, which serve as essential conduits for high-performance computing and data centre connectivity.
However, the AI boom is encountering a cost-of-scale reckoning. Rising input costs are rendering the construction and maintenance of infrastructure increasingly expensive. Global economic headwinds threaten to sap demand for consumer electronics and compress the marketing budgets that sustain the tech giants driving this boom, while trade restrictions and supply chain vulnerabilities act as drags on the pace of deployment.
Clean energy: driver of generational demand
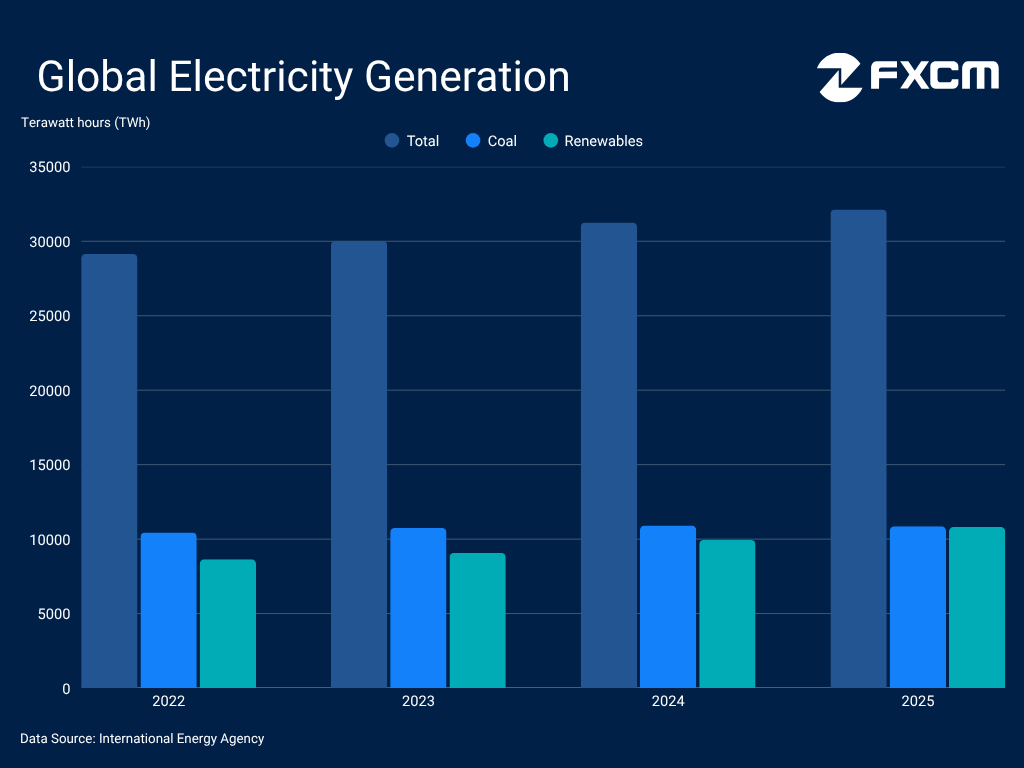
The AI infrastructure buildout is triggering a structural surge in global electricity demand, with Gartner projecting data centre power usage to climb 26% this year alone [7]. Looking further ahead, the IEA forecasts this consumption will more than double to 945 TWh by 2030 [8]. As electricity cements its role as the primary global energy source, the clean energy transition is gathering significant pace. In 2025, 47.3% of EU electricity generation came from renewable sources[8]. Globally, renewables accounted for 33.6% of generation, emerging as the fastest-growing source of supply while coal registered a 0.4% decline. [9]
The green transition is gaining momentum, with the recent energy shock from the Middle East conflict serving as a fresh catalyst. These dynamics are illustrated in the rejuvenated demand for electrified cars. Battery electric vehicle (BEV) registrations in Europe rose 31.2% y/y through the first five months of 2026 according to ACEA, while petrol and diesel sales posted double-digit declines [10]. In China, BEV sales climbed over 7% during the same period [11]. Looking at the broader EV landscape, IEA forecasts a 28% increase in global deliveries [12], marking a notable acceleration from 2025. This large-scale electrification of the grid and transportation sector is boosting demand for key commodities essential to the massive infrastructure expansion.
On the other hand, the road to net zero remains bumpy, most notably in the United States where CO2 emissions jumped 2.2% y/y in 2025. The Trump administration is rolling back green policies, prioritising fossil fuels as it pursues energy independence. Shortly after taking office, the President signed the "Unleashing American Energy" executive order [14], fast-tracking project permits and removing EV mandates. The administration has also formally exited the Paris Agreement [15] while rescinding the EPA's Endangerment Finding [16] - the legal basis for greenhouse gas regulation, effectively repealing federal vehicle emission standards.
Middle East conflict: upending supply-demand dynamics
The Middle East conflict has triggered an acute energy shock, fuelling inflation and creating severe headwinds for the global economy. This instability jeopardises crucial sectors that drive global economic activity, particularly those that are energy-intensive and rely on intricate supply chains, such as chip manufacturing. Reflecting this strain, the OECD projects G20 consumer prices will rise to 4.0% this year from 3.4% in 2025, while forecasting a deceleration in global GDP growth from 3.4% last year to 2.8% in 2026. [17]
While the US and Iran have signed a Memorandum of Understanding, the path to lasting peace remains volatile. Recent hostilities underscore that uncertainty regarding further negotiations and control over this maritime chokepoint will likely linger. This geopolitical tension compounds pre-existing headwinds from disruptive trade policies. Despite the US Supreme Court striking down IEEPA tariffs in late February [18], the administration has introduced a 150-day universal levy [19] and proposed fresh Section 301 tariffs [20]. This environment of heightened trade and geopolitical friction creates structural uncertainty that inherently weighs on industrial commodity demand.
Nonetheless, traffic through the Strait of Hormuz has picked up after the MoU and both sides have strong incentives to keep it open. The increased transit volume has pushed energy prices lower, reducing stagflationary risks. Overall, the global economy has shown remarkable resilience to the energy shock and the inflationary impact could prove temporary as evidence of second-round effects appears generally contained.
US dollar and central banks: commodity price catalysts
The spike in inflation resulting from the Middle East conflict has forced global central banks into a more hawkish stance this year. The ECB pivoted last month with its first rate hike in nearly three years [21], the BoJ continues to normalise policy [22] and the RBA delivered 75 basis points of hikes before pausing. This higher-for-longer environment exacerbates economic headwinds, which could curtail demand for certain commodities.
This inflationary pressure has fundamentally altered the Fed's calculus. The updated dot plot now signals a rate hike this year and the new Chair committed to restoring price stability [23]. The repricing is boosting the USDOLLAR, which acts as a catalyst for commodities. Since they are denominated in dollars, there is an inherent inverse correlation and downward pressure. Gold and silver are more vulnerable as higher rates raise the opportunity cost of holding non-yielding assets.
However, the dollar may be approaching its peak and the second half of the year could prove more challenging. Cooling energy prices could ease inflationary risks and contain pressure on the Fed to hike. Simultaneously, ballooning US deficits, exacerbated by the cost of war and rising defence spending, threaten to revive fiscal concerns and erode confidence in the currency. This is occurring as trade and geopolitical friction make de-dollarisation trends, spearheaded by Beijing, more compelling. While the dollar remains the ultimate reserve asset, its position as such is undergoing a steady, long-term decline.
Oil: shifting supply-demand dynamics
The Middle East conflict sparked turmoil in oil markets, upending a previously unfavourable fundamental equilibrium. The market has tightened significantly, heading toward a likely deficit this year. The IEA estimates that 1.3 billion barrels have been lost [24], expecting supply to drop substantially [25]. During their first quarter results, energy giants pointed to prospects of sustained tightness and a protracted normalisation process after the Strait of Hormuz reopens. The CEO of Saudi Aramco warned that markets will "take months" to normalise and the process could even extend into 2027[26], while the CEO of Shell said "the journey back will be a long one".[27]
Furthermore, a rush to address shortages via massive reserve releases has left global stockpiles at their lowest levels in decades, with the US Strategic Petroleum Reserve falling to its lowest point since 1983 [28]. These stockpiles will eventually require replenishment, providing a floor for crude demand and prices. Additionally, the clean energy transition remains unable to fully displace oil. Under President Trump, the US is committed to fossil fuel expansion and OPEC does not see oil consumption peaking. Instead, as global energy demands grow, OPEC expects demand to reach 113.3 million barrels per day, up from 105.1 million in 2025. [29]
However, flows through the Strait of Hormuz are already being restored, while consumption has dwindled amid mounting global economic headwinds and elevated prices. The IEA projects a sizable drop in demand this year and anticipates a return to market surplus by 2027. OPEC+ has implemented symbolic output increases, signalling that members are committed to returning supply to the market. The UAE's departure from the group may accelerate this trend as it seeks greater flexibility over production levels and supply route diversification. Its exports have already returned to approximately 85% of pre-war levels according to the IEA [30]. Adding to the supply picture, the US has issued a 60-day waiver on Iranian oil exports. [31]
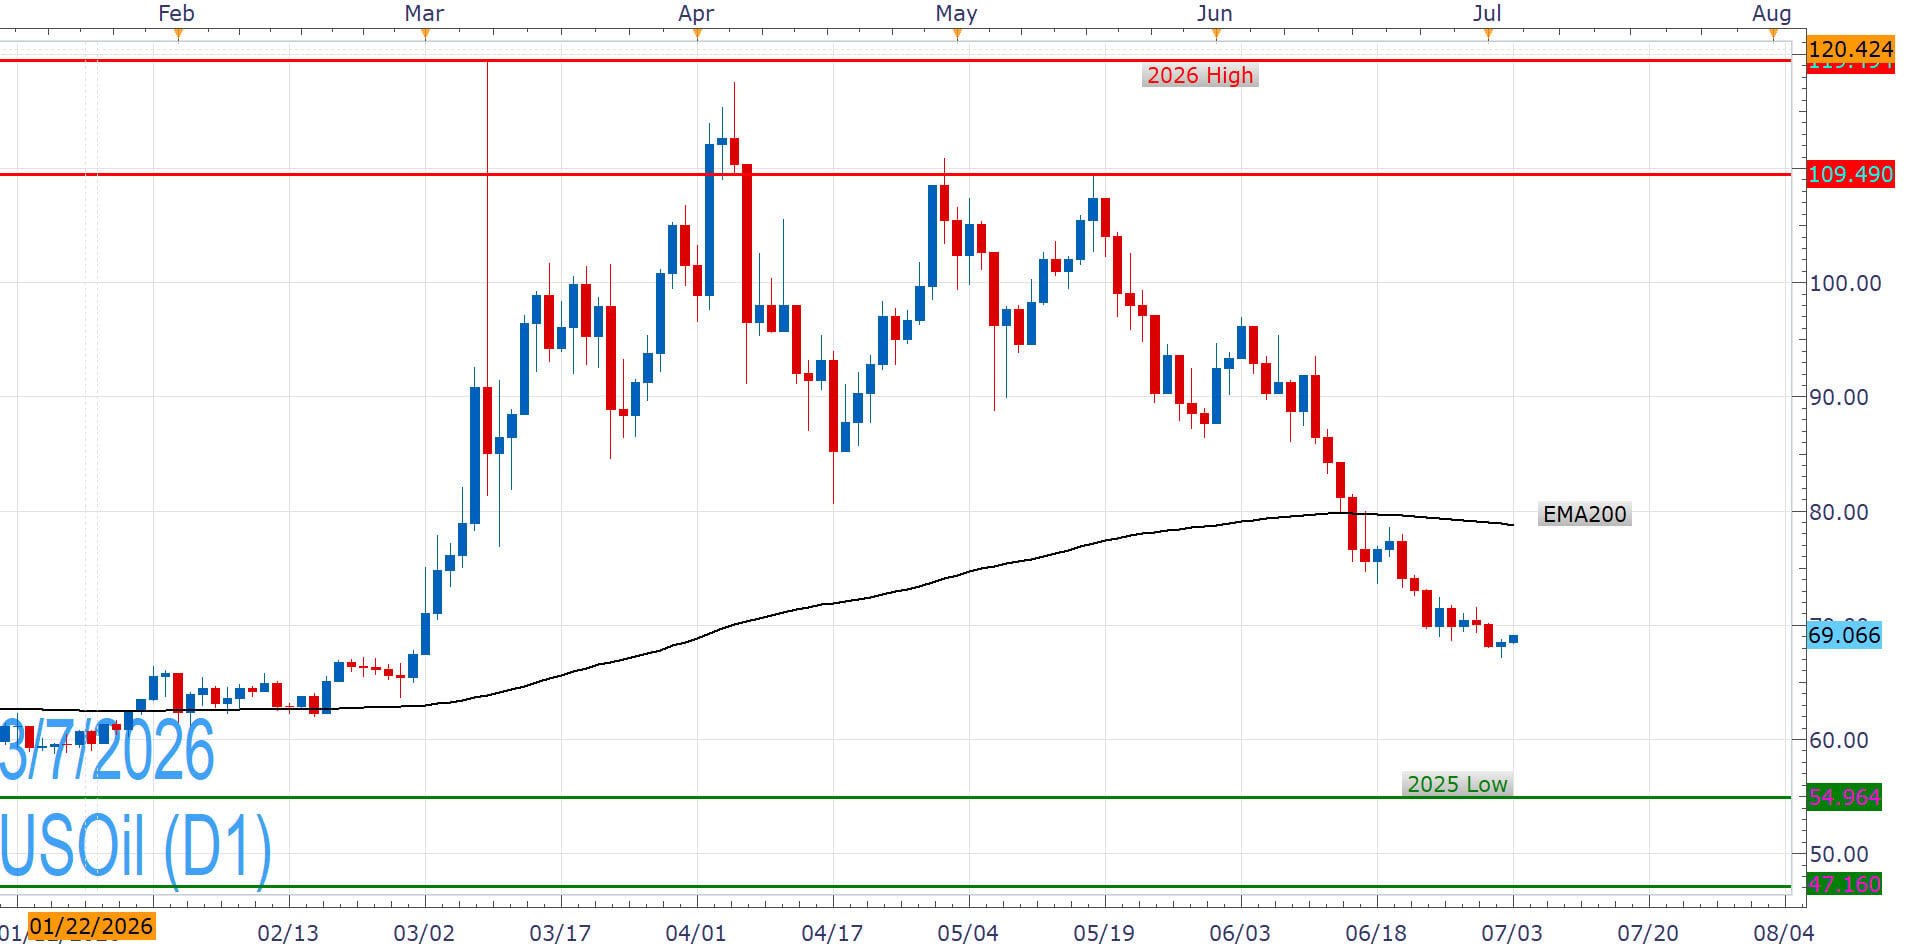
USOil has moved below the EMA200 as flows normalise and the geopolitical risk premium subsides, shifting the bias to the downside and leaving crude vulnerable to deeper declines. However, a lasting return to pre-war levels does not look easy. As the global economy moves past the energy shock, demand could pick up and support a recovery.
Natural gas: pivotal in the clean energy shift
Natural gas may not be a renewable energy source, but it serves as an indispensable bridge in the transition toward a cleaner power mix, with the EU classifying specific applications as "transitional" [32]. The resource remains a cornerstone of electricity generation, accounting for 40% of US output per the EIA [33]. Moreover, a shift in US energy policy has elevated its standing, with President Trump formally designating it a resource "essential" to national defence. [34]
The rapid proliferation of AI and the expansion of power-hungry infrastructure have further amplified the necessity of reliable baseload supply. Demonstrating this trend, Chevron and Microsoft recently unveiled a collaborative initiative to deliver 2.67 GW of gas-fired power specifically for data centres [35]. The IEA projects that natural gas will cover 18.5% of the electricity demand growth from data centres through 2030. [36]
These factors provide robust structural support, yet the Middle East conflict has complicated the outlook as nearly 20% of LNG transited through the Strait of Hormuz in 2024 [37]. The IEA estimates that the spike in prices and restriction in flows is leading to a downward adjustment in global demand. Although uncertainty could persist, flows through the Strait are resuming after the US-Iran MoU, potentially creating challenges in supply-demand dynamics for the second half of the year.
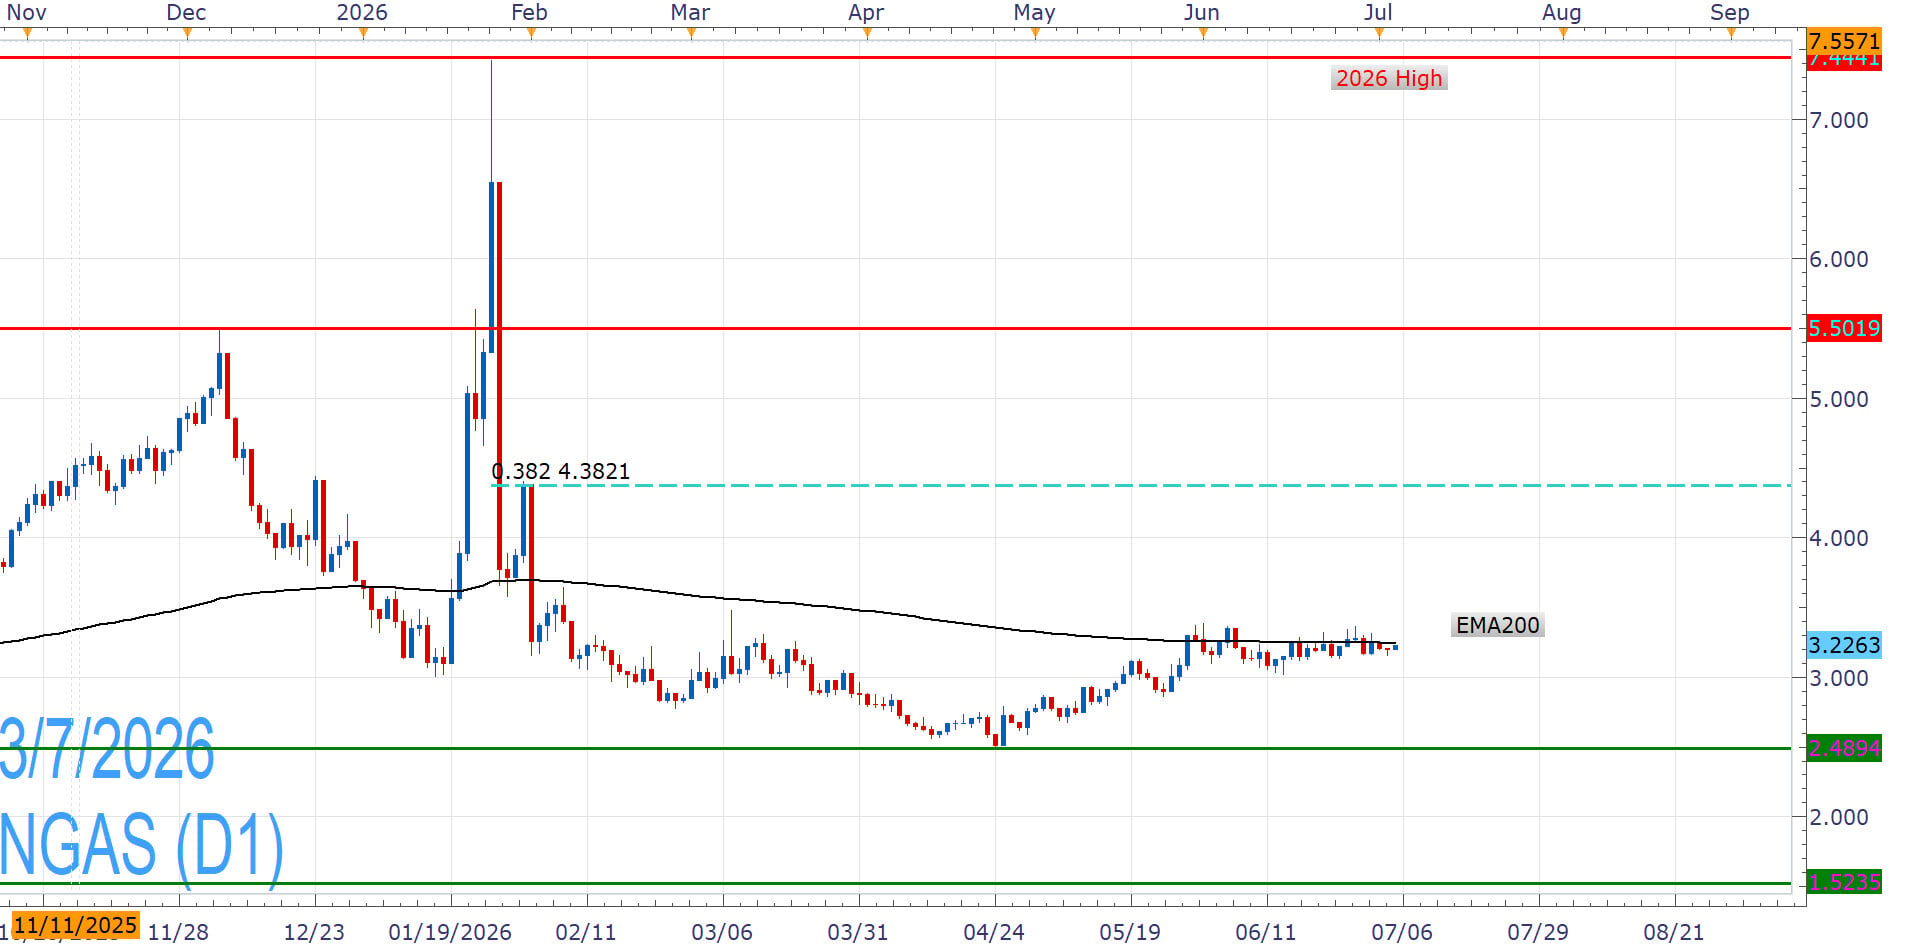
While international LNG benchmarks skyrocketed at the inception of the conflict, Henry Hub NGAS prices remained largely insulated due to uninterrupted domestic production. While elevated US output may temper price growth, persistent demand could pave the way for a more favourable performance in the second half of the year.
Copper: indispensable to the engines of the global economy
Copper has become a cornerstone of the modern era, serving as an indispensable component in the proliferation of AI, the clean energy transition and the defence industry. Grand View Research values the global copper-in-data-centres market at $4.6 billion by 2033, with an annual compound growth rate of 14.4% [38]. Beyond the digital realm, the metal is vital to electrification, used extensively in wind turbines and photovoltaics. A pure electric BEV battery uses 183 lb of copper, compared to just 48 lb in internal combustion engine vehicles [39]. Furthermore, copper is the second most heavily used material by the US Department of Defence and a necessary input in everything from aircraft to missiles and ammunition. [40]
These sectors are fuelling global economic growth, with S&P Global highlighting them as key drivers behind a projected 50% rise in copper demand by 2040 [41]. Looking at the near term, the ICSG expects a 1.6% rise in copper consumption this year, set to outstrip supply growth of just 0.4% [42], while major miners also highlight output challenges. Freeport-McMoRan projects a nearly 14% drop in 2026 [23], while Codelco sees a rise from last year, though its output remains historically low. [44]
However, supply-demand dynamics are more complicated than they might appear. Economic headwinds from geopolitical tensions, trade disruptions and rising inflation weigh heavily on consumption. The ICSG lowered its growth projection due to the Middle East conflict while still seeing another surplus this year, albeit smaller.
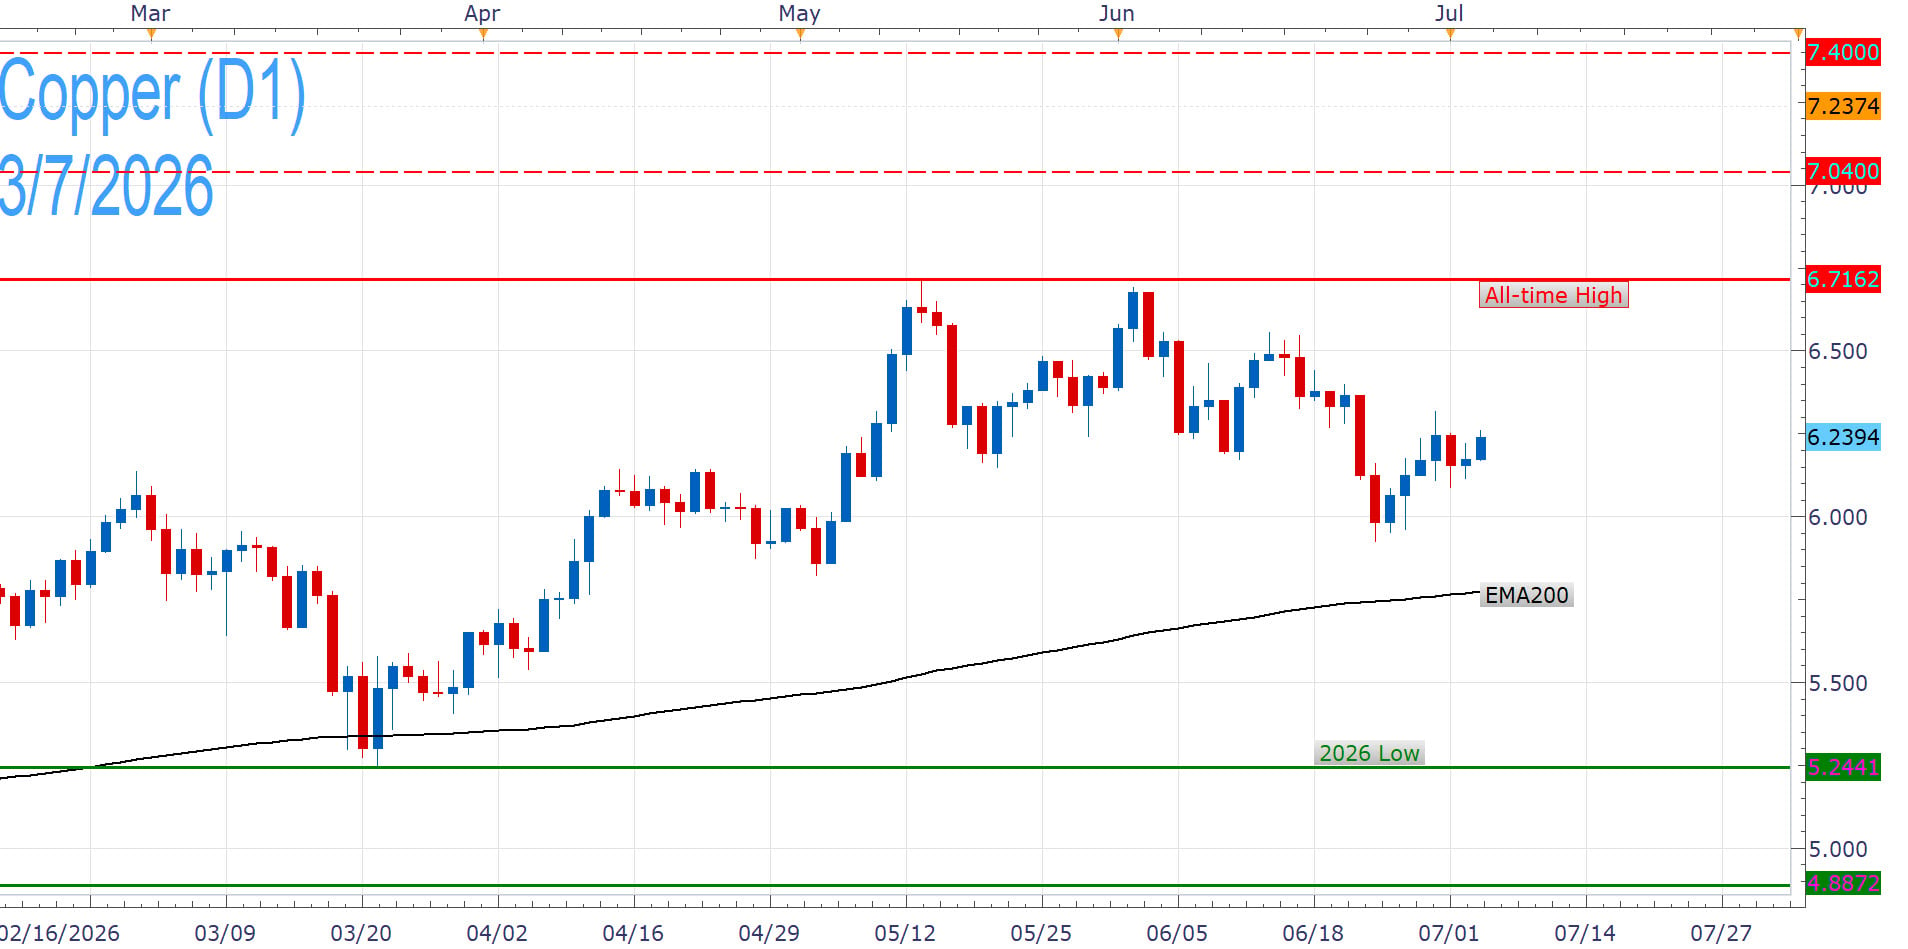
The path of least resistance for Copper remains toward new all-time highs amid generational demand from its use in these industries, while the risk of additional US tariffs could sustain dislocations. On the other hand, macroeconomic risks and episodes of concern over the AI boom leave it vulnerable to declines.
Silver: a precious metal with crucial industrial utility
Silver's unique properties render it pivotal to a vast array of industrial applications, including semiconductor fabrication, clean-technology development and defence projects. Over 58% of demand came from industrial use in 2025 according to the Silver Institute[45]. Underscoring its strategic importance to essential technologies, including the defence sector, the US Geological Survey added silver to its official list of critical minerals late last year [46]. The World Bank similarly recognises the metal as a "key input" in both renewable energy systems and the semiconductor supply chain. [47]
The expansion of these sectors fuels long-term demand for silver, with the Silver Institute expecting structural tightness and deficits to persist for a sixth consecutive year, with supply seen dropping 2%. As silver is primarily obtained as a secondary byproduct from the mining of other metals such as gold and copper, production output remains inherently rigid, fostering a persistently favourable supply-demand equilibrium.
However, the Middle East conflict has introduced complexities into these dynamics by intensifying the global economic headwinds that temper industrial consumption. The Silver Institute projects demand to drop 2% this year, acknowledging softening in certain sectors. Furthermore, thrifting in the solar industry could curb demand as manufacturers reduce silver use through technological advancements and lower-cost alternatives. The supply side is not straightforward either, with some key producers like Pan American [48] and Newmont [49] expecting a substantial increase in production this year.
Meanwhile, the precious metal has struggled to maintain its safe-haven appeal this year as the dollar has emerged as the primary beneficiary of risk-off capital flows. Its price movement remains closely correlated with gold, and the Silver Institute has noted potential downside risks for silver should central banks and sovereign wealth funds begin liquidating gold holdings in response to mounting fiscal pressures.
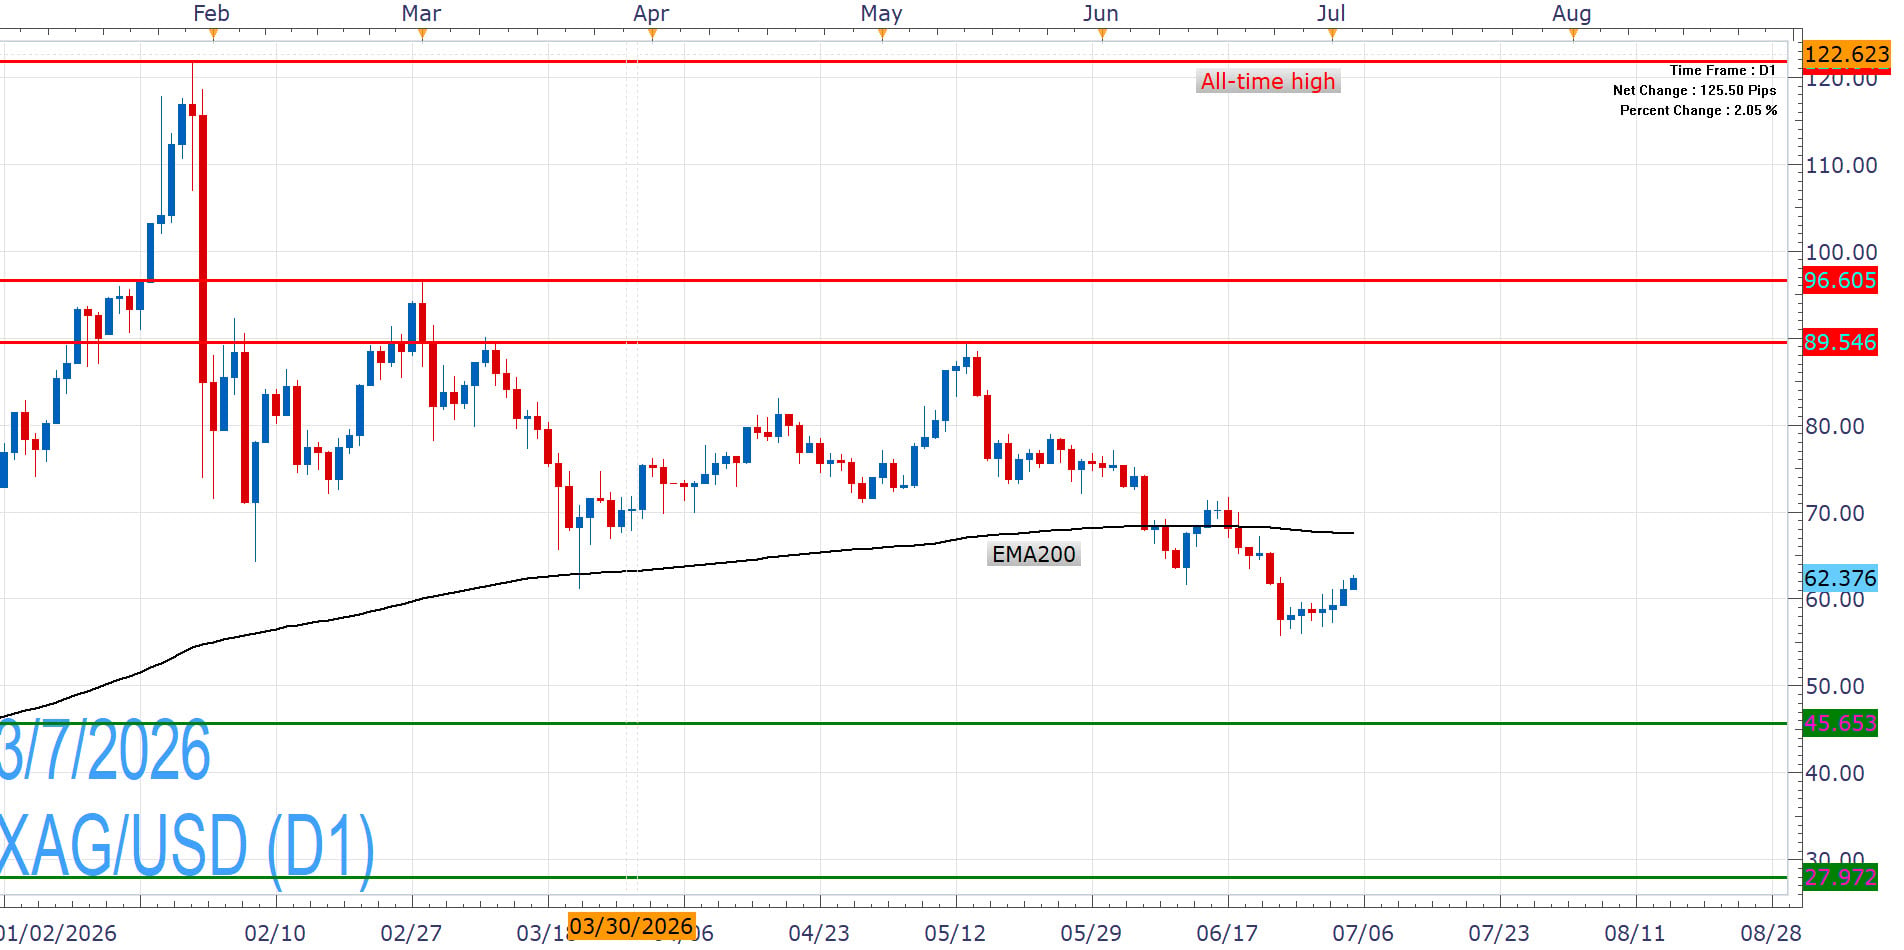
Consequently, XAG/USD faces a challenging technical and fundamental landscape that leaves it exposed to further declines. A higher-for-longer interest rate environment, dollar strength and macroeconomic headwinds weighing on industrial consumption represent the primary obstacles. Nevertheless, structural demand drivers could propel it higher, particularly as the greenback may fail to replicate its recent strength in the second half of the year.
Gold: safe-haven status questioned but structural demand persists
The precious metal has emerged as a notable underperformer during the recent Middle East conflict, failing to attract significant risk-off inflows as investors prioritised the liquidity of the dollar during turbulent periods. Furthermore, bullion can struggle in a robust economic environment where the AI-fuelled rally in equity markets has rendered the non-yielding asset less appealing to growth-oriented investors.
These dynamics are playing out against a pronounced hawkish shift in monetary policy. Fed projections now signal potential rate hikes to counter persistent inflationary pressures, a restrictive stance further reinforced by a higher-for-longer interest rate narrative that has extended well beyond the United States. Consequently, the resulting strength of the USDOLLAR and attractive yields on dollar-denominated assets continue to exert sustained downward pressure on gold demand.
Nonetheless, gold remains underpinned by significant structural demand drivers. Geopolitical fragmentation and persistent fiscal imbalances are driving deficits higher, with the IMF projecting that global public debt will escalate to 100% of GDP by 2029 [50]. Such a trajectory accelerates currency debasement, reinforcing bullion's long-term utility as a strategic hedge for both institutional investors and sovereign entities.
This environment further catalyses de-dollarisation efforts, most notably spearheaded by China, which expanded its gold reserves for the 19th consecutive month in May [51]. Central bank demand remains a vital pillar for the metal. The latest World Gold Council survey reveals that 45% of participating institutions expect to increase their gold holdings over the next twelve months, a sentiment that rises to nearly 50% among emerging and developing economies. [52]
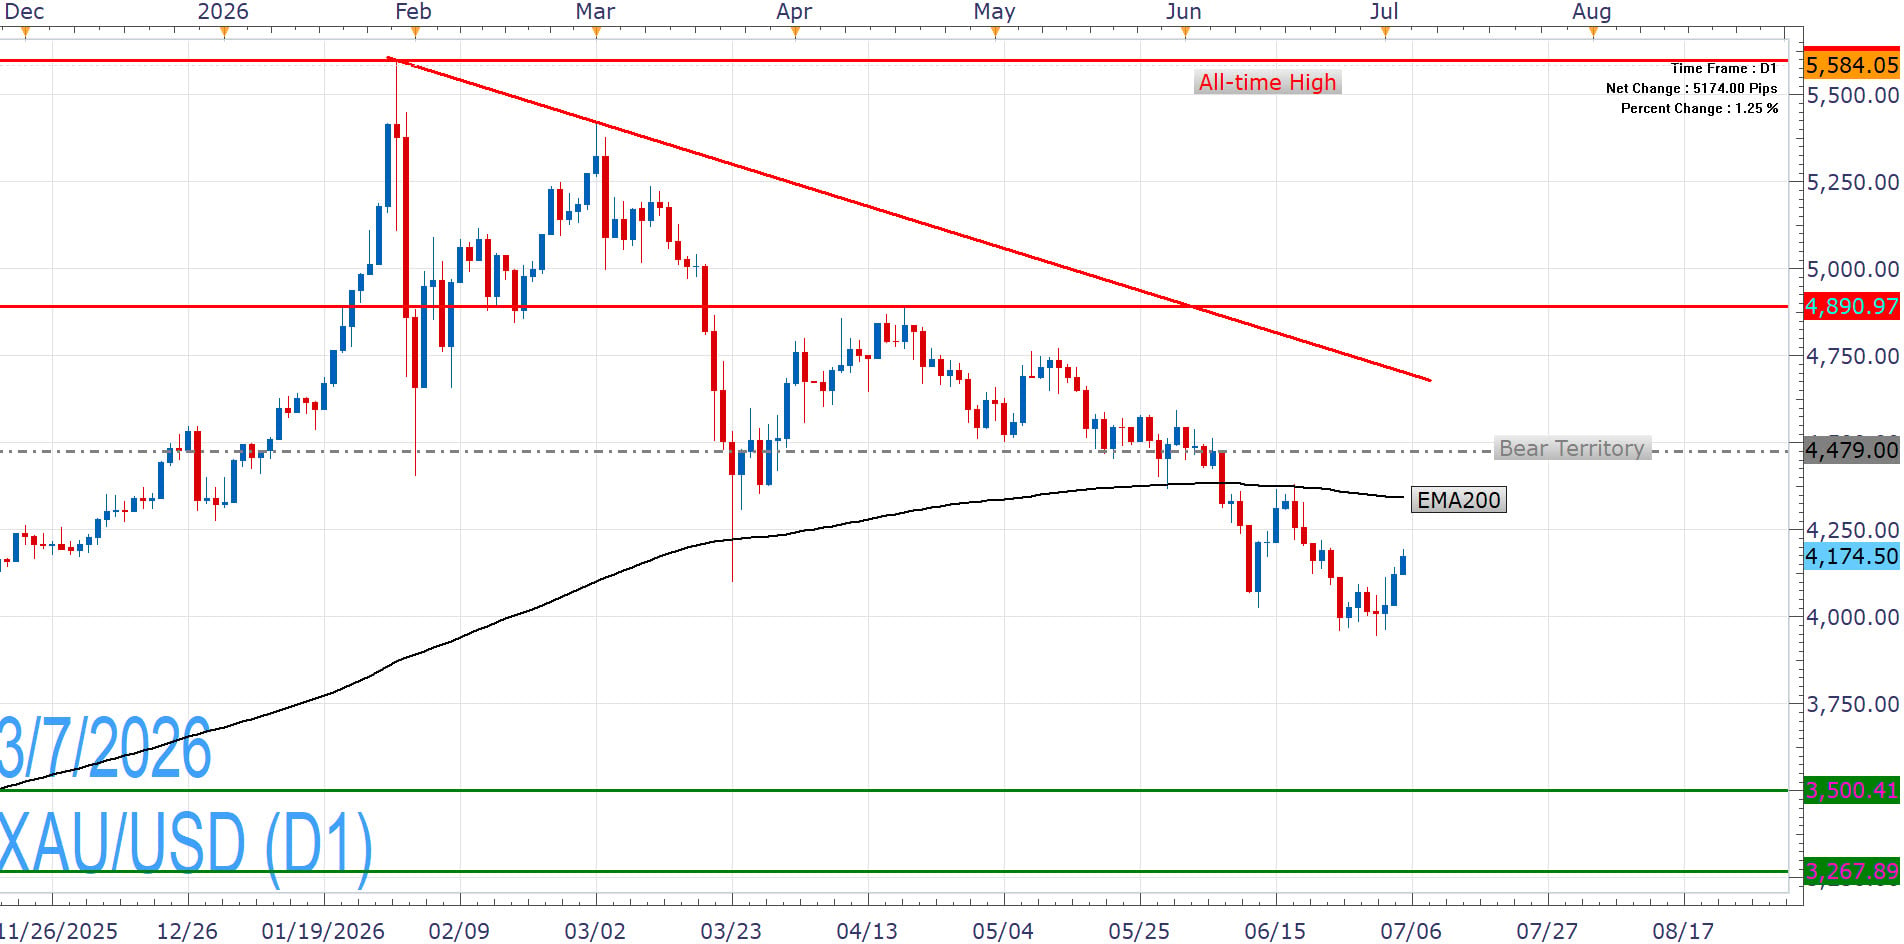
XAU/USD currently faces a tough technical and fundamental landscape that leaves it susceptible to larger losses. Dollar demand, tightening monetary policy and the waning of its traditional safe-haven appeal remain significant headwinds. Yet while XAU/USD may be down, the structural case remains compelling. Dollar strength may have peaked, while its reserve appeal could be reignited and fuel better performance in the second half of the year.
Nikos Tzabouras
Senior Financial Editorial Writer
Nikos Tzabouras is a graduate of the Department of International & European Economic Studies at the Athens University of Economics and Business. With extensive experience in market analysis and a strong foundation in international relations, he brings a unique perspective to financial markets. Nikos emphasizes not only technical analysis but also on fundamentals and the growing influence of geopolitics on financial trends.
As a Senior Financial Editorial Writer, he delivers comprehensive and forward-looking insights across a wide range of asset classes, including equities, commodities, and currencies. His work explores how macroeconomic events, political developments, and global policies impact market dynamics, providing readers with a deeper understanding of both short-term movements and long-term trends.
Any opinions, news, research, analyses, prices, other information, or links to third-party sites contained on this website are provided on an "as-is" basis, as general market commentary and do not constitute investment advice. The market commentary has not been prepared in accordance with legal requirements designed to promote the independence of investment research, and it is therefore not subject to any prohibition on dealing ahead of dissemination. Although this commentary is not produced by an independent source, FXCM takes all sufficient steps to eliminate or prevent any conflicts of interests arising out of the production and dissemination of this communication. The employees of FXCM commit to acting in the clients' best interests and represent their views without misleading, deceiving, or otherwise impairing the clients' ability to make informed investment decisions. For more information about the FXCM's internal organizational and administrative arrangements for the prevention of conflicts, please refer to the Firms' Managing Conflicts Policy. Please ensure that you read and understand our Full Disclaimer and Liability provision concerning the foregoing Information, which can be accessed here.