
Russell Shor

Russell Shor

Senior Market Strategist

Russell Shor is a Senior Market Strategist at FXCM, having been promoted to the role in 2025 in recognition of his depth of insight and consistent delivery of high-impact market analysis. He originally joined FXCM in October 2017 as a Senior Market Specialist.

Russell holds an Honours Degree in Economics from the University of South Africa, is a certified FMVA®, and a full member of the Society of Technical Analysts (UK). With over 20 years of experience in financial markets, his work is renowned for its clarity, precision, and strategic value across asset classes.

Page 112 of 115

  • Gold EMAs Surprisingly Look To Form Bullishly

    Past performance is not an indicator of future results Further to our previous analysis, gold's EMAs are pushing for a more bullish formation. EMAs are trend-following indicators and work under trend conditions. Consolidations tend to lead to whipsaw signals. The shorter-term green EMA has moved into a bullish position, and we are now looking for the mid-term orange EMA to cross above the longer-term red EMA (aqua ellipse). If this…
  • EURUSD Weekly Analysis

    Past Performance is not an indicator of future results. The weekly EURUSD is examined on several levels: 1. Head and shoulders top (blue rectangles). The positively sloped aqua line shows the pattern's neckline. The vertical aqua line derives the pattern's target following its breakout. The target is 1.1134 and is academic - it may or may not be achieved. However, it does give the sense of bearishness associated with breakdown.…

  • MSFT Is Overbought But Fundamentals Make Pullbacks Compelling

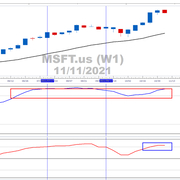
    The MSFT weekly chart is overbought (blue rectangle). At some stage, the RSI will need to normalise. However, weekly conditions are tricky because it may take weeks or even months before correcting. The last overbought condition took two months before clearing (blue verticals). The stochastic has also been showing tremendous strength and has been in the upper region since mid-June (red rectangle). Past Performance: Past Performance is not an indicator…

  • USDOLLAR Charts Higher Peak On Weekly Chart

    Past performance is not an indicator of future results Following our previous analysis, the USDOLLAR has built off of its reference low. This week's price action has charted the next higher peak in a series of higher troughs followed by higher peaks. The USDOLLAR is in a defined uptrend. Furthermore, the greenback's momentum has increased throughout 2021. This is evident by the shift up in gradient from the green trendline…

  • Nominal Yields Adjust Off CPI Print

    Yesterday, the US headline CPI beat the forecast of 5.8% y/y, coming in at 6.2%. The core CPI, which strips out volatile items such as energy and food also beat at 4.6% (4.3% forecast). As such, nominal yields are adjusting. Past performance is not an indicator of future results Source: www.tradingview.com The chart above shows the Heiken Ashi US10Y. Its yield is a nominal yield i.e. it has an inflation…

  • GBPUSD Hurt By GDP Miss

    Past performance is not an indicator of future results The GBPUSD has charted a lower peak followed by a lower trough on a weekly time frame. This is the definition of a downtrend and is considered cable's primary trend. Moreover, the weekly stochastic is rolling over (aqua ellipse); a movement towards the lower quintile (aqua arrow) will be off of GBPUSD weakness. Giving momentum to cable's primary price trend, UK…

  • UK100 Breakout As Wall Street Heavyweight Upgrades UK Shares

    Past performance is not an indicator of future results The UK100, FXCM's proxy for the FTSE 100, has consolidated since May (blue rectangle). However, the index has broken out. The weekly stochastic has moved into the upper quintile (aqua ellipse), and as long as it holds these levels, an underlying bullish momentum is likely to be present. This, as JPMorgan upgrades UK shares to "overweight." The bank maintains that current…

  • AAPL is a Value Creating Machine

    Past performance is not an indicator of future results It's been almost 2 weeks since Apple (AAPL) released its Q4 earnings (we note that AAPL's financial year-end is 29 September). The market was disappointed with the revenue number, which fell short of consensus. CEO Tim Cook attributed this to larger-than-expected supply constraints. Since then, the stock has traded sideways (blue rectangle). However, AAPL is fundamentally a very strong company. Its…

  • SPX500 Fear Index Flashes Short-term Warning

    Past performance is not an indicator of future results The weekly SPX500 is trending up. It has a higher trough followed by a higher peak. At some stage, the current impulse (aqua line) will run out of momentum, and a correction will ensue. As long as the pullback finds support above the previous higher trough, the uptrend remains intact. The weekly RSI is not overbought, but the daily time frame…

  • UKOil Stabilises on Weekly Scale

    Past performance is not an indicator of future results Further to our previous article, we consider UKOil's weekly scale (FXCM's proxy for Bent). After a pullback, UKOil has stabilised with the three EMAs (left chart) showing angle and separation. The right chart is also weekly, but we have zoomed in on the price action. A close above last week's high (aqua horizontal) is bullish, charting a reference low. This is…

  • The Fed Appears To Be Behind The Curve

    Past performance is not an indicator of future results. Source: www.tradingview.com Prior to the Covid-19 pandemic, the US10Y yield (blue line chart) was in decline. At the same time, the 10Y breakeven inflation rate was coming down. This period is denoted by the red down trendlines. The orange box represents most of the 2020 year, as authorities implemented unprecedented monetary stimulus to deal with the fallout of the pandemic. To…

Disclosure

Any opinions, news, research, analyses, prices, other information, or links to third-party sites contained on this website are provided on an "as-is" basis, as general market commentary and do not constitute investment advice. The market commentary has not been prepared in accordance with legal requirements designed to promote the independence of investment research, and it is therefore not subject to any prohibition on dealing ahead of dissemination. Although this commentary is not produced by an independent source, FXCM takes all sufficient steps to eliminate or prevent any conflicts of interests arising out of the production and dissemination of this communication. The employees of FXCM commit to acting in the clients' best interests and represent their views without misleading, deceiving, or otherwise impairing the clients' ability to make informed investment decisions. For more information about the FXCM's internal organizational and administrative arrangements for the prevention of conflicts, please refer to the Firms' Managing Conflicts Policy. Please ensure that you read and understand our Full Disclaimer and Liability provision concerning the foregoing Information, which can be accessed here.

Spreads Widget: When static spreads are displayed, the figures reflect a time-stamped snapshot as of when the market closes. Spreads are variable and are subject to delay. Single Share CFD prices are subject to a 15 minute delay. The spread figures are for informational purposes only. FXCM is not liable for errors, omissions or delays, or for actions relying on this information.