
Market Threads – Oil, the Dollar, Gold and Japan Face Their Next Defining Move

.png)
Tracking important market threads across currencies, commodities, and indices.
- Oil at a crossroads: bearish charts point lower, but one geopolitical shock could ignite UKOil and USOil.
- USDOLLAR breakdown ahead? Falling yields, yen intervention and the battle at 12,675 could decide the next big move.
- Gold on the brink? Bullish momentum, softer yields and central-bank demand are pushing XAUUSD towards a potentially explosive break above $4,200.
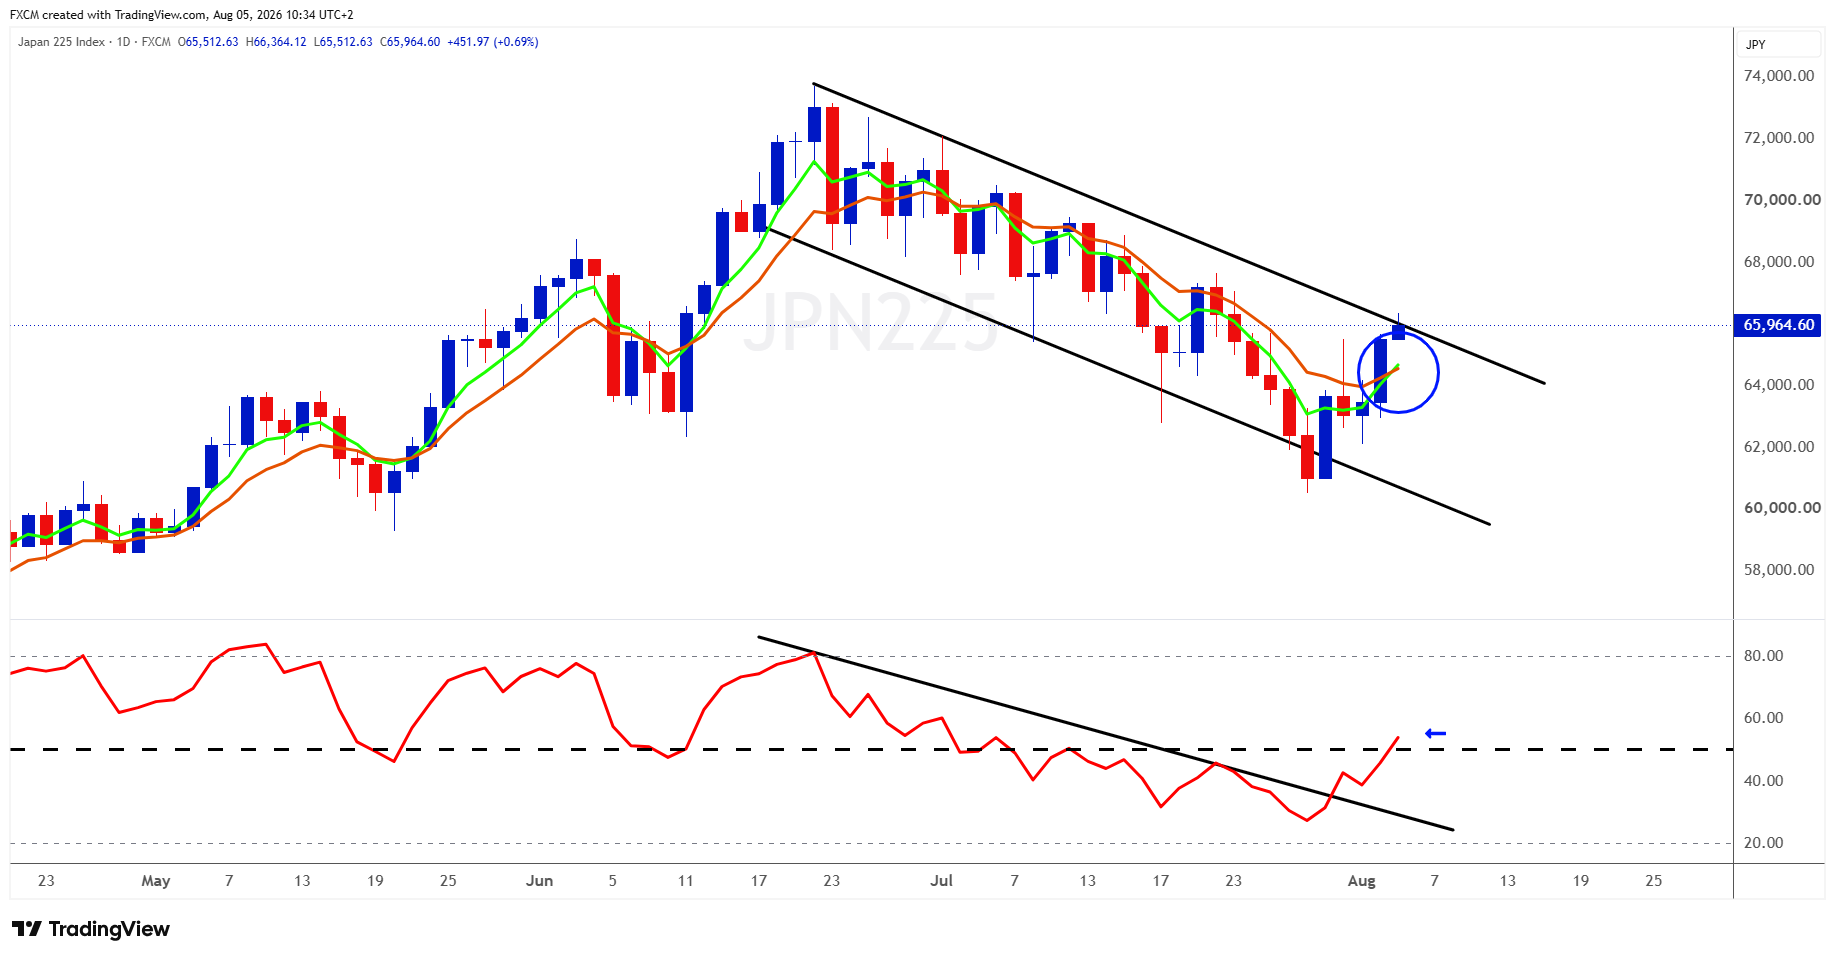
- JPN225 at a turning point: can improving momentum and tech optimism overpower rising yields and a firmer yen at 66,400?
Cross Asset View
Global markets are approaching a series of decisive technical and fundamental crossroads. Oil is weakening as geopolitical risk premiums fade, the USDOLLAR has lost momentum as short-term yields ease, XAUUSD is pressing against major resistance, and JPN225 is testing whether its recovery can develop into something more durable. The next breakout or breakdown across these markets could reveal where investors are placing their strongest conviction.
Oil
Technical Analysis
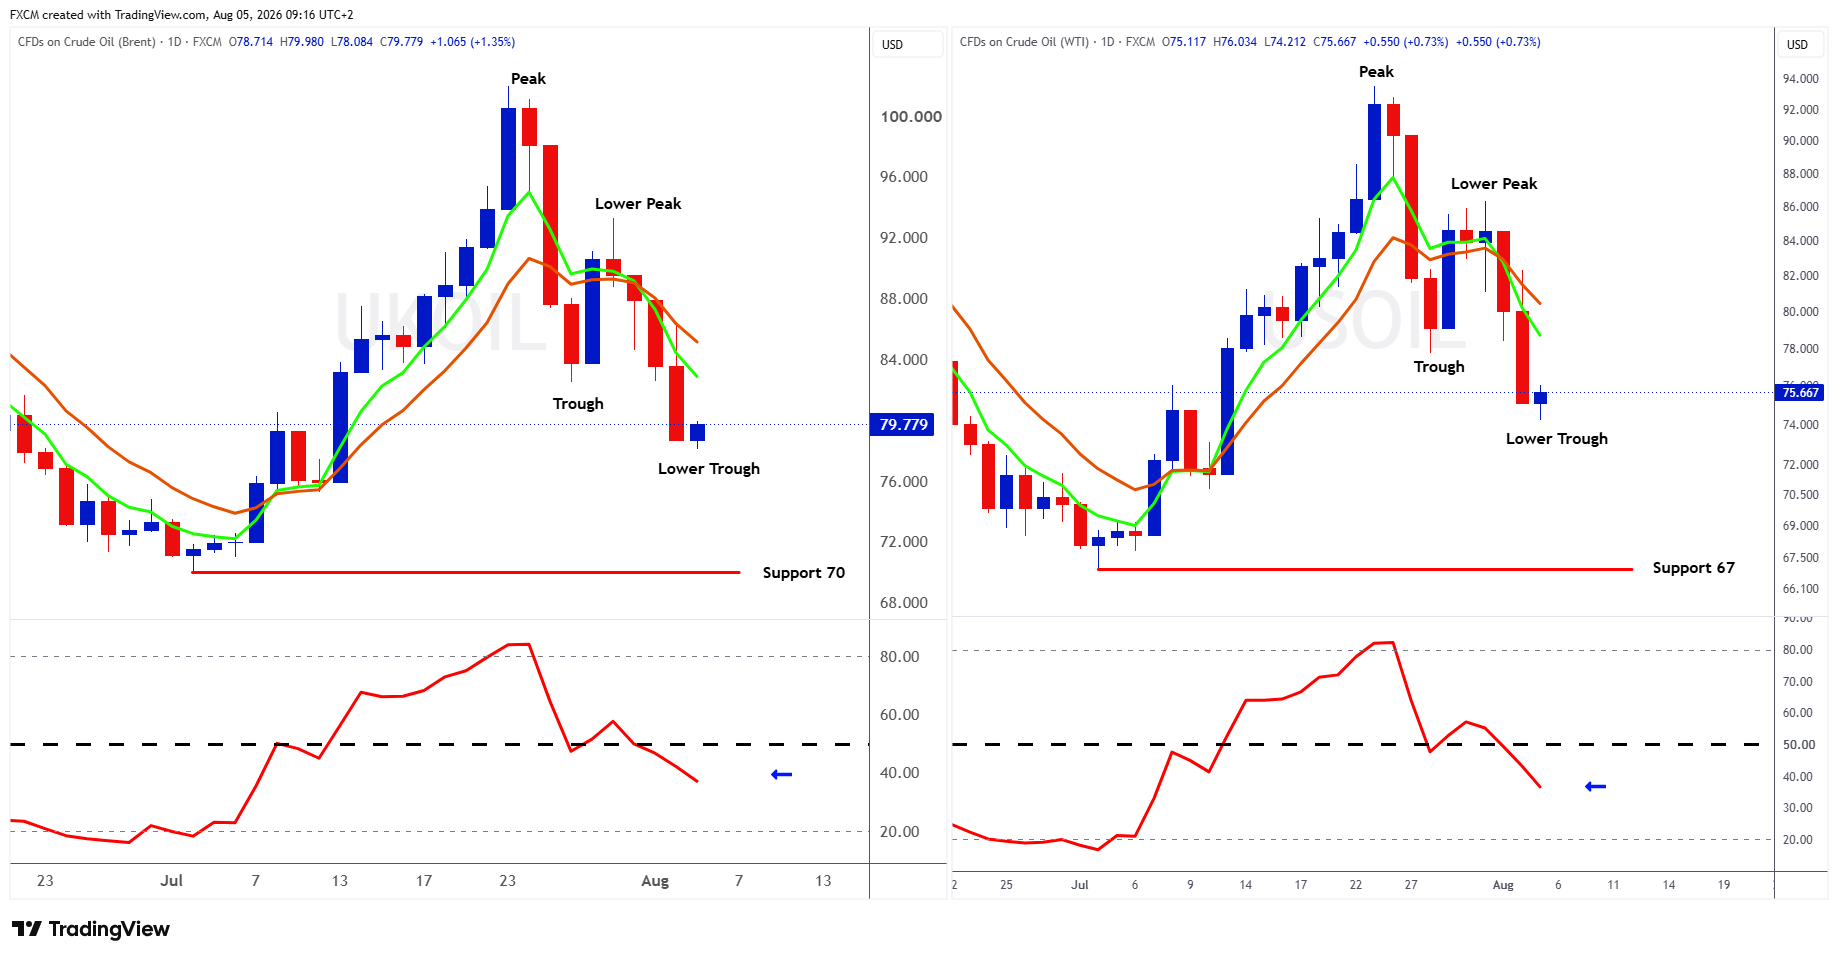
UKOil's technical structure has turned bearish after the July peak was followed by a lower peak and a decisive lower trough. Price remains below both declining moving averages, with the faster average now beneath the slower one. The RSI has slipped to roughly 39 and is still falling, confirming weak momentum without yet reaching the chart's lower extreme. A recovery through approximately $83-85 would begin to improve the picture, while the lower-peak region around $89-91 remains the key obstacle to any broader trend reversal. Until those levels are reclaimed, the balance of risk remains lower, with $70 representing the major support zone shown on the chart.
USOil displays a bearish breakdown, having moved from a July peak to a lower peak before falling beneath its previous trough and establishing a lower low. Price is below both downward-sloping moving averages, confirming that sellers retain control. RSI has fallen to approximately 35, signalling substantial downside pressure, although it has not yet reached the lower extreme marked on the chart. A rebound towards $78-80 could encounter resistance around the broken trough and faster moving average, while the heavier resistance zone lies near $82-85. Unless USOil can reclaim that area, rallies are likely to remain corrective, with the marked $67 region serving as the chart's major longer-term support rather than a guaranteed target.
Fundamental Perspective
The sell-off in UKOil and USOil is fundamentally a wager that diplomacy will restore safer tanker traffic through the Strait of Hormuz before the supply squeeze deepens. Oil prices fell as US and Qatari officials reported progress, although Iran maintains that its negotiations are with Oman rather than directly with Washington, leaving the outcome uncertain.
The waterway remains crucial. In 2024, its oil flows equalled roughly 20% of global petroleum-liquids consumption, while about one-fifth of global LNG trade also passed through it. OPEC+ has authorised a 188,000-barrel-per-day production adjustment for September, but this is better regarded as a medium-term bearish signal because recent quota increases have largely remained on paper amid export disruptions.
Meanwhile, the EIA's July forecast still envisages global inventories falling by 2.2 million barrels per day in the third quarter before building by 2.7 million barrels per day in the fourth. Oil is therefore caught between near-term scarcity and the prospect of later oversupply. A durable Hormuz agreement would reinforce the bearish technical picture, while renewed threats to physical supply could quickly rebuild the geopolitical premium.
USDOLLAR
Technical Analysis
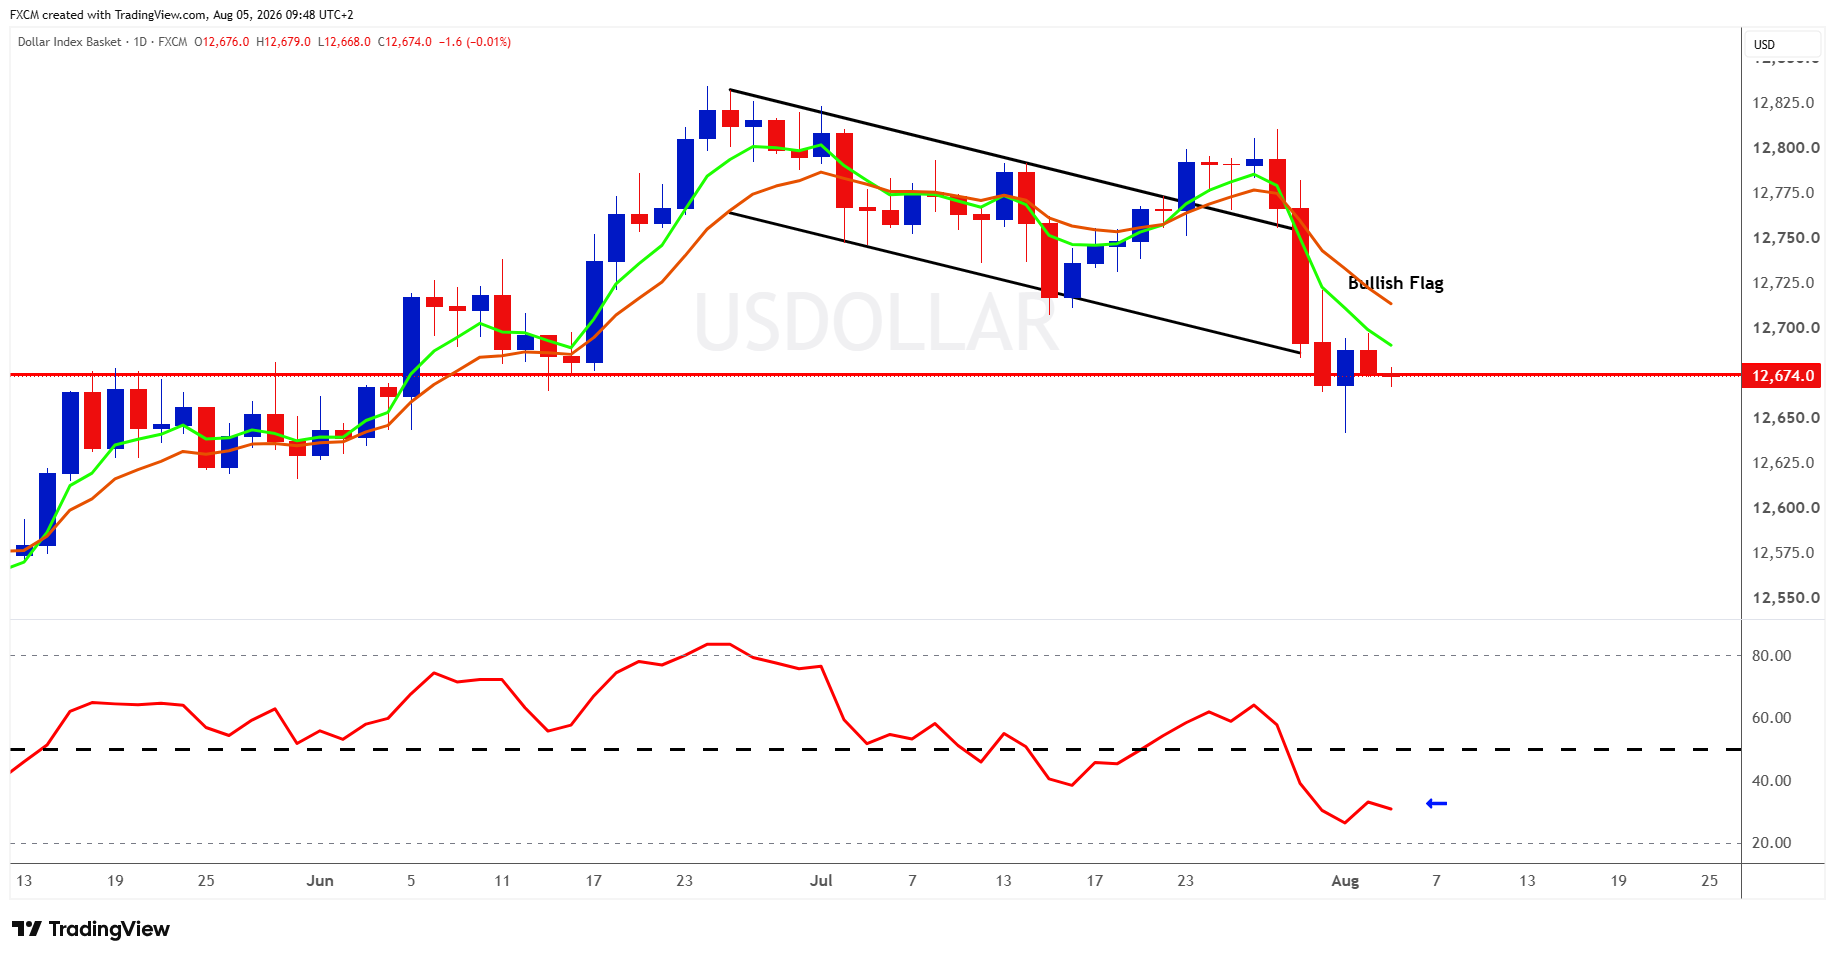
USDOLLAR's bullish flag has failed, with a sharp daily breakdown beneath the lower channel boundary followed by an inability to mount a convincing recovery. Price is now below both declining moving averages, and the faster average has crossed beneath the slower one, reinforcing the deterioration in trend. The market is hovering around 12,675, a pivotal level that previously acted as both resistance and support, making it the immediate battleground between buyers and sellers. RSI briefly slipped below 30 before recovering to roughly 32, signalling stretched but still firmly bearish momentum. A sustained close below 12,675 would strengthen the case for a move towards 12,650 and then the former consolidation around 12,625, while a recovery through roughly 12,700-12,725 would be required to reclaim the moving-average cluster and begin repairing the failed pattern.
Fundamental Perspective
The bullish flag failed as two important sources of dollar support weakened in quick succession. After the Federal Reserve's 9-3 decision on 29 July to leave rates at 3.50%-3.75%, the two-year Treasury yield fell 3.52 basis points to 4.24% as markets reduced expectations for immediate tightening, taking some of the interest-rate support away from the greenback. Japan was then reported to have sold dollars and bought yen on 30 July, followed by officially confirmed coordinated intervention with the United States on 31 July, helping to accelerate the dollar's technical breakdown. Moreover, falling oil prices and hopes of progress over the Strait of Hormuz had reduced inflation concerns, pushed the two-year yield towards a two-week low and lowered the implied probability of a September Fed hike to 56.9% from 67.2%. The cleanest conclusion is that softer short-rate expectations and official yen buying combined to turn an already vulnerable dollar pattern into a failed bullish flag.
Gold
Technical Analysis
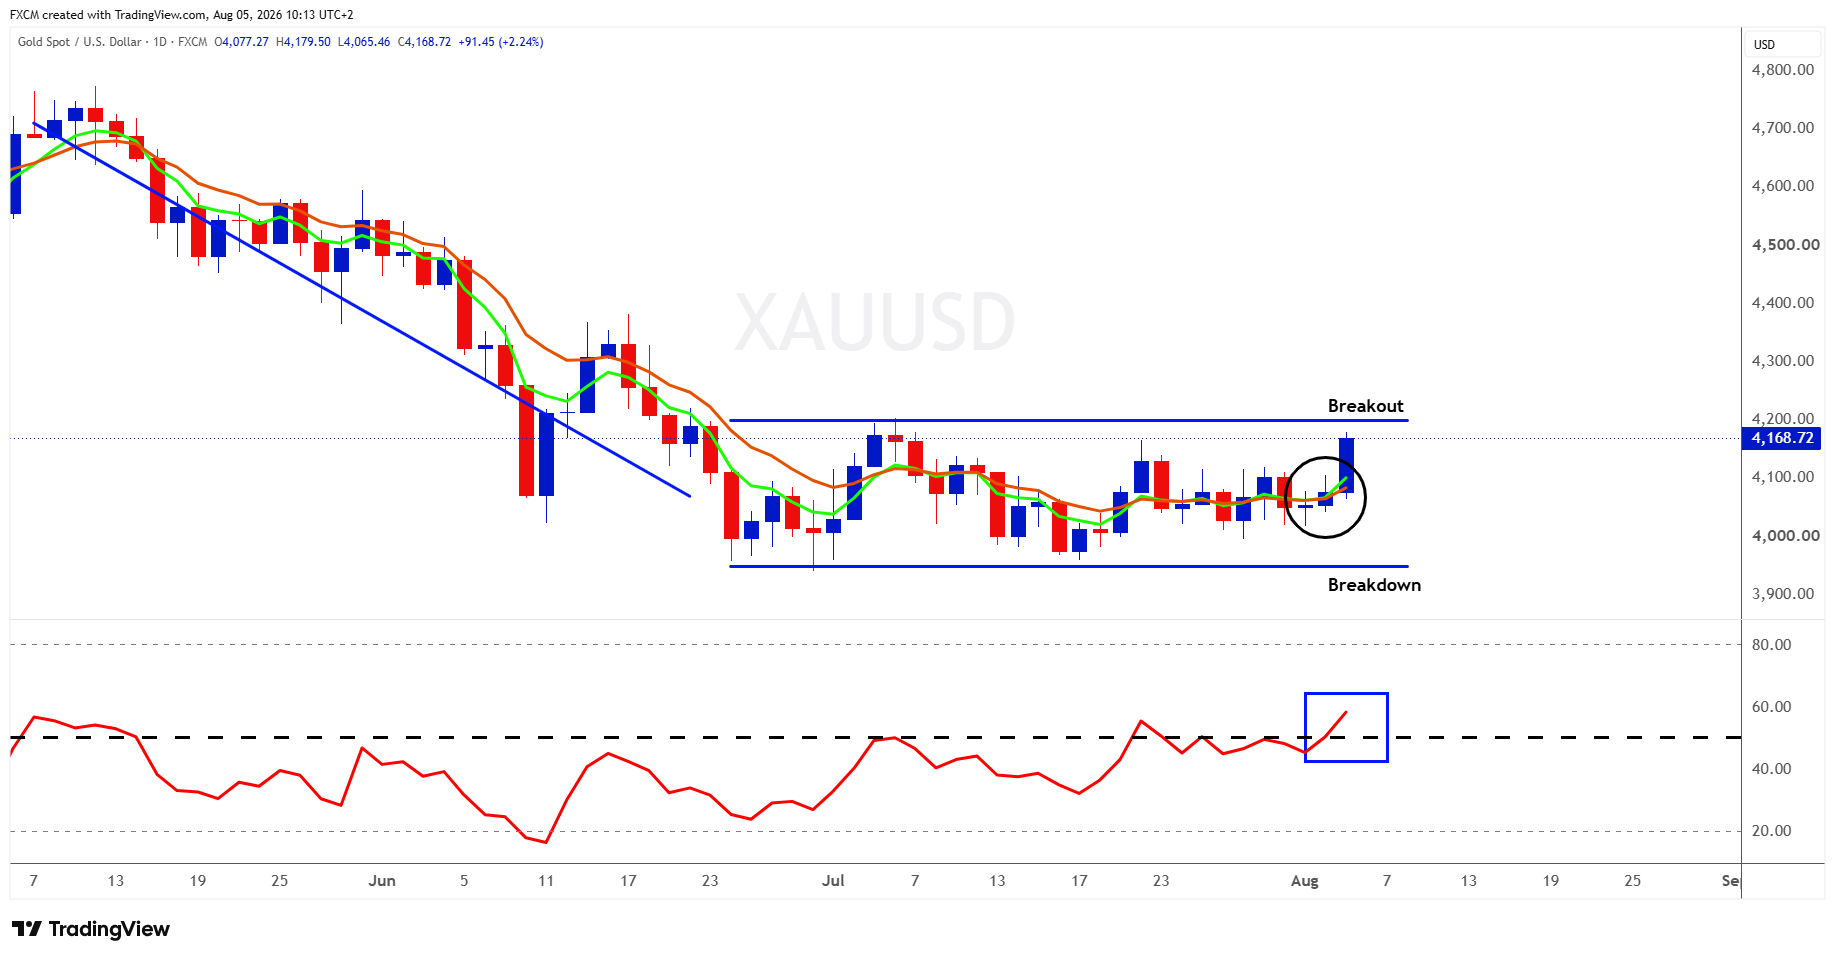
XAUUSD remains contained between major resistance near $4,200 and support around $3,950, leaving the range unresolved rather than clearly identifiable as either accumulation or distribution. The near-term evidence does, however, carry a bullish tilt. Price is testing the upper boundary, the shorter EMA has moved above the longer EMA, recent pullbacks have formed progressively higher lows, and RSI has risen above 50 to roughly 58 without approaching overbought territory. Buyers still need a convincing daily close above $4,200 to confirm a breakout and strengthen the case for a new upward leg. Rejection from this area would preserve the sideways range, while a decisive close below $3,950 would resolve it bearishly and place the broader downtrend back in control.
Fundamental Perspective
XAUUSD is seemingly benefiting from a counterintuitive de-escalation trade. Progress towards easing the US-Iran conflict has pushed oil lower, reducing inflation concerns and expectations for another Federal Reserve rate increase. The market-implied probability of a September hike fell to about 56.9% from 67.2%, while Treasury yields dipped and the USDOLLAR remained subdued near a six-week low, an encouraging combination for non-yielding bullion.
Longer term, official-sector demand remains supportive, with the World Gold Council estimating that central banks accumulated an average of roughly 1,000 tonnes annually over the past four years and 89% of its 2026 survey respondents expecting global official reserves to rise further.
Yet geopolitics is not automatically bullish for gold. Renewed tension could revive safe-haven buying, but it could also lift oil, inflation expectations, yields and the dollar. As gold tests the top of its range, the direction of interest rates and the greenback may therefore matter more than whether the next headline signals peace or escalation.
Copper on the Brink of a Breakout
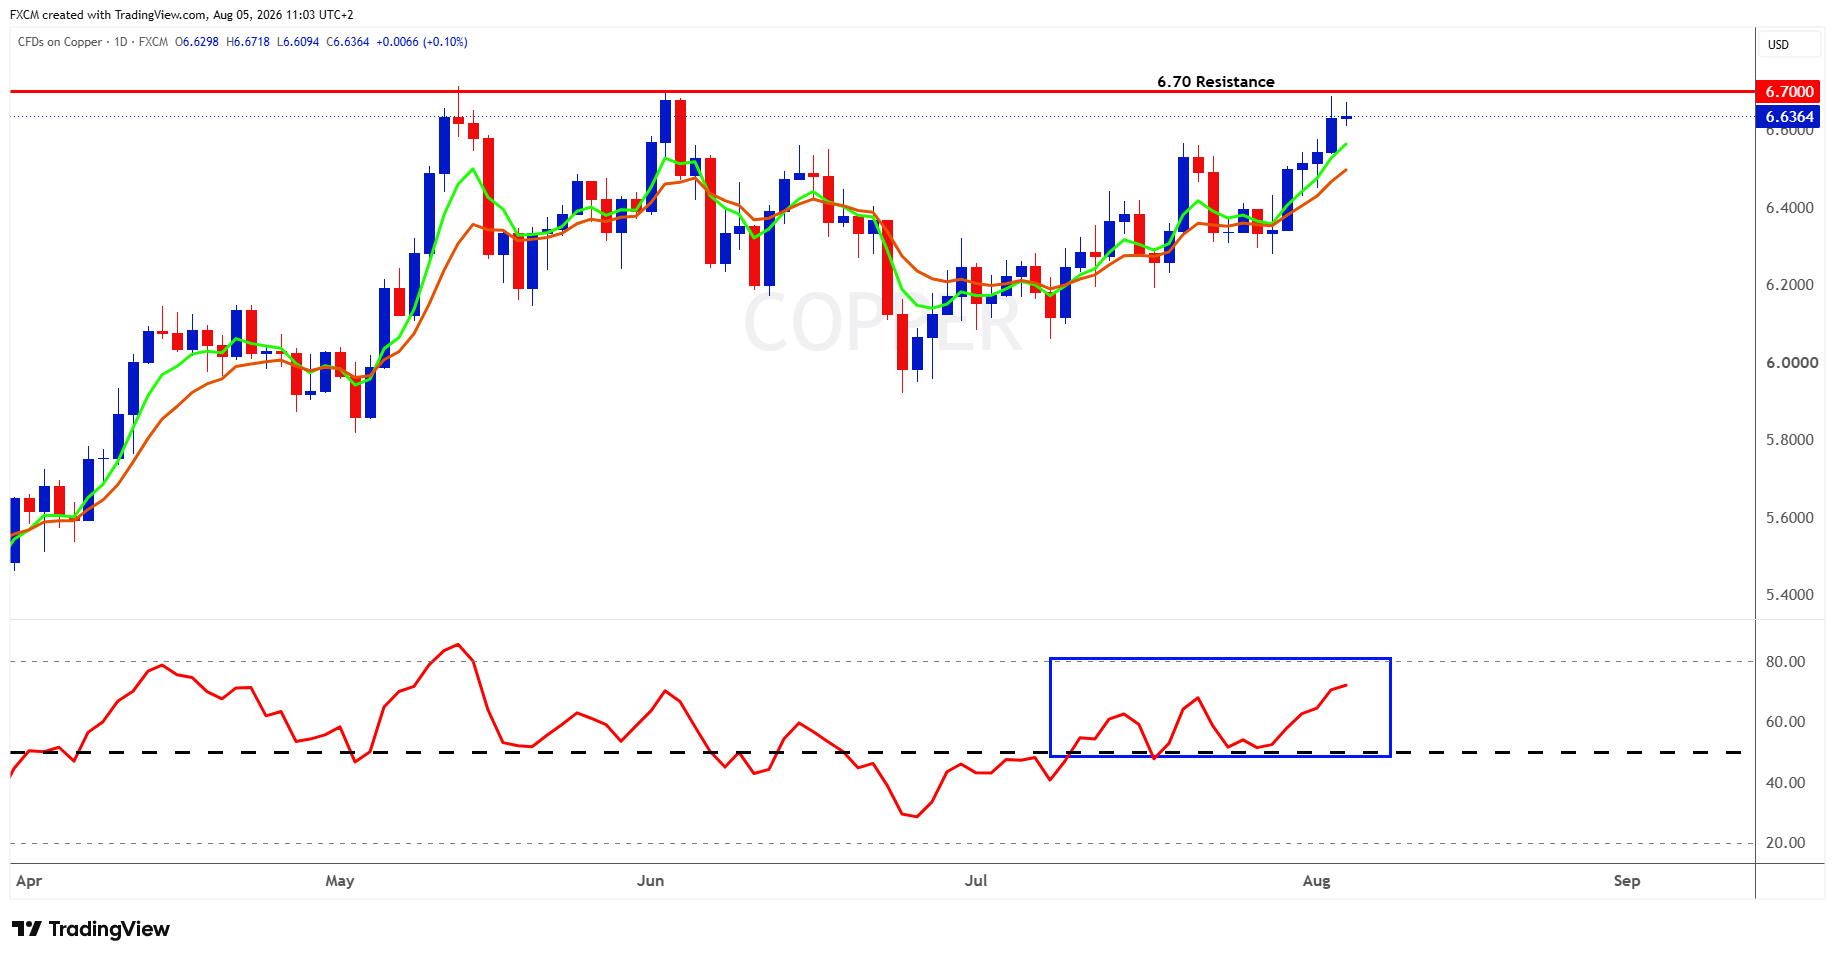
Copper is approaching the well-established $6.70 resistance level for the third time since May, supported by rising EMAs, widening bullish separation and an RSI in the low 70s, indicating strong, albeit somewhat stretched, momentum. A convincing daily close above $6.70, followed by sustained trading or a successful retest, would confirm a breakout from the multi-month range; rejection would keep the ceiling intact and place initial support around the EMA zone near $6.48-$6.55.
Copper is known as Dr Copper because its widespread use in construction, manufacturing, transport and power infrastructure makes it a useful barometer of industrial activity. Recent support has come from a rebound in Chinese import demand and rapidly declining Shanghai and LME inventories, while grid investment and AI data centres strengthen the longer-term demand story.
A breakout could signal increasingly powerful buying and tightening immediately available supply, but confirmation from physical-demand indicators would be helpful before diagnosing a broader acceleration in the global economy.
Index in Focus: JPN225
Technical Analysis
The JPN225 rebound has reached an important test near 66,000-66,400, where price is pressing against the upper boundary of its descending channel. Momentum has improved meaningfully. RSI has climbed above 50 and broken its declining trendline, while the shorter EMA has crossed above the longer EMA. However, the reversal signal remains young, and the moving averages still need to develop a clearer upward slope and wider separation to confirm that the recovery is becoming an established trend. A convincing daily close above roughly 66,400 would strengthen the bullish case and bring the 68,000 region into view, whereas rejection would leave the index vulnerable to a retreat towards the EMA cluster and support around 63,500-64,000. Sustained strength above that area would suggest that buyers increasingly regard the recent pullback as an attractive entry point rather than the start of a deeper decline.
Fundamental Perspective
Japan's equity outlook is being pulled in two directions. Tokyo's proposed temporary reduction in the tax on food could ease household budgets and support consumption, but investors remain uneasy about how the government will replace approximately ¥5 trillion in lost annual revenue. That concern has helped keep Japanese bond yields elevated, while reports that Prime Minister Sanae Takaichi previously encouraged the BOJ to buy more bonds illustrate the tension between supporting markets and protecting fiscal credibility. Meanwhile, cheaper oil and renewed enthusiasm for technology shares are helping JPN225, although a firmer yen can reduce the domestic value of exporters' foreign earnings. A breakout from the descending channel would suggest that the market is giving greater weight to growth and earnings prospects; rejection would return attention to government finances, borrowing costs and currency uncertainty.

Russell Shor
Senior Market Strategist
Russell Shor is a Senior Market Strategist at FXCM, having been promoted to the role in 2025 in recognition of his depth of insight and consistent delivery of high-impact market analysis. He originally joined FXCM in October 2017 as a Senior Market Specialist.
Russell holds an Honours Degree in Economics from the University of South Africa, is a certified FMVA®, and a full member of the Society of Technical Analysts (UK). With over 20 years of experience in financial markets, his work is renowned for its clarity, precision, and strategic value across asset classes.

Any opinions, news, research, analyses, prices, other information, or links to third-party sites contained on this website are provided on an "as-is" basis, as general market commentary and do not constitute investment advice. The market commentary has not been prepared in accordance with legal requirements designed to promote the independence of investment research, and it is therefore not subject to any prohibition on dealing ahead of dissemination. Although this commentary is not produced by an independent source, FXCM takes all sufficient steps to eliminate or prevent any conflicts of interests arising out of the production and dissemination of this communication. The employees of FXCM commit to acting in the clients' best interests and represent their views without misleading, deceiving, or otherwise impairing the clients' ability to make informed investment decisions. For more information about the FXCM's internal organizational and administrative arrangements for the prevention of conflicts, please refer to the Firms' Managing Conflicts Policy. Please ensure that you read and understand our Full Disclaimer and Liability provision concerning the foregoing Information, which can be accessed here.