
Market Threads – Tension Builds as Oil, Yields and AI Risks Collide

.png)
Tracking important market threads across currencies, commodities, and indices.
- Oil remains firmly bullish, but overbought momentum and mounting demand risks could set up the next pullback opportunity.
- USDOLLAR is threatening to break its bearish sequence, with 12,633 the key battleground as momentum improves ahead of the Fed.
- Gold is testing crucial support at 4,280, with the Fed and momentum signals setting up the next decisive move.
- SPX500 is testing 7,580 support as rising yields, $100-plus oil and AI uncertainty put the bull case under pressure.
When 5% Becomes a Refinancing Problem
The US 10-year Treasury yield above 5% is unlikely to trigger an immediate financial shock, but persistently expensive funding could steadily expose areas of financial vulnerability. Housing is particularly sensitive as higher mortgage costs weigh on affordability and transaction activity, while leveraged companies face increasing refinancing pressure as cheaper debt matures. Banks appear relatively well positioned for now, but prolonged financial stress among borrowers could eventually weaken credit performance. The more important issue is therefore the cumulative effect of expensive capital over time, particularly as a growing share of corporate and property debt has to be refinanced at today's materially higher rates.
Cross-Asset View
Markets are navigating an increasingly awkward mix of $100-plus oil, elevated bond yields and fresh calls to slow AI development, all of which are challenging risk appetite and putting pressure on equities while supporting the dollar's rate-sensitive backdrop. Yet the picture is not one-way. Oil has eased from its recent highs, Treasury yields have pulled back slightly, the expected Fed move is already heavily priced, and strong earnings alongside continued AI investment still provide an important cushion for equities. The result is a finely balanced cross-asset environment in which momentum remains fragile, but the underlying growth and earnings story has not yet broken.
Oil
Technical Analysis
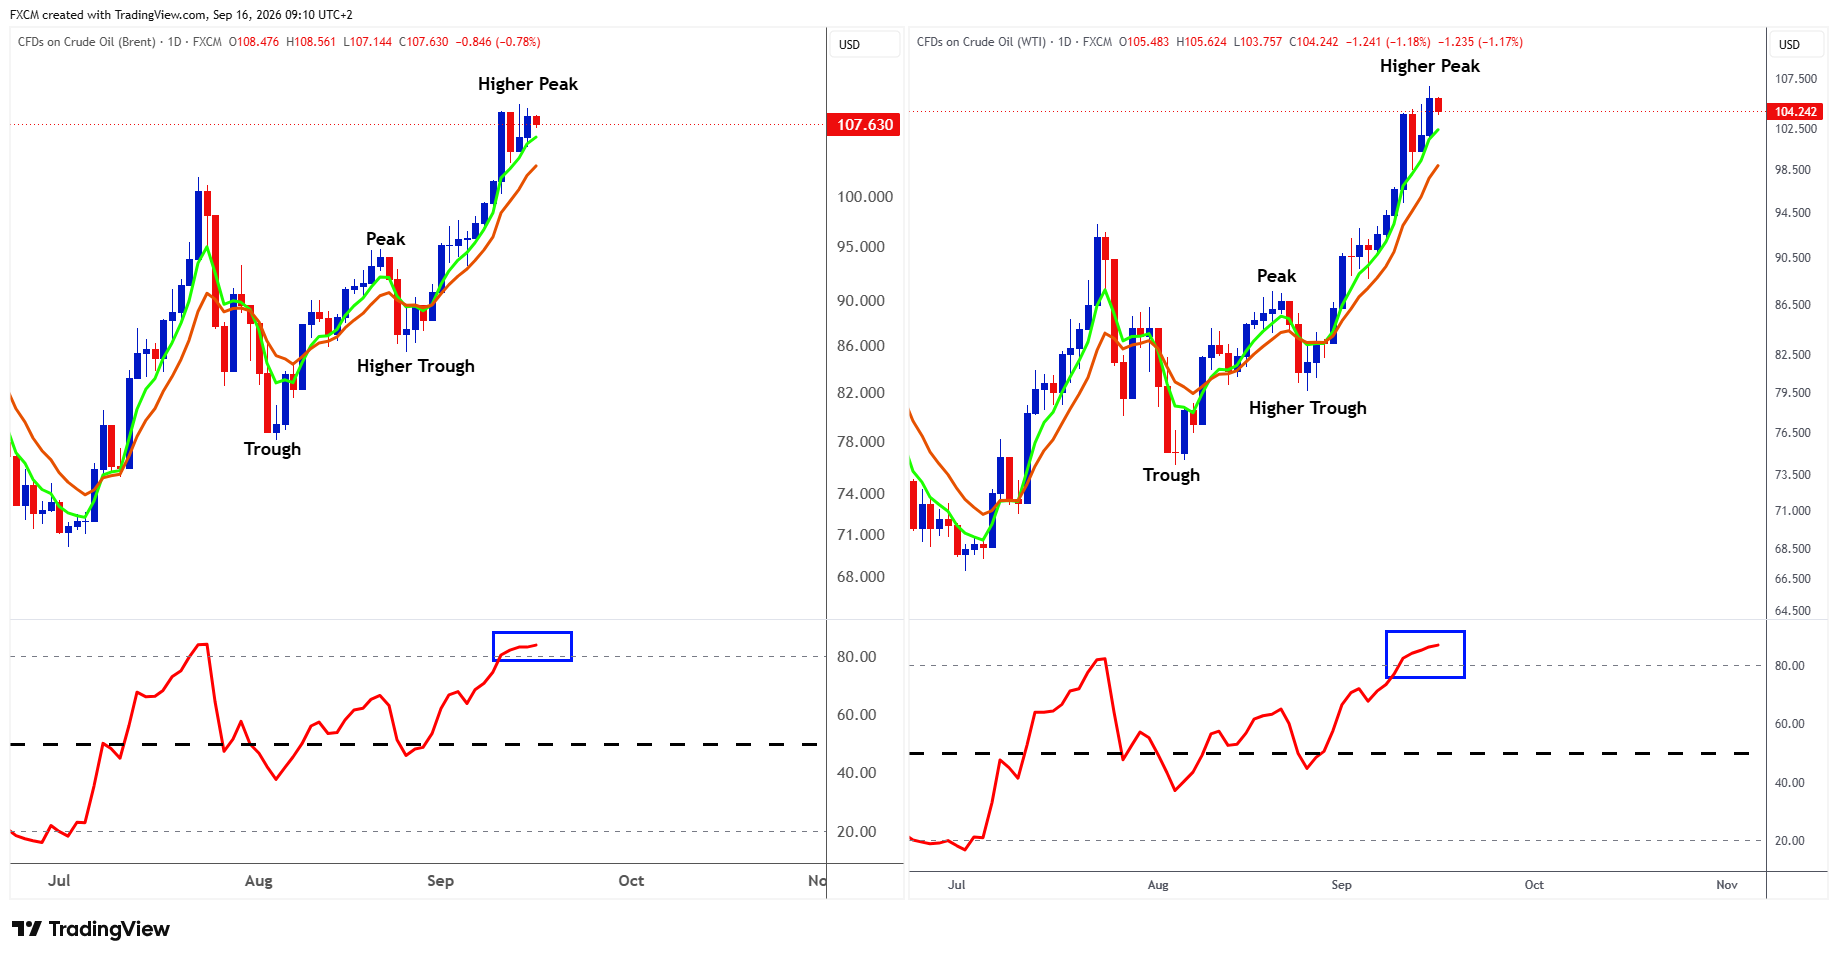
UKOil remains in a strong daily uptrend, with the sequence of higher troughs and higher peaks still intact and price holding comfortably above both rising moving averages. The latest push to fresh highs near $108 confirms continued upside momentum, but the RSI is now firmly overbought above 80. That does not by itself signal a reversal, particularly in a strong trend, but it does increase the probability of a near-term pause, consolidation or pullback while momentum normalises. Initial support sits around the recent $100 breakout area, with the broader bullish structure remaining intact while the latest higher trough holds.
USOil shows a similarly constructive technical structure, with higher peaks and higher troughs, rising moving averages and price still trading well above trend support. The move towards $105 has been accompanied by an RSI reading above 80, leaving the market technically stretched in the short term. A period of sideways trade or a modest retracement would therefore be a reasonable probability as the RSI cools, rather than necessarily signalling the end of the advance. The key technical point is that momentum remains bullish, but risk-reward has become less attractive at current levels; a pullback towards the recent breakout zone or short-term moving average would be healthier provided the higher-trough structure remains intact.
Fundamental Perspective
The fundamental backdrop for UKOil and USOil remains supportive but increasingly two-sided. Middle East supply disruption remains the principal bullish force, with crude loadings at Saudi Arabia's Yanbu hub halted following damage to the East-West Pipeline and some late-September cargoes cancelled or delayed. Meanwhile, preliminary tracking data showed just four commodity vessels crossing the Strait of Hormuz on Tuesday, versus a ten-day average of 18, although untracked vessels may mean actual traffic was somewhat higher.
Saudi Aramco is attempting to ease the bottleneck by offering additional crude through ship-to-ship transfers off Sohar, Oman. Against that, elevated energy prices are increasingly weighing on consumption. The IEA now forecasts global oil demand to decline by 2.5 million barrels per day in 2026. Near term, API estimates showing an unexpected 7.1 million-barrel increase in US crude inventories, alongside builds in gasoline and diesel stocks, have provided a catalyst for profit-taking, although official EIA data are still awaited.
In combination, tight physical supply continues to underpin oil prices, but weakening demand and signs of inventory accumulation provide a credible fundamental backdrop for the pause or pullback suggested by the overbought technical readings.
USDOLLAR
Technical Analysis
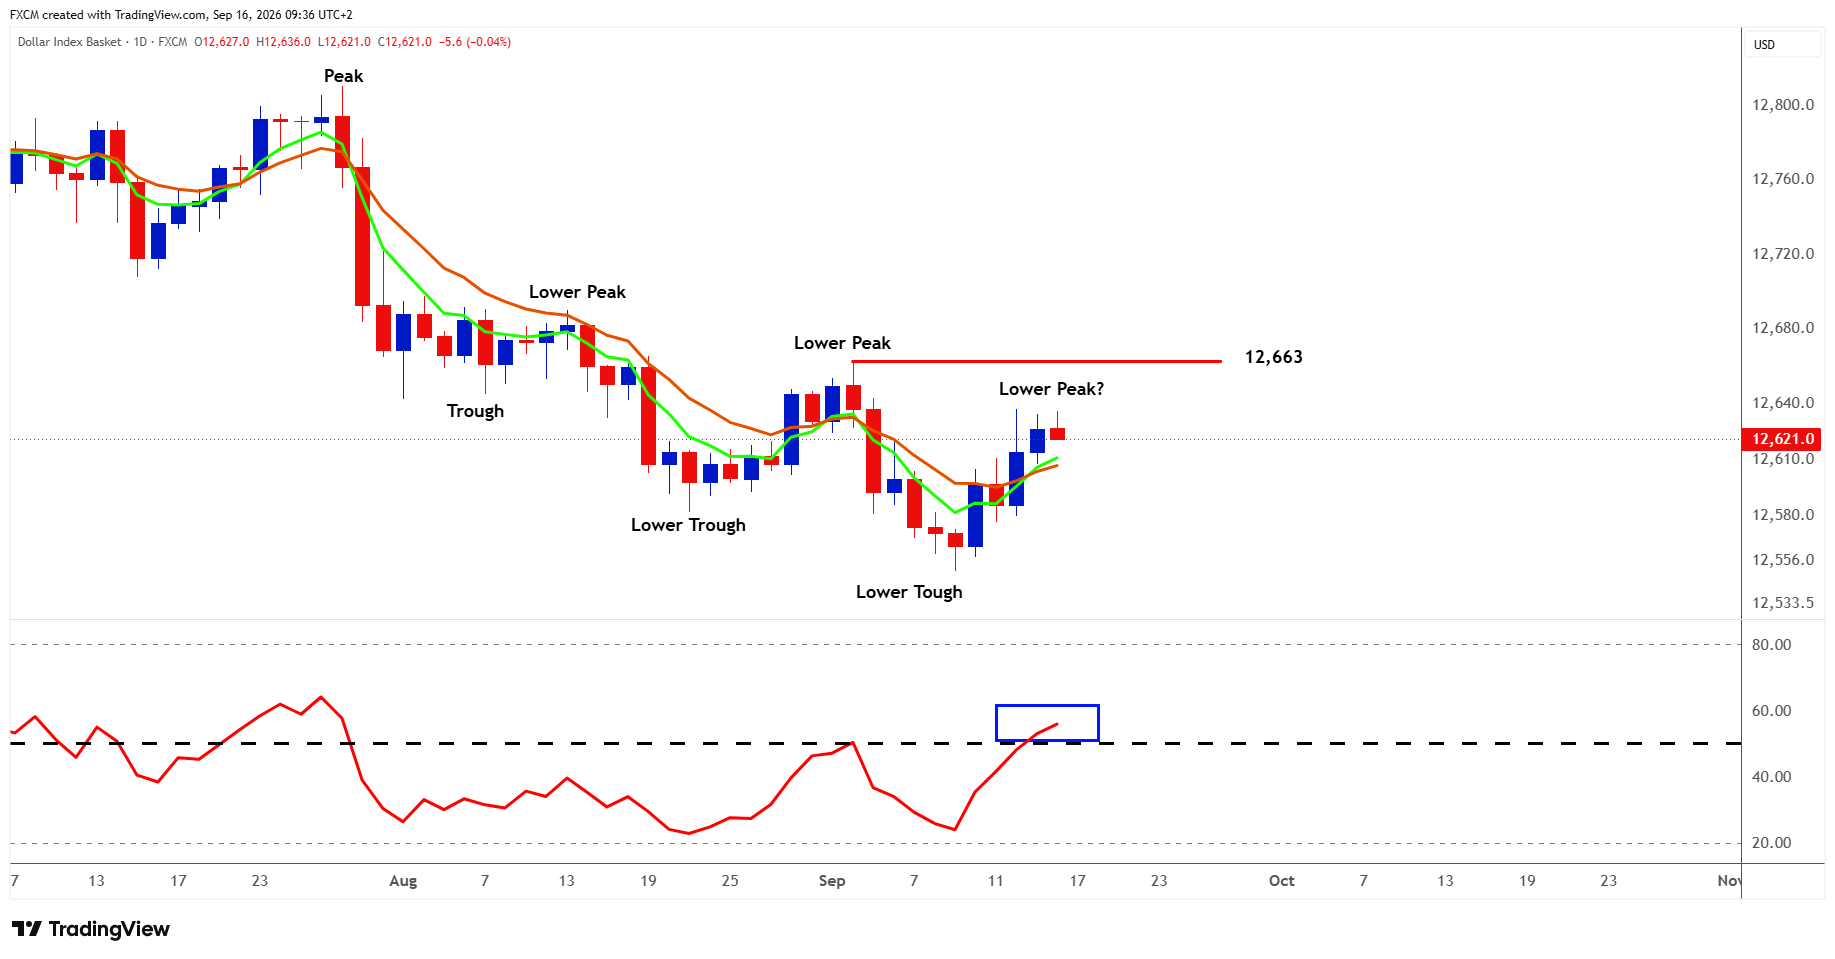
USDOLLAR remains within a broader sequence of lower peaks and lower troughs, so the prevailing daily structure is still bearish, but the latest rebound is beginning to challenge that pattern. Price has recovered back above the short-term moving averages and RSI has pushed through the key 50 level, suggesting momentum is improving; if RSI can hold above 50, the current rally may have enough strength to test and potentially overcome the previous swing peak around 12,633. A sustained break above that level would end the sequence of lower peaks and provide the first meaningful sign that the downtrend is losing control, particularly if it is followed by a higher trough. Conversely, if USDOLLAR stalls below resistance and RSI slips back under 50, the present advance may simply be charting another lower peak, leaving the bearish structure intact and putting the recent trough near 12,560 back into focus.
Fundamental Perspective
USDOLLAR is caught between increasingly supportive US rate expectations and the fact that much of the Fed repricing is already reflected in markets. A 25bp increase in the federal funds rate to 3.75%–4.00% today is now roughly 90% priced, following firmer inflation data and the surge in oil prices above $100, which have revived concerns over persistent price pressures. Those forces have helped drive the US 10-year Treasury yield through 5% before a modest retreat this morning and have supported the dollar near multi-week highs. With the hike itself largely anticipated, attention is likely to fall on Chair Kevin Warsh's comments and the Fed's updated dot plot and economic projections for clues on whether further tightening lies ahead. At the same time, expectations of a Bank of Japan rate increase on Friday have helped underpin the yen's broader recovery, providing a counterweight to US dollar strength. Fundamentally, a Fed message pointing towards additional tightening would strengthen the case for USDOLLAR challenging the 12,633 technical barrier, while a hold or a hike accompanied by language that plays down further increases, could see the current recovery lose momentum and leave the sequence of lower peaks intact.
Gold
Technical Analysis
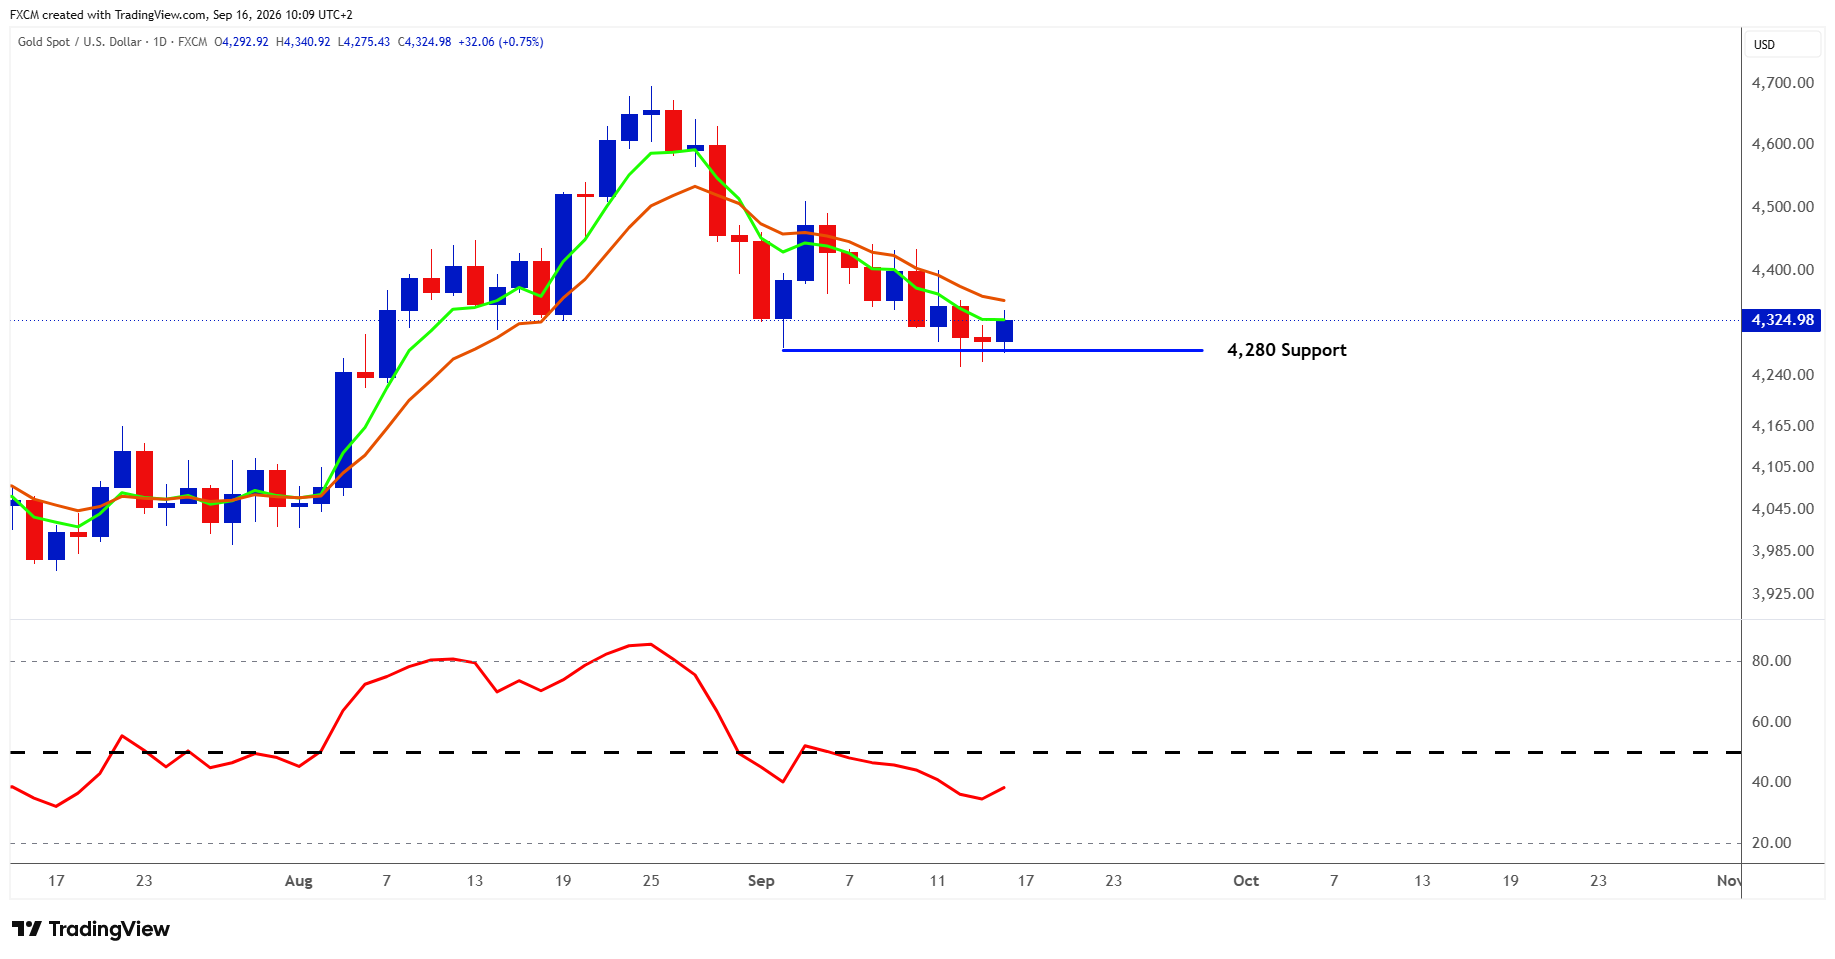
Gold remains technically vulnerable after the sharp reversal from its late-August peak, with price still trading beneath a declining longer-term moving average and the recent sequence of lower highs keeping near-term pressure tilted to the downside. The key battleground is the 4,280 support zone: RSI is currently below the neutral 50 level, and if it remains there, momentum would continue to favour a break of support and a deeper retracement. Conversely, a recovery in RSI back above 50 would suggest selling pressure is fading and materially improve the probability that 4,280 holds. On the upside, gold would still need to reclaim the moving-average resistance area around 4,350–4,400 to strengthen the recovery case; until then, any bounce remains vulnerable to being sold into. A decisive break below 4,280 would therefore confirm renewed downside momentum, while a successful defence of support accompanied by an RSI move above 50 would be the first meaningful sign that the correction is stabilising.
Fundamental Perspective
XAUUSD is caught between a tightening US rate backdrop and continuing demand for safe-haven assets. Spot gold has rebounded by around 0.8% today to roughly $4,327 after touching a more-than-one-month low earlier in the week, as investors await the Federal Reserve decision with markets pricing about a 93% probability of at least a 25bp rate increase. Higher interest rates and elevated Treasury yields remain important headwinds for non-yielding gold, although today's retreat in oil has provided some relief from immediate inflation concerns while the US 10-year yield has eased marginally after breaching 5% on Tuesday. Meanwhile, ongoing Middle East tensions and political uncertainty continue to provide a degree of safe-haven support, while a World Gold Council survey showing that 45% of responding central banks intend to increase their gold holdings over the next year reinforces the longer-term demand story. That leaves the 4,280 technical support particularly important: a hawkish Fed message and a renewed rise in yields could increase downside pressure, while a less aggressive policy signal could support a recovery and improve the prospects of RSI reclaiming 50.
Index in Focus: SPX500
Technical Analysis
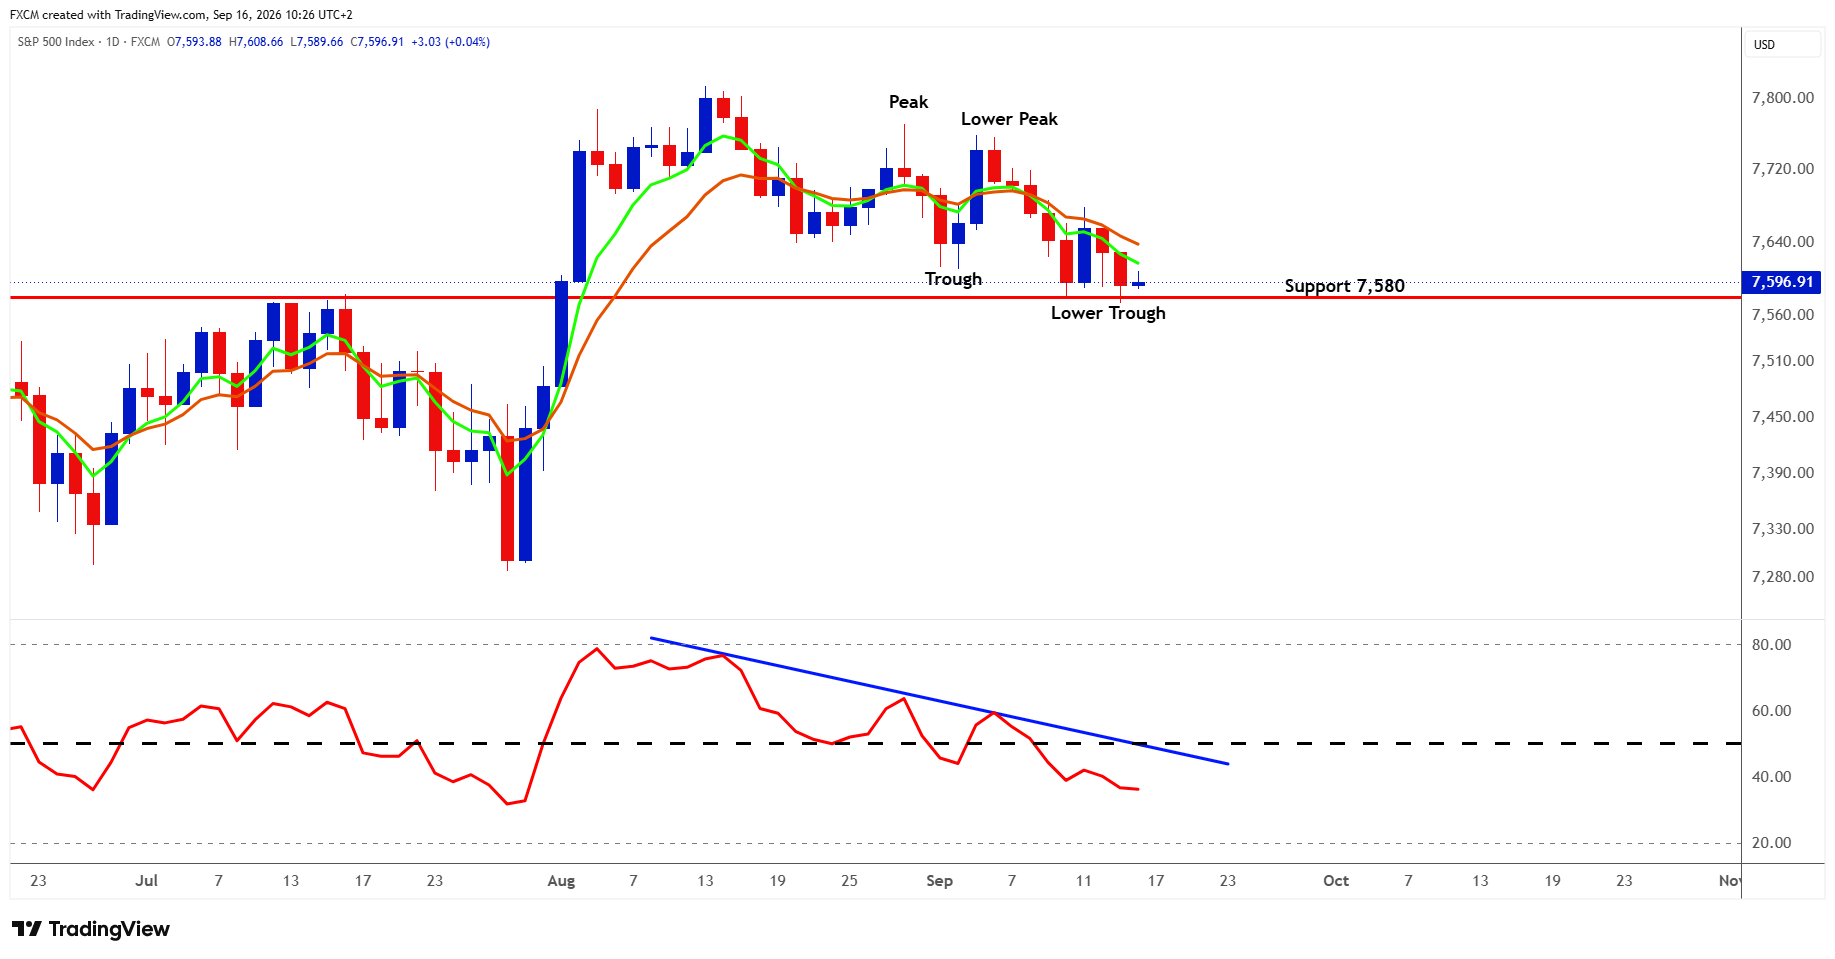
The SPX500 is at an important technical inflection point, with the recent lower peak and lower trough signalling a deterioration in the short-term trend after August's strong advance. Price is now testing the key 7,580 support zone, which also marks the area of the previous breakout, while both short-term moving averages have rolled over and are beginning to act as overhead resistance. Momentum reinforces the caution. RSI has been trending lower, remains firmly below 50 and is not yet oversold, suggesting sellers still have room to press the market. A decisive break below 7,580 would confirm the developing bearish structure and increase the risk of a deeper retracement, initially towards the 7,500–7,450 region. Conversely, if support holds, the first meaningful sign of improvement would be an RSI recovery through 50 accompanied by price reclaiming the 7,640–7,680 moving-average zone; until then, rallies are likely to remain vulnerable and the technical bias stays cautiously bearish.
Fundamental Perspective
The SPX500 is being tested by an uncomfortable combination of elevated bond yields, $100-plus oil and renewed questions around the durability of the AI trade. The US 10-year Treasury yield reached 5.041% on Tuesday, its highest since 2007, before easing back towards 5% this morning, while markets assign roughly a 93% probability of a 25bp Federal Reserve rate increase today. UKOil and USOil also remain above $100, sustaining concerns around inflation and tighter financial conditions. The SPX500 fell yesterday, with semiconductor shares among those pressured as rising yields coincided with renewed uncertainty around AI development, data-centre expansion and the durability of AI spending. Yet the earnings cushion remains substantial: 86% of the 492 S&P 500 companies that reported second-quarter results beat analyst estimates, well above the long-term average. That makes the 7,580 technical support particularly important. A hawkish Fed message, renewed bond-market selling or another oil spike could intensify downside pressure, while easing yields and evidence that earnings momentum remains intact would strengthen the case for buyers defending the level.

Russell Shor
Senior Market Strategist
Russell Shor is a Senior Market Strategist at FXCM, having been promoted to the role in 2025 in recognition of his depth of insight and consistent delivery of high-impact market analysis. He originally joined FXCM in October 2017 as a Senior Market Specialist.
Russell holds an Honours Degree in Economics from the University of South Africa, is a certified FMVA®, and a full member of the Society of Technical Analysts (UK). With over 20 years of experience in financial markets, his work is renowned for its clarity, precision, and strategic value across asset classes.

Any opinions, news, research, analyses, prices, other information, or links to third-party sites contained on this website are provided on an "as-is" basis, as general market commentary and do not constitute investment advice. The market commentary has not been prepared in accordance with legal requirements designed to promote the independence of investment research, and it is therefore not subject to any prohibition on dealing ahead of dissemination. Although this commentary is not produced by an independent source, FXCM takes all sufficient steps to eliminate or prevent any conflicts of interests arising out of the production and dissemination of this communication. The employees of FXCM commit to acting in the clients' best interests and represent their views without misleading, deceiving, or otherwise impairing the clients' ability to make informed investment decisions. For more information about the FXCM's internal organizational and administrative arrangements for the prevention of conflicts, please refer to the Firms' Managing Conflicts Policy. Please ensure that you read and understand our Full Disclaimer and Liability provision concerning the foregoing Information, which can be accessed here.