
Market Threads – Markets Converge as Oil, Yields and the Dollar Set the Tone

.png)
Tracking important market threads across currencies, commodities, and indices.
- Oil is pressing key resistance as Middle East tensions intensify, raising the question of whether UKOil and USOil are setting up for their next major breakout.
- USDOLLAR is flashing fresh downside risk as weak momentum, softer US data and fading Fed hike expectations put key support under pressure.
- Gold is coiling beneath key resistance as a weaker USDOLLAR and softer yields raise the prospect of a fresh breakout.
- JPN225 is at a make-or-break moment as surging yields, expensive oil and tech weakness test whether its breakout can survive.
Cross Asset View
Oil, the dollar, gold and Japanese equities are sending an increasingly connected message. Energy markets remain supported by geopolitical risk, while softer US data and fading Fed tightening expectations are weighing on USDOLLAR and helping XAUUSD probe higher. At the same time, elevated bond yields and renewed technology weakness are testing JPN225 after its breakout. The next move across these markets may therefore depend less on any single asset and more on whether yields, the dollar and oil begin to reinforce or offset one another.
Oil
Technical Analysis
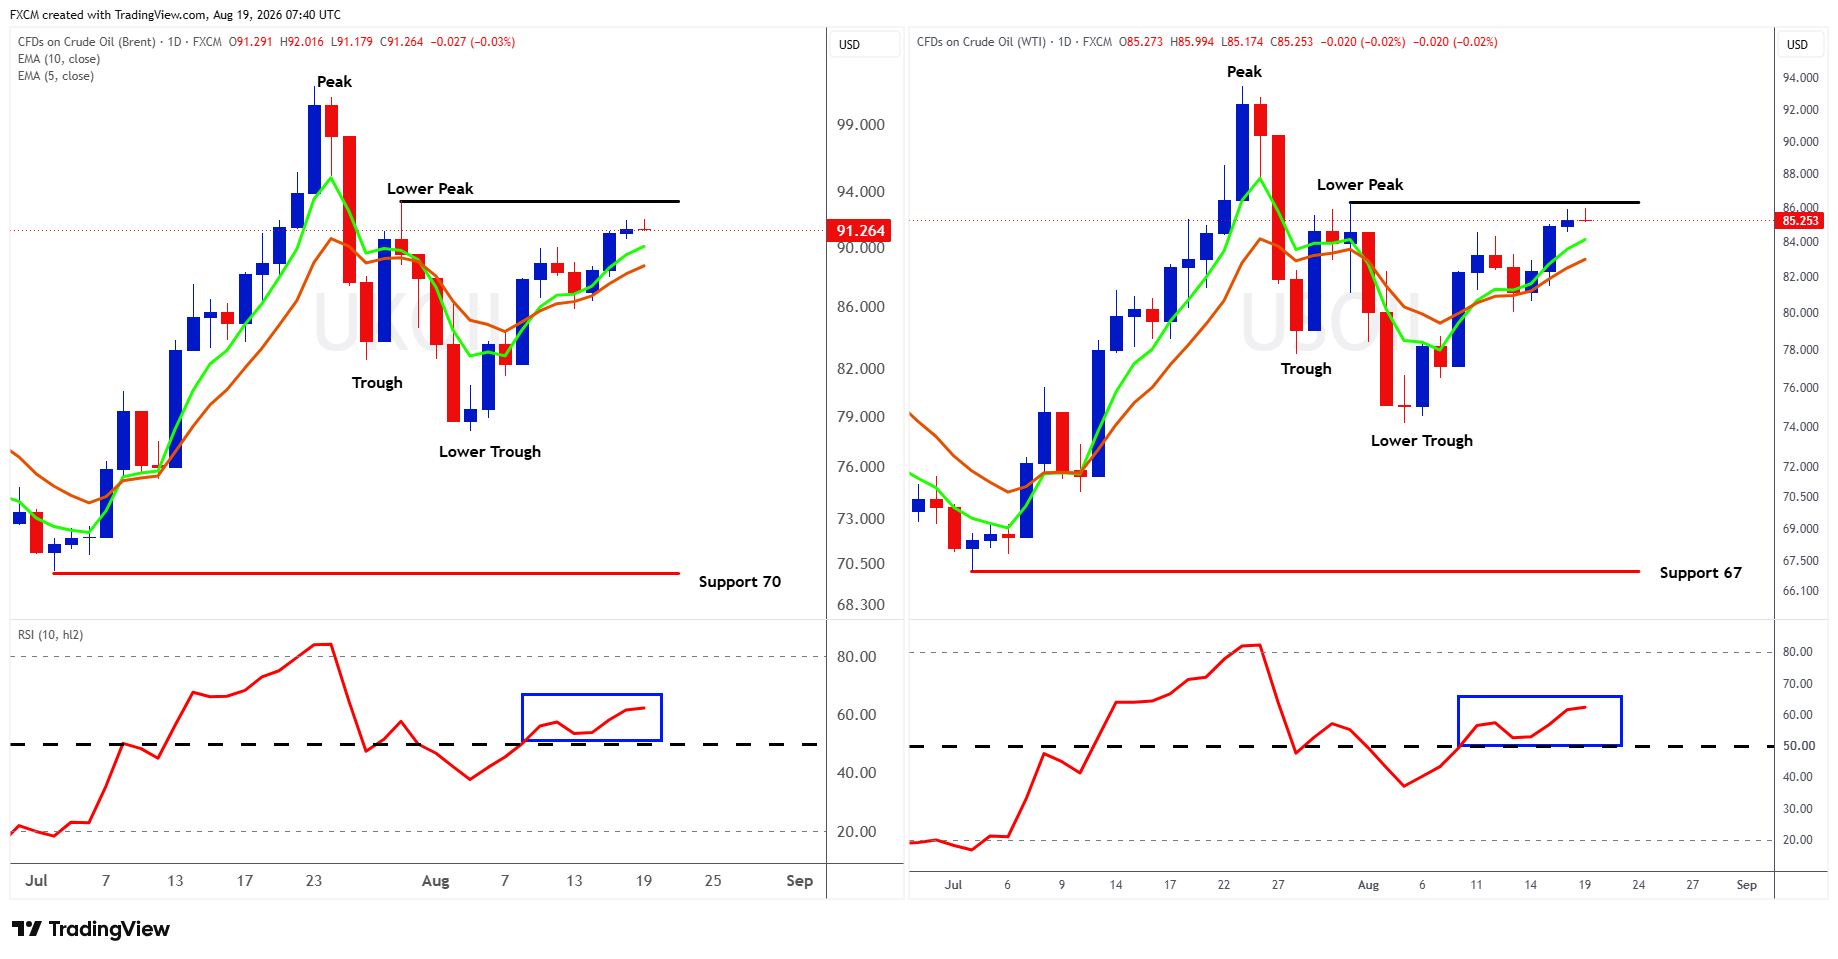
UKOil retains a cautiously bullish short-term technical bias, with the recovery from the early-August lower trough extending towards the important lower-peak resistance around $93-94. Price is trading above both the 5-day and 10-day EMAs, while the faster average has moved above the slower average and both are moving higher, supporting improving momentum. The RSI has also risen comfortably above the neutral 50 level to around 60, confirming strengthening buying pressure without yet reaching overbought territory. However, the broader corrective structure remains intact while UKOil stays beneath the lower peak; a convincing daily break above $93-94 would materially strengthen the bullish picture and expose the July peak near $100, whereas rejection from resistance could see price retreat towards the rising moving averages around $89-90. Major longer-term support remains near $70.
USOil is showing a similar improving technical structure, having rallied strongly from its early-August lower trough towards lower-peak resistance around $86-87. Price is above the rising 5-day and 10-day EMAs, with the shorter average leading higher, indicating that near-term momentum has shifted in favour of buyers. RSI has climbed into the low 60s after holding above the 50 midpoint, providing further evidence of positive momentum while remaining below overbought territory. The key test is now the $86-87 resistance area: a sustained break above it would complete an important technical improvement by overcoming the previous lower peak and could open a move towards the July peak around $92-93. Failure to break resistance would leave USOil vulnerable to consolidation or a pullback towards the moving-average region around $82-83, while major structural support remains near $67.
Fundamental Perspective
The fundamental backdrop broadly supports the improving technical picture in UKOil and USOil, while also explaining why both are struggling to break decisively higher. Oil is rising for a fourth consecutive session, with UKOil above $91 and USOil above $85, as the diplomatic route towards de-escalation narrows. The June US-Iran understanding has run its course with no replacement agreed. Trump says further negotiations are not currently planned, and shipping volumes through Hormuz remain a long way from the levels seen before the conflict. That combination makes the supply-risk premium harder for the market to dismiss, particularly while one of the world's most important energy corridors remains operating at only a fraction of its normal capacity.
Shipping through Hormuz remains severely constrained, Washington and Tehran continue to dispute whether the waterway is genuinely open, and the latest temporary ceasefire expired on Monday, while Houthi activity around the Bab el-Mandeb adds another threat to regional energy flows. The demand side is much less supportive: OPEC has cut its 2026 demand-growth forecast for a fourth consecutive month to just 580,000 barrels a day, while the IEA is considerably more bearish and now expects global oil demand to contract by 1.6 million barrels a day this year.
Oil is therefore caught between demand destruction on one side and an exceptionally fragile supply system on the other, a fundamental tug-of-war that fits the charts well: momentum is improving, but a convincing break above the lower peaks in UKOil and USOil would probably require fresh evidence that physical supply is tightening further.
USDOLLAR
Technical Analysis
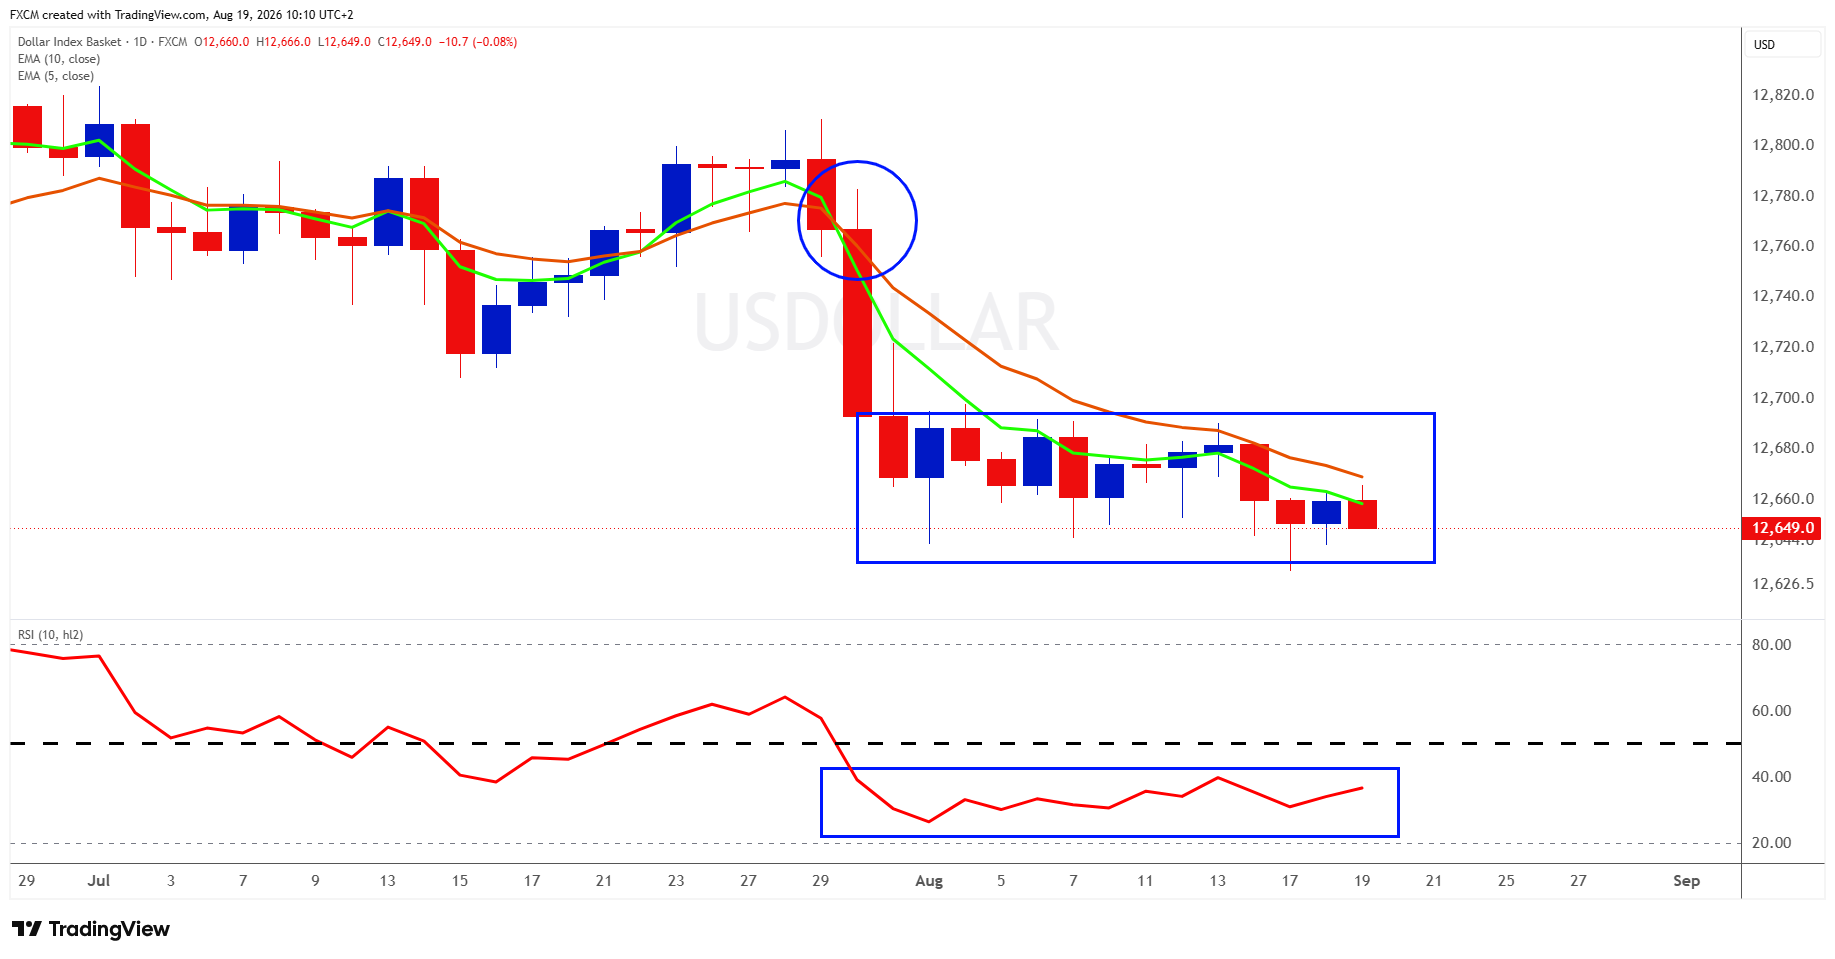
USDOLLAR retains a bearish technical bias following the sharp late-July breakdown, which was reinforced when the 5-day EMA crossed below the 10-day EMA. Price has since moved into a sideways consolidation roughly between 12,635 and 12,695, but this has so far done little to repair the underlying weakness: the 5-day EMA remains below the declining 10-day EMA and USDOLLAR is trading near the lower end of the range. Momentum also remains subdued, with the RSI holding comfortably below the neutral 50, indicating that sellers continue to have the upper hand without conditions yet becoming deeply oversold. If this structure persists and the lower boundary around 12,635 gives way convincingly, USDOLLAR could have scope to weaken further. Conversely, a sustained recovery above the top of the consolidation near 12,695, accompanied by an improvement in RSI towards or above 50, would be needed to begin challenging the bearish short-term outlook.
Fundamental Perspective
The fundamental backdrop broadly supports the bearish technical structure in USDOLLAR, despite some forces that would normally favour the greenback. Softer US data have been the dominant influence: nonfarm payrolls fell by 23,000 in July, retail sales declined 0.6%, and relatively mild inflation readings have helped push the probability of a September Federal Reserve rate increase down to around 30% from above 50% a week earlier. That repricing has reduced the interest-rate support available to the dollar, with the 10-year Treasury yield easing to around 4.69% even as longer-dated yields remain exceptionally elevated.
Importantly, pressure at the long end increasingly reflects concerns over fiscal deficits, heavy debt issuance and inflation risk, even as expectations of near-term Fed tightening have been scaled back, making high bond yields less straightforwardly bullish for USDOLLAR. Oil adds another layer to the picture. UKOil above $91 and continued uncertainty around the Strait of Hormuz are keeping inflation risks alive and could renew upward pressure on yields, but an extended energy shock would also squeeze household purchasing power and weaken growth, leaving the Fed facing an increasingly difficult inflation-growth trade-off.
For now, softer US economic momentum and fading expectations of further monetary tightening appear to be outweighing the potential support from elevated oil prices and long-term yields, which fits USDOLLAR's sideways consolidation following its breakdown. If the US yield advantage continues to narrow and incoming data remain weak, the fundamental backdrop could increasingly favour another leg lower, although a renewed inflation shock or major Middle East escalation could challenge that view by reviving rate-hike expectations or safe-haven demand for the dollar.
Gold
Technical Analysis
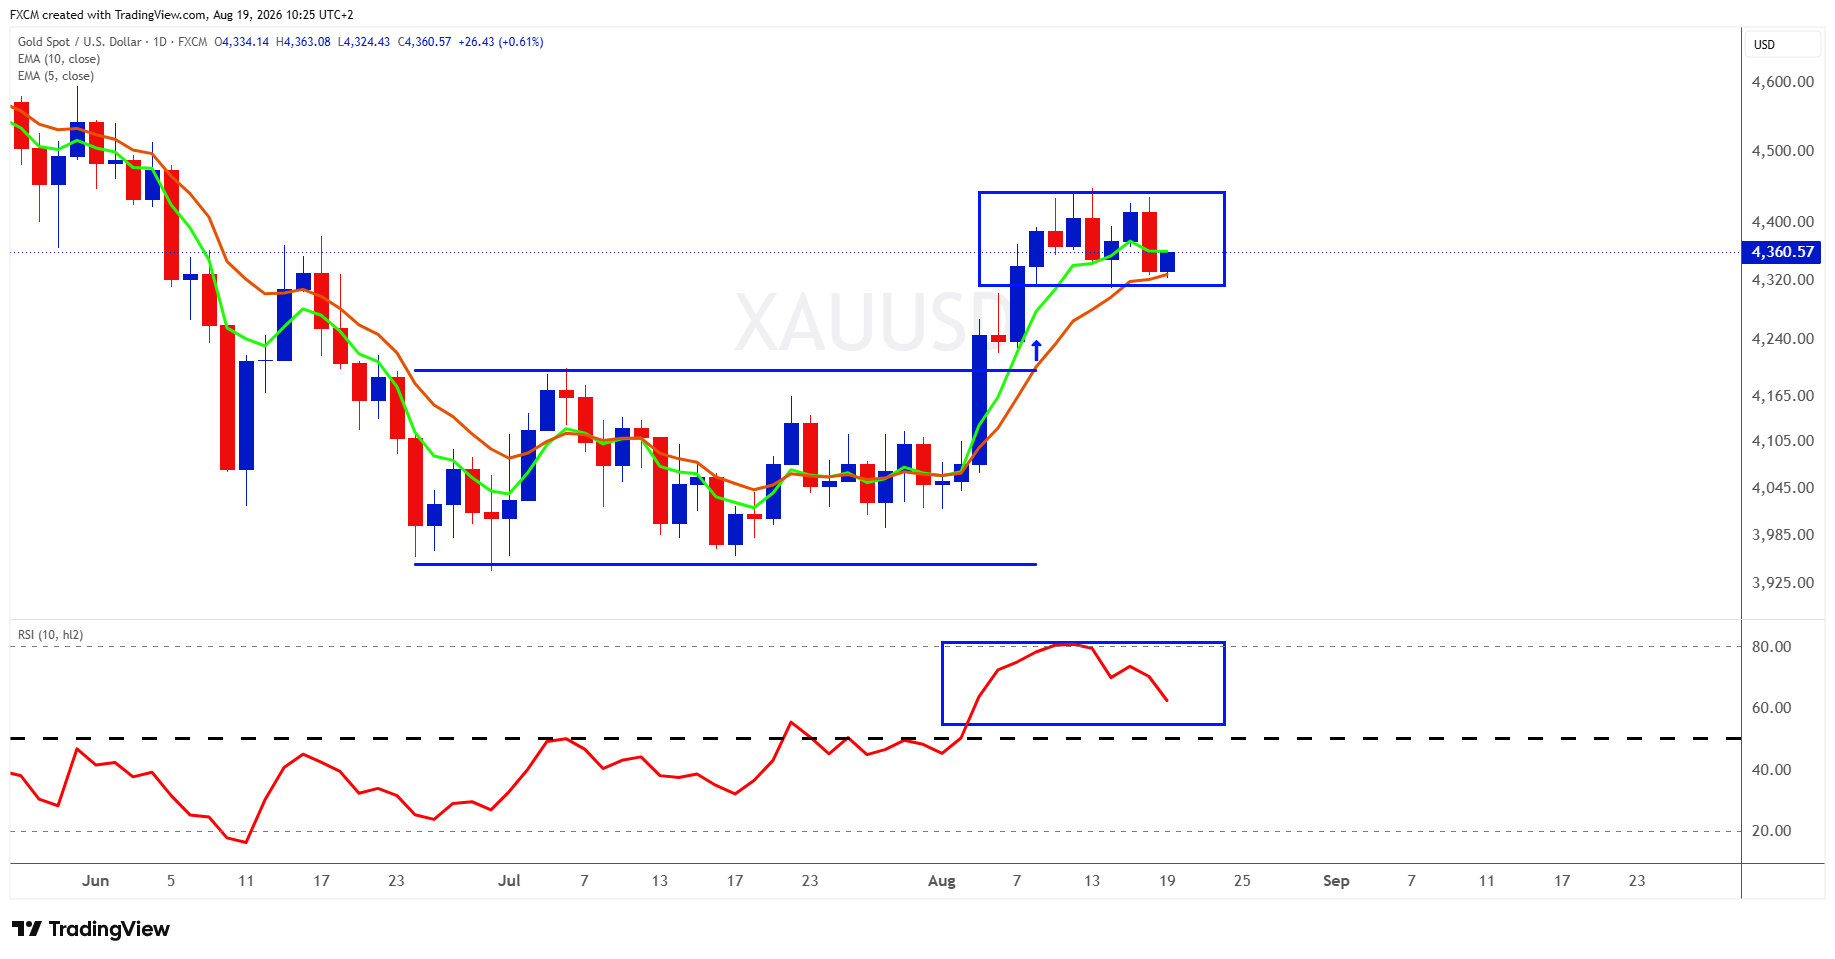
XAUUSD appears to have transitioned into a markup phase following the early-August breakout above the former resistance around $4,190-$4,200, with price subsequently advancing sharply before consolidating at higher levels. The current range, roughly $4,320-$4,440, looks more like a pause or potential re-accumulation within that advance than a reversal at this stage: price remains above the rising 10-day EMA, the 5-day EMA remains above the 10-day EMA, and the former breakout area is well below current levels. Momentum has cooled, however, with RSI retreating from overbought territory near 80 into the low 60s. That cooling is constructive provided RSI holds above 50, as it would suggest that positive momentum is being reset rather than lost.
With XAUUSD currently showing a strong inverse correlation of around -72% with USDOLLAR, the dollar could provide the catalyst for the next directional move. A downside break in USDOLLAR would strengthen the case for gold to escape its consolidation, but the chart itself still needs confirmation through a convincing daily close above approximately $4,440, which would signal a resumption of the markup phase and open the way to fresh highs. Conversely, a break below roughly $4,320, particularly alongside RSI falling through 50 and deterioration in the EMA structure, would warn that the consolidation is becoming a deeper correction. For now, the technical balance therefore remains bullish, but awaiting confirmation, with the combination of the $4,440 range ceiling, RSI holding above 50 and the next move in USDOLLAR providing the clearest signals to watch.
Fundamental Perspective
The fundamental backdrop is turning more constructive for XAUUSD, particularly if the weakness developing in USDOLLAR persists. The greenback is hovering near multi-month lows as softer US economic data and easing Treasury yields have reduced expectations of another near-term Federal Reserve increase, with markets assigning roughly a one-third probability to a September hike and the US 10-year yield easing to around 4.69%. This matters for gold on two fronts: dollar weakness improves its affordability for non-US buyers, while lower yields reduce the opportunity cost of holding a non-interest-bearing asset.
With the current measured correlation between XAUUSD and USDOLLAR at approximately -72%, a decisive downside break in USDOLLAR would therefore provide an important tailwind for the yellow metal, although correlation is not a guarantee of an inverse move.
The Middle East adds another dimension. UKOil above $91 and continued disruption around the Strait of Hormuz are sustaining geopolitical uncertainty, which can reinforce gold's safe-haven appeal, but the accompanying inflation risk cuts both ways because another oil-driven surge in Treasury yields could again weigh on bullion. Beyond the immediate macro picture, the World Gold Council expects investment to remain the main source of demand growth during the second half of 2026 and central banks to remain significant buyers.
If USDOLLAR breaks lower, Treasury yields remain contained and XAUUSD's RSI holds above 50, the case for an upside breakout from the current consolidation would strengthen, while a renewed bond sell-off or hawkish Fed surprise remains the clearest threat to that scenario.
Keep an Eye on Copper
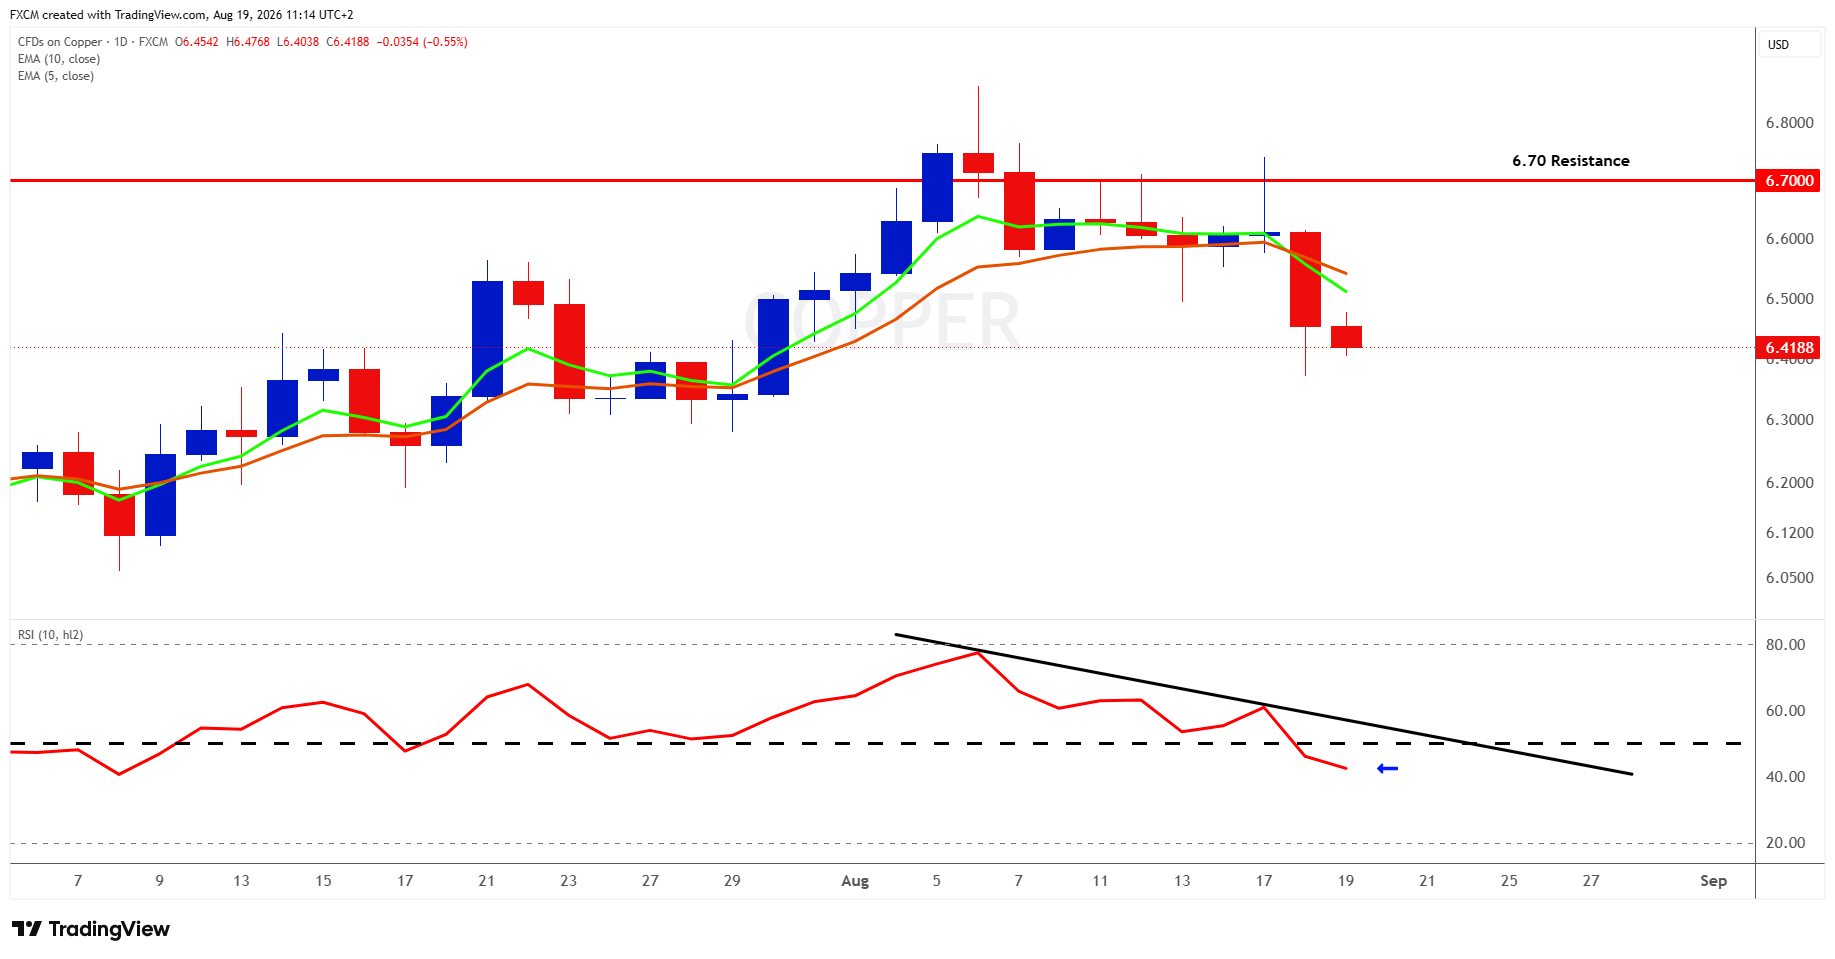
Copper is beginning to flash a yellow light for the global economy, although Dr Copper's message requires some careful interpretation. Technically, the failure to sustain a break above the $6.70 resistance area has been followed by a sharp pullback, with price now below both short-term moving averages, the 5-day EMA crossing beneath the 10-day EMA and RSI slipping below 50 into the low 40s.
The macro backdrop gives that weakness some credibility: China's industrial production slowed to 4.5% year on year in July, retail sales grew just 0.6%, and fixed-asset investment fell 6.7% over the first seven months, pointing to weaker domestic demand and investment momentum in the world's largest copper-consuming economy.
Copper is also retreating despite a relatively weak USDOLLAR, while UKOil above $91 and elevated global bond yields provide additional headwinds for industrial activity.
For now, the failed breakout and weakening momentum are worth treating as a warning rather than a verdict: if copper cannot regain its moving averages and RSI fails to recover above 50, Dr Copper may be signalling that underlying economic momentum is becoming less supportive.
Index in Focus: JPN225
Technical Analysis
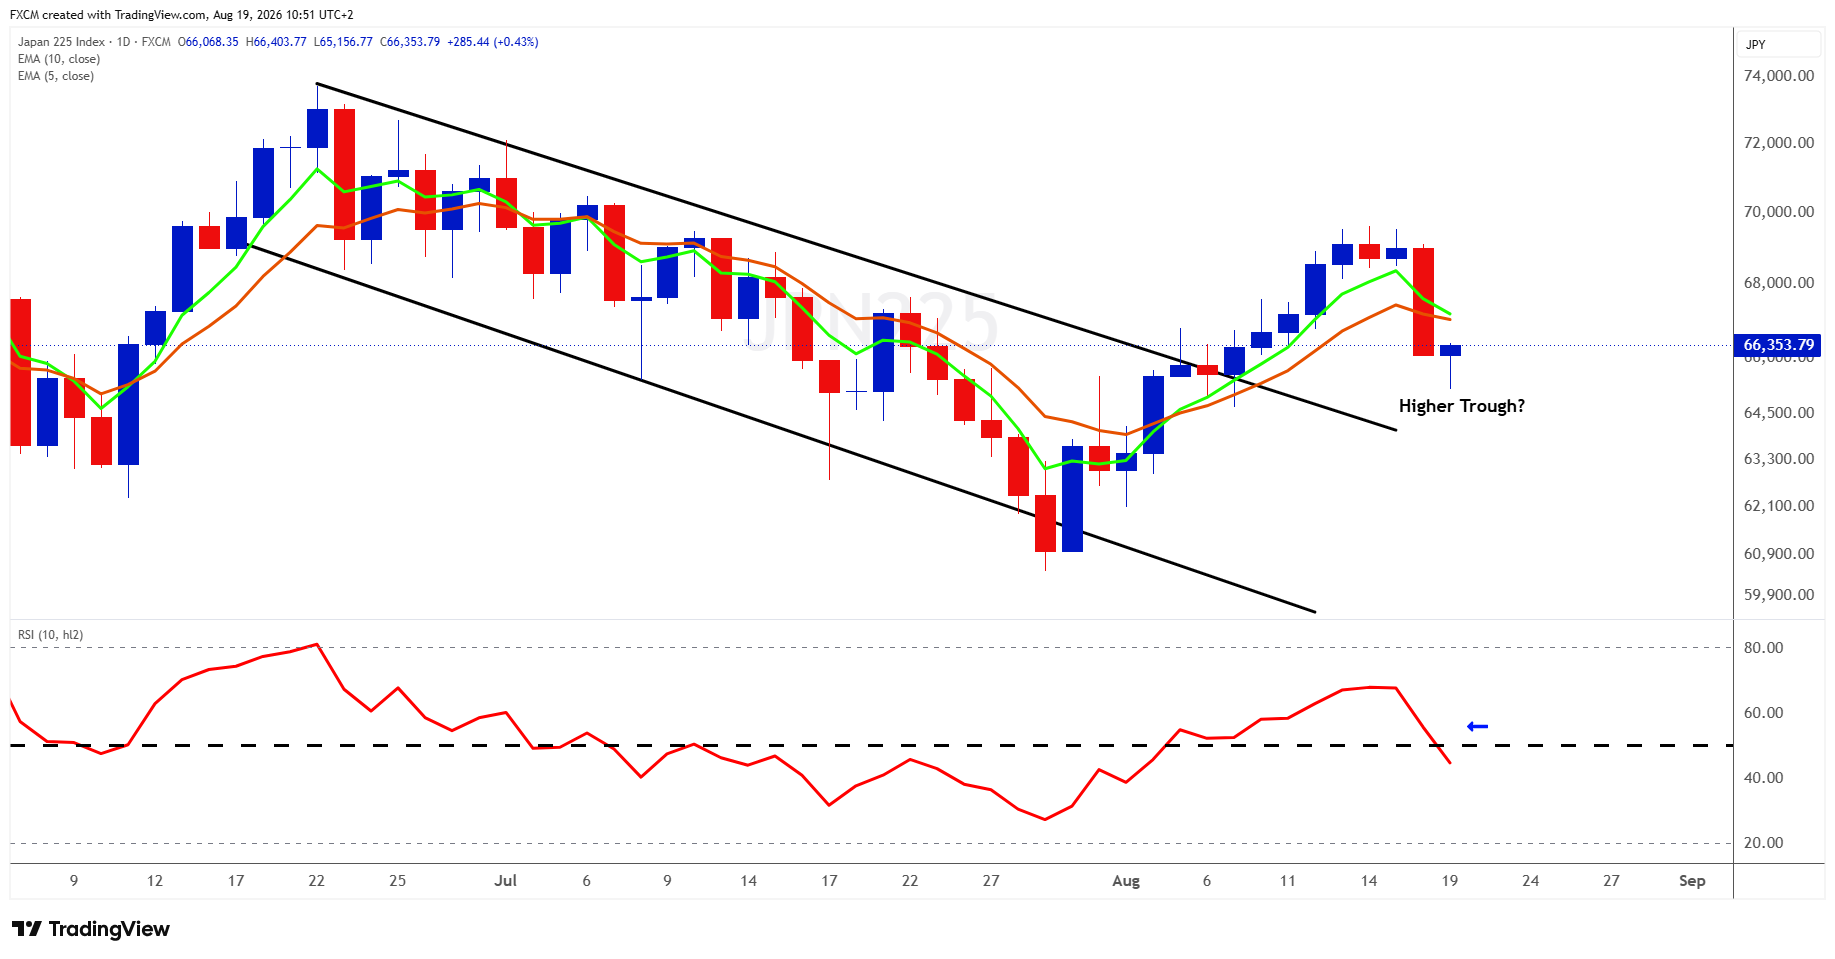
JPN225 is undergoing an important post-breakout pullback after escaping the descending channel and rallying towards the 69,000 area. The key question is now whether the retreat can establish a higher trough, ideally above the former channel resistance and breakout zone around 64,500-65,000; if it does, that would preserve the emerging sequence of higher lows and provide a platform for another advance. Near-term momentum has weakened, however, with price slipping below both the 5-day and 10-day EMAs and the faster average beginning to roll over, so buyers have not yet regained control. The RSI has also fallen sharply to around 44, making the 50 level particularly important: a recovery back above 50 and subsequent hold would suggest momentum is once again supporting the index rather than simply producing a corrective bounce. A reclaim of the moving averages around 67,000-67,500 would be the first encouraging signal, while a move through the recent high around 69,000-69,500 would provide stronger confirmation that the next leg higher is under way. Conversely, a sustained break back below roughly 64,500 would weaken the breakout thesis and raise the risk that JPN225 is slipping back into its previous bearish structure.
Fundamental Perspective
The fundamental backdrop for JPN225 has become more challenging after its recent rally, with the pullback being driven by a potent combination of higher oil prices, rising Japanese bond yields and renewed weakness in global technology shares. UKOil above $91 is keeping inflation concerns alive at the same time that expectations of further Bank of Japan tightening are building, helping push the 10-year JGB yield as high as 2.95%, its highest level since 1996.
Higher yields are particularly uncomfortable for highly valued growth shares, while Tuesday's 5% slump in US semiconductor stocks has spilled into Asia and added significantly to the pressure on the Nikkei. Japan's economy has also lost some momentum, with second-quarter growth falling short of expectations as household consumption and business investment weakened, although investors have largely looked through the disappointing figures and BOJ rate-hike expectations remain intact.
The next move therefore hinges heavily on whether these pressures begin to ease: cooler oil prices, stabilising JGB yields and a recovery in semiconductor shares would give JPN225 a better chance of turning the current correction into the higher trough suggested by the chart, while another surge in yields towards or beyond 3% combined with continued technology selling would make that bullish technical scenario increasingly difficult to sustain.

Russell Shor
Senior Market Strategist
Russell Shor is a Senior Market Strategist at FXCM, having been promoted to the role in 2025 in recognition of his depth of insight and consistent delivery of high-impact market analysis. He originally joined FXCM in October 2017 as a Senior Market Specialist.
Russell holds an Honours Degree in Economics from the University of South Africa, is a certified FMVA®, and a full member of the Society of Technical Analysts (UK). With over 20 years of experience in financial markets, his work is renowned for its clarity, precision, and strategic value across asset classes.

Any opinions, news, research, analyses, prices, other information, or links to third-party sites contained on this website are provided on an "as-is" basis, as general market commentary and do not constitute investment advice. The market commentary has not been prepared in accordance with legal requirements designed to promote the independence of investment research, and it is therefore not subject to any prohibition on dealing ahead of dissemination. Although this commentary is not produced by an independent source, FXCM takes all sufficient steps to eliminate or prevent any conflicts of interests arising out of the production and dissemination of this communication. The employees of FXCM commit to acting in the clients' best interests and represent their views without misleading, deceiving, or otherwise impairing the clients' ability to make informed investment decisions. For more information about the FXCM's internal organizational and administrative arrangements for the prevention of conflicts, please refer to the Firms' Managing Conflicts Policy. Please ensure that you read and understand our Full Disclaimer and Liability provision concerning the foregoing Information, which can be accessed here.