
Market Threads – The Fed Steps into a Cross-Asset Fault Line

.png)
Tracking important market threads across currencies, commodities, and indices.
- UKOil and USOil are at a critical turning point, with renewed Middle East tensions, key technical levels and shifting supply dynamics setting up the next major move.
- USDOLLAR's bullish breakout is gaining traction, with today's high-stakes Fed decision poised to trigger the next decisive move.
- XAUUSD is coiling at a crucial turning point, with weak momentum and today's Fed decision poised to unleash gold's next major move.
- SPX500 is approaching a make-or-break moment as Fed risk, tech earnings and a powerful sector rotation collide.
Cross Asset View
A high-stakes Fed decision arrives as renewed Middle East tensions lift oil, USDOLLAR holds above its bullish breakout, gold waits for direction and rotation into non-technology sectors offsets deepening semiconductor weakness. Together, these cross-currents leave markets finely balanced ahead of a potentially decisive policy and earnings test.
Oil
Technical Analysis
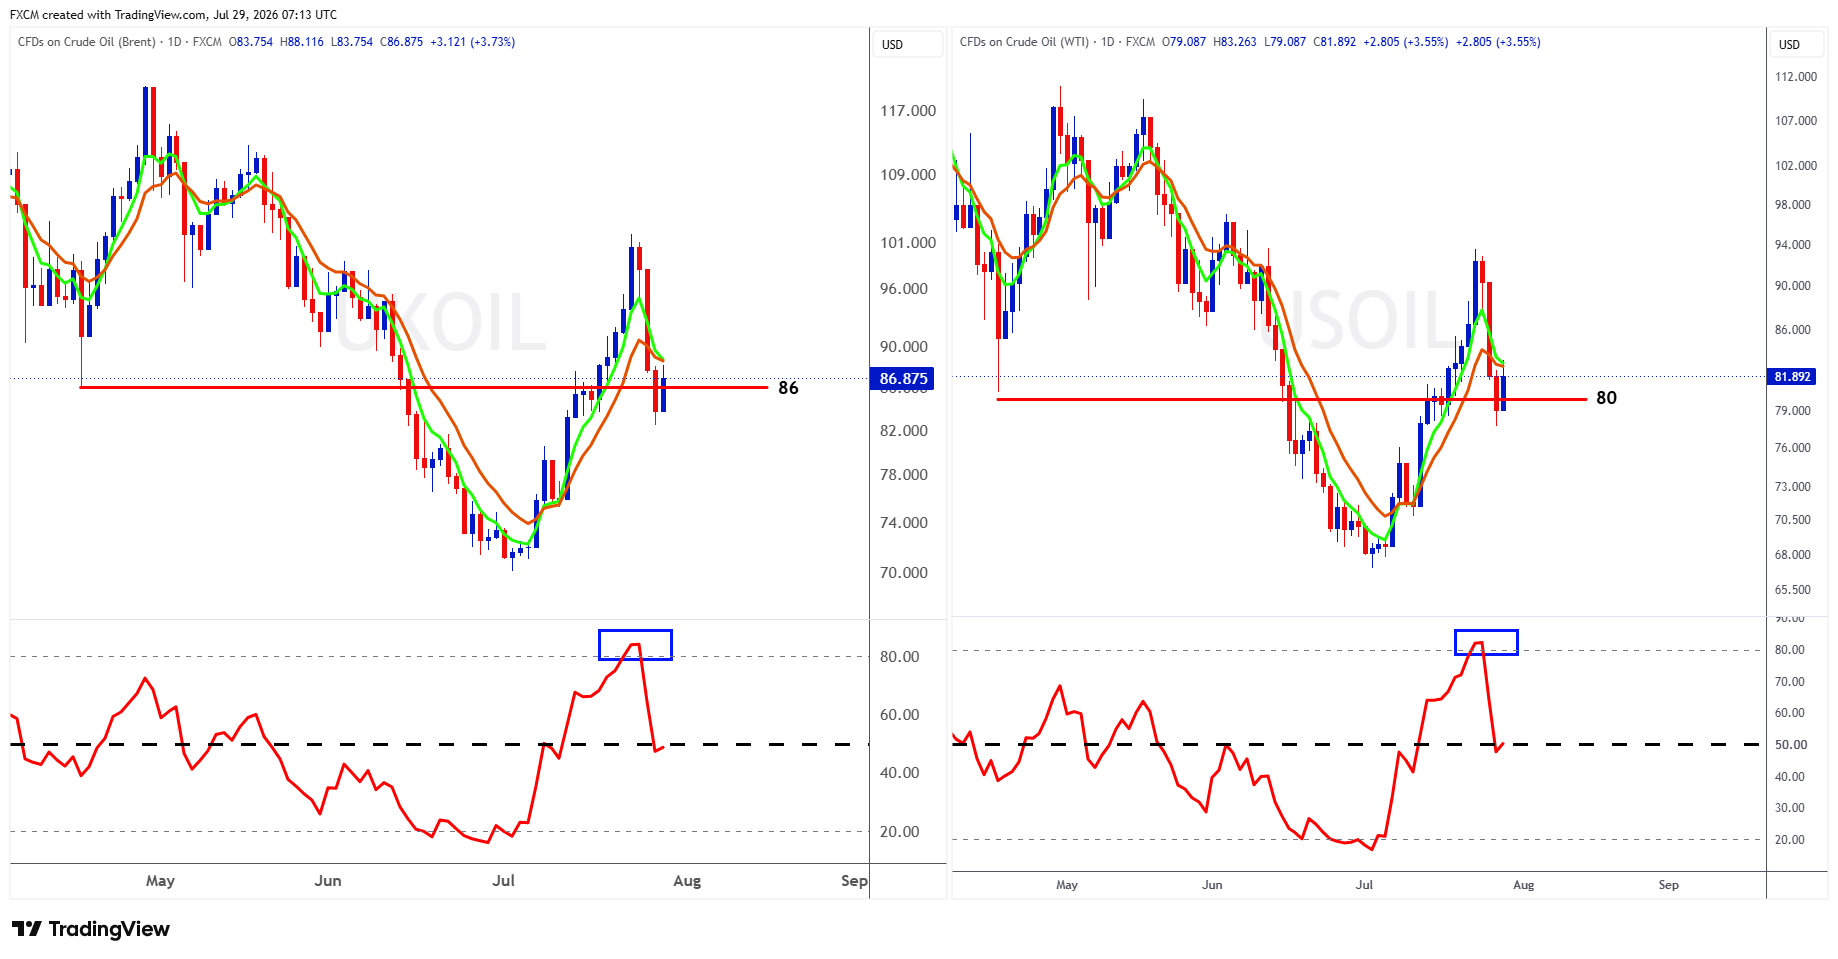
UKOil is attempting a bullish reclaim of the important $86 pivot, rather than simply rebounding from it. The current candle opened and traded as low as $83.75, briefly breaking beneath $86, before recovering above $86. That rejection of lower prices is constructive, but UKOil remains below its falling short-term moving averages around $89-$91, following the sharp reversal from roughly $98-$100. RSI has fallen from above 80 to around 50, showing that the overbought condition has been removed and momentum has returned to neutral. A daily finish above $86, followed by a recovery through $89-$91, would improve the bullish case; renewed weakness below $86 would put approximately $82 back in focus.
USOil is similarly trying to reclaim the major $80 support-and-resistance area after trading down to $79.09 and rebounding above $81. The intraday recovery is encouraging, but the rejection from approximately $94 damaged the previous upswing, and price remains below the short-term moving-average cluster around $83-$85. RSI has dropped sharply from overbought territory to roughly 50, indicating neutral momentum rather than a renewed bullish impulse. Remaining above $80 would preserve the possibility of a recovery towards $83-$85, while a confirmed daily break back below $80 would strengthen the failed-breakout interpretation and expose the broader $76-$78 area.
Fundamental Perspective
The pullback in UKOil and USOil from 24 July was mainly a reduction in the geopolitical risk premium, not a clear demand shock. Prices fell as hopes of renewed US-Iran talks grew and several days passed without fresh strikes; by yesterday, UKOil had dropped about 16% over three sessions to $84.09, while USOil settled at $79.26, despite restricted Hormuz traffic and continued Red Sea disruption. Today's escalation has reversed part of that decline, with UKOil near $87 and USOil briefly above $82 after Iranian missiles targeted US forces and US-Saudi strikes hit Iran-backed groups in Iraq. Support also came from a reported 3.3-million-barrel fall in US crude inventories. OPEC+ supply increases remain a bearish counterweight, leaving oil caught between persistent supply risks and a geopolitical premium that can fade quickly when diplomacy improves.
USDOLLAR
Technical Analysis
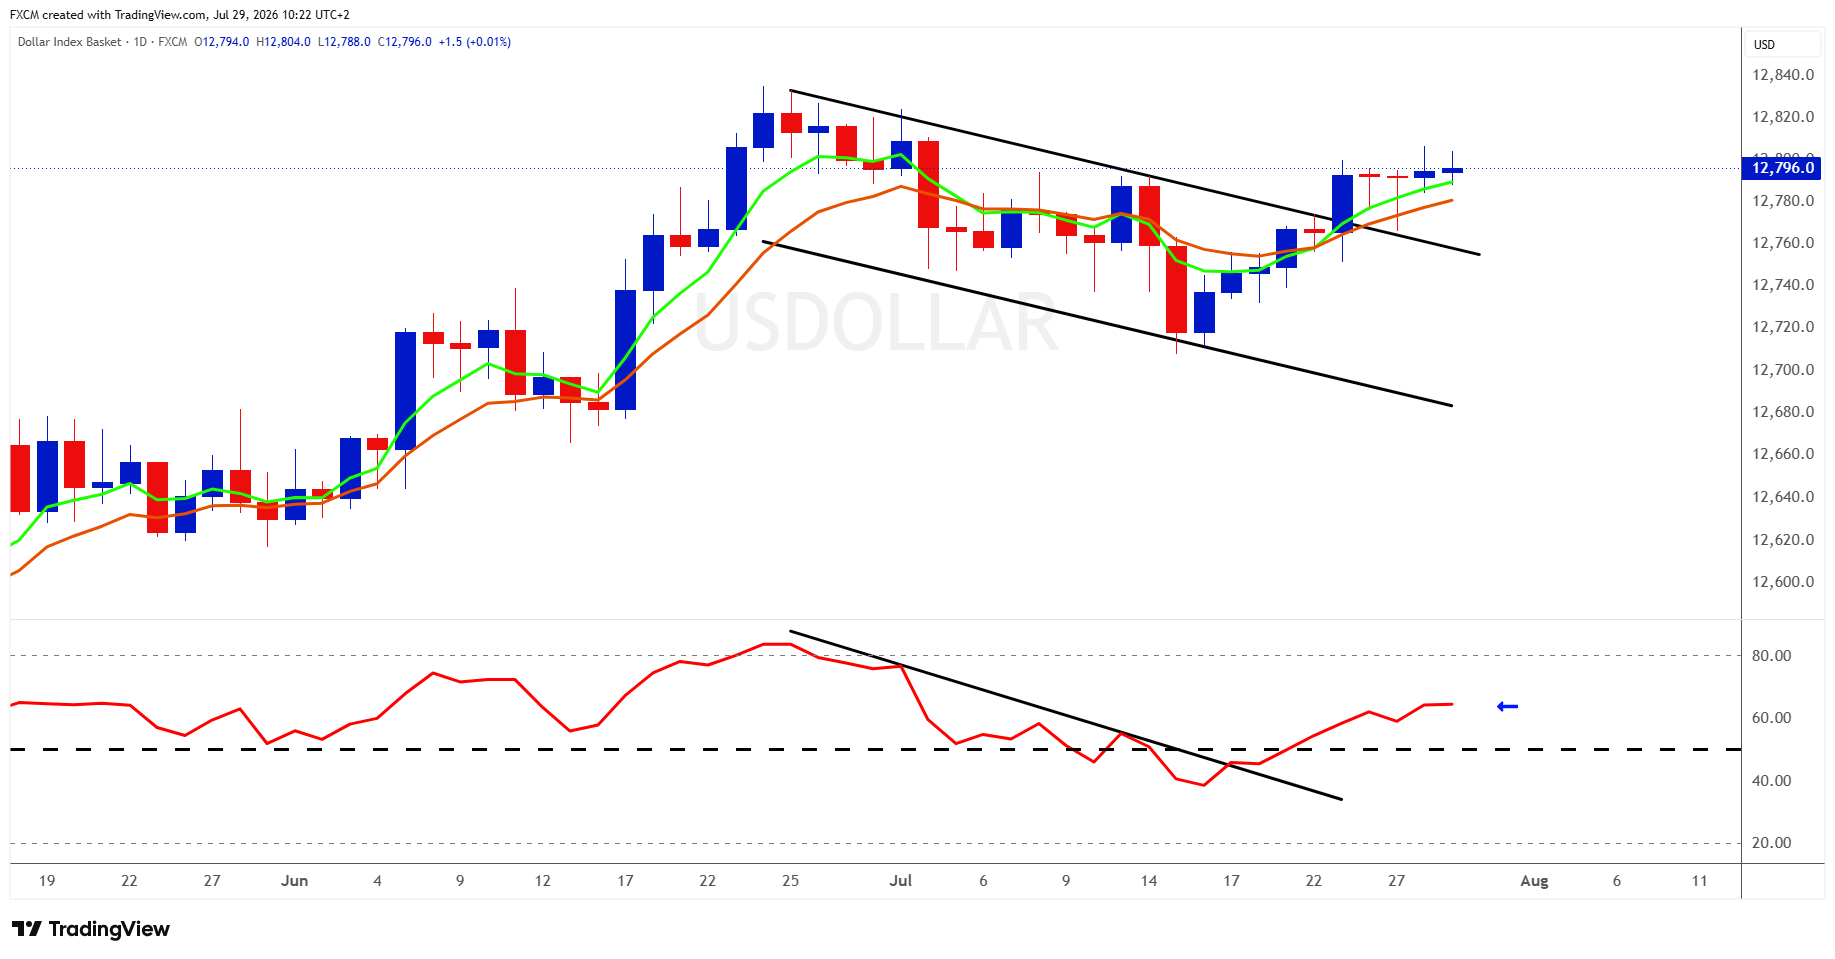
USDOLLAR has broken above a credible bullish flag, suggesting that the strong June advance may be resuming after a downward-sloping consolidation. The breakout has held for several sessions, while price remains above both rising short-term moving averages and the faster average has crossed above the slower one, reinforcing the improving trend structure. RSI has also broken its descending trendline and is holding near 64, comfortably above 50 and signalling constructive momentum without being overbought. A confirmed daily close above 12,800-12,805 would add follow-through and bring the June high around 12,830-12,835 into focus. Initial support lies around 12,785-12,790, followed by the slower moving average near 12,775-12,780. A daily close back beneath the former flag boundary around 12,755-12,765 would materially weaken the breakout and increase the risk that it has failed.
Fundamental Perspective
The flag breakout has a credible fundamental foundation, supported by precautionary positioning and hawkish Fed expectations ahead of today's unusually uncertain decision. Markets are pricing roughly a 30% chance of a 25-basis-point hike, helping the broader dollar hold near a one-month high despite weaker July consumer confidence. Renewed Middle East tensions and firmer oil may add support through inflation expectations, although safe-haven demand appears secondary. A surprise hike or distinctly hawkish vote and press conference could extend the breakout, while a hold with only the expected dissenters may trigger an unwinding of pre-meeting dollar positions. The bullish case is therefore understandable, but today's Fed communication still needs to validate the tighter policy expectations behind it.
Some Forex Charts To Keep An Eye On
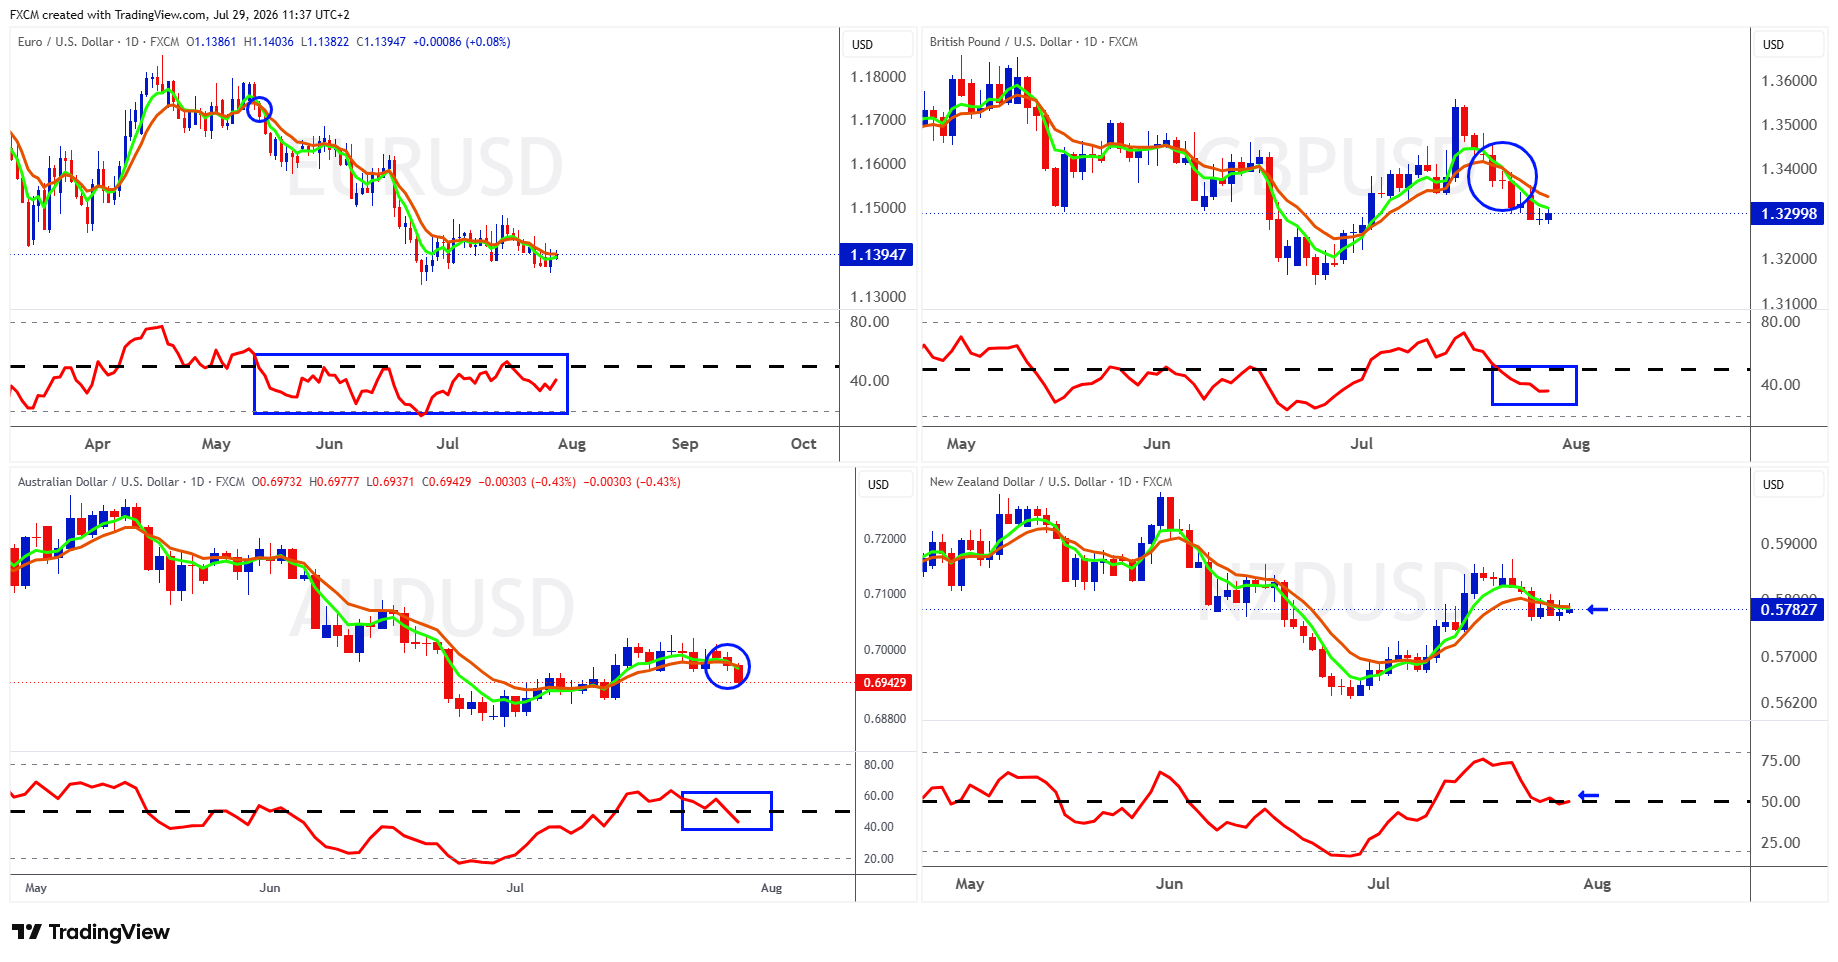
The USDOLLAR remains the key driver across these pairs ahead of today's Fed decision. EURUSD is hovering near 1.14 after a series of lower highs, with price below its short-term moving averages and RSI around 40. A recovery through 1.1410-1.1450 would be needed to improve the outlook. GBPUSD looks weaker following its rejection from 1.3500, as a bearish moving-average crossover and RSI in the low 30s keep 1.3250 and 1.3200 in view. AUDUSD has slipped back from 0.70 after softer-than-expected Australian inflation reduced the implied chance of an August RBA hike to around 3%. NZDUSD is more balanced near 0.5780, although converging moving averages and RSI just below 50 leave it vulnerable to a break under 0.5760. With the broader dollar near a one-month high and markets pricing roughly a 30% chance of a Fed hike, an increase or unexpectedly hawkish hold could extend dollar strength, while a less-hawkish outcome may unwind some of the precautionary positioning built ahead of the meeting.
Gold
Technical Analysis
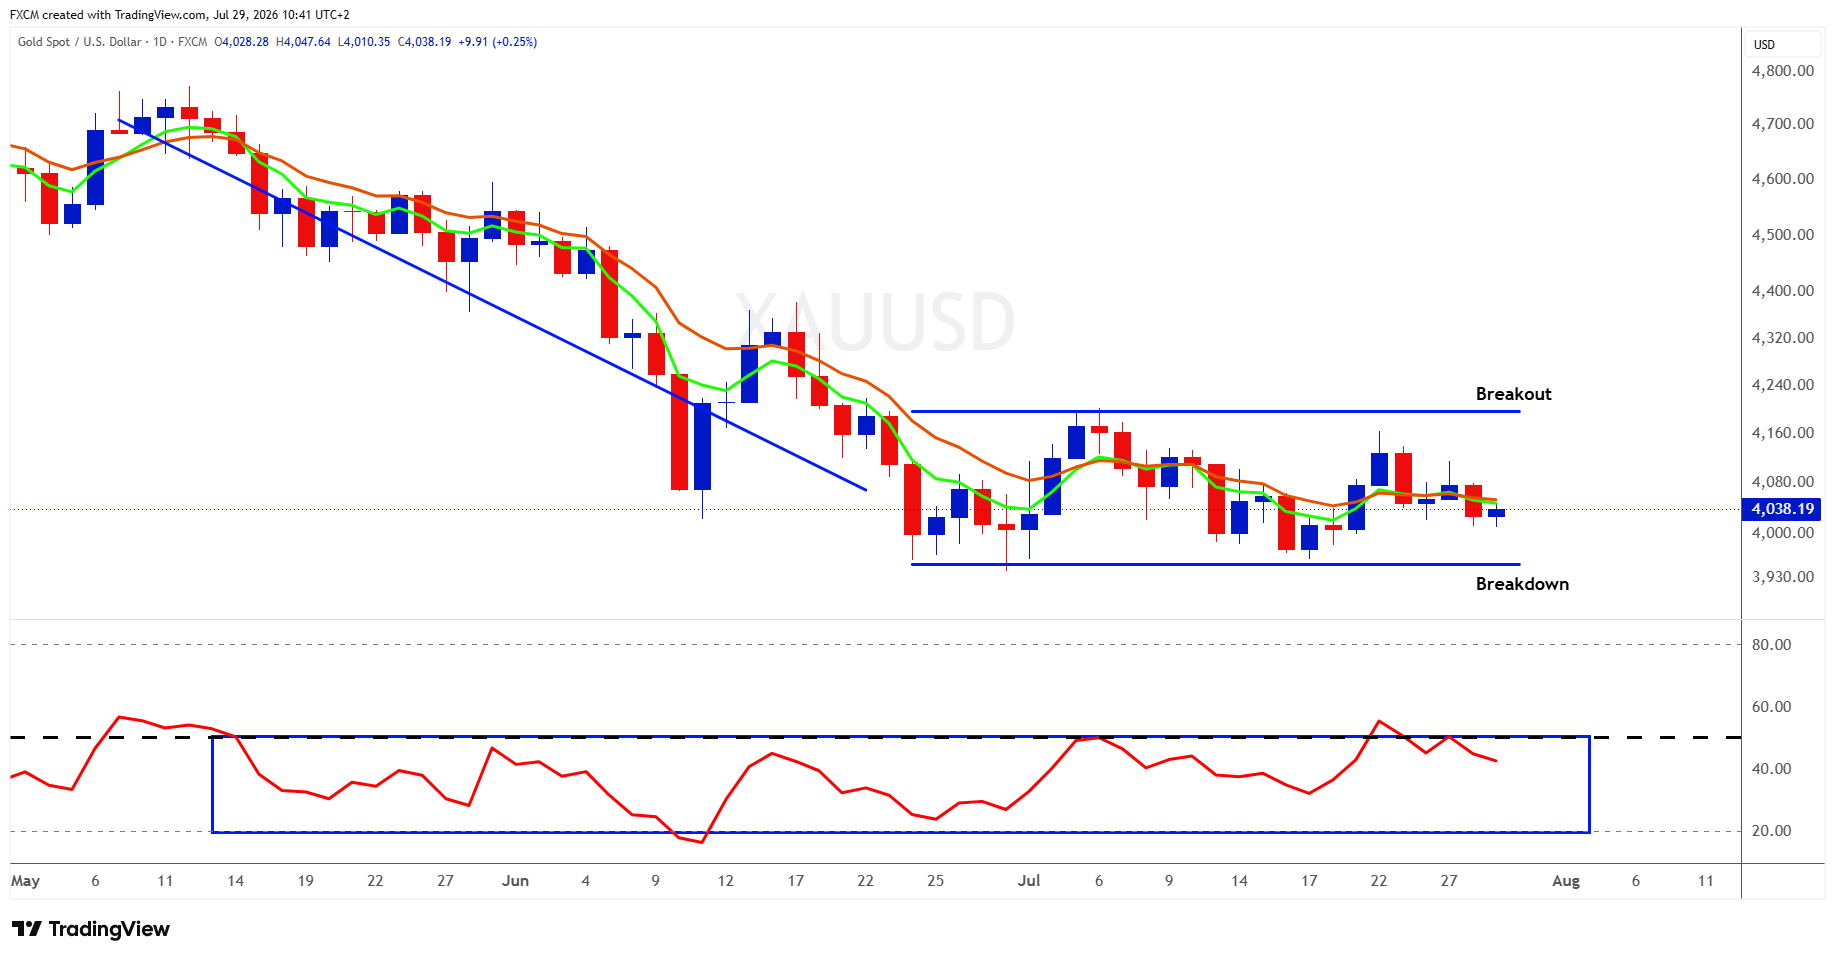
After a vicious sell-off, XAUUSD is stabilising within a broad consolidation range between approximately $3,950 and $4,200. Price remains in the lower half of the range and below its short-term moving averages, leaving the technical bias slightly bearish. RSI is holding below 50, confirming weak momentum, although a recovery above 50 would improve the prospects of an eventual breakout above $4,200. While RSI remains below 50, a downside break is the more likely scenario, but confirmation would still require a decisive daily close beneath $3,950.
Fundamental Perspective
XAUUSD is consolidating as opposing forces pull the market in different directions. A firm dollar and rising US rate expectations pushed gold to a one-week low on 28 July, before a softer dollar helped prices recover towards $4,040 today. With markets pricing roughly a 30% chance of a 25-basis-point Fed hike, the immediate outlook hinges on the decision and Chair Kevin Warsh's message. A hawkish outcome could strengthen the dollar and yields, increasing the risk of a downside break, while a less-hawkish tone may support a move towards the top of the range. Middle East tensions offer some safe-haven support, but higher oil prices are also feeding inflation and rate concerns, helping explain gold's muted reaction to renewed fighting. Central-bank demand may provide a longer-term cushion.
Index in Focus: SPX500
Technical Analysis
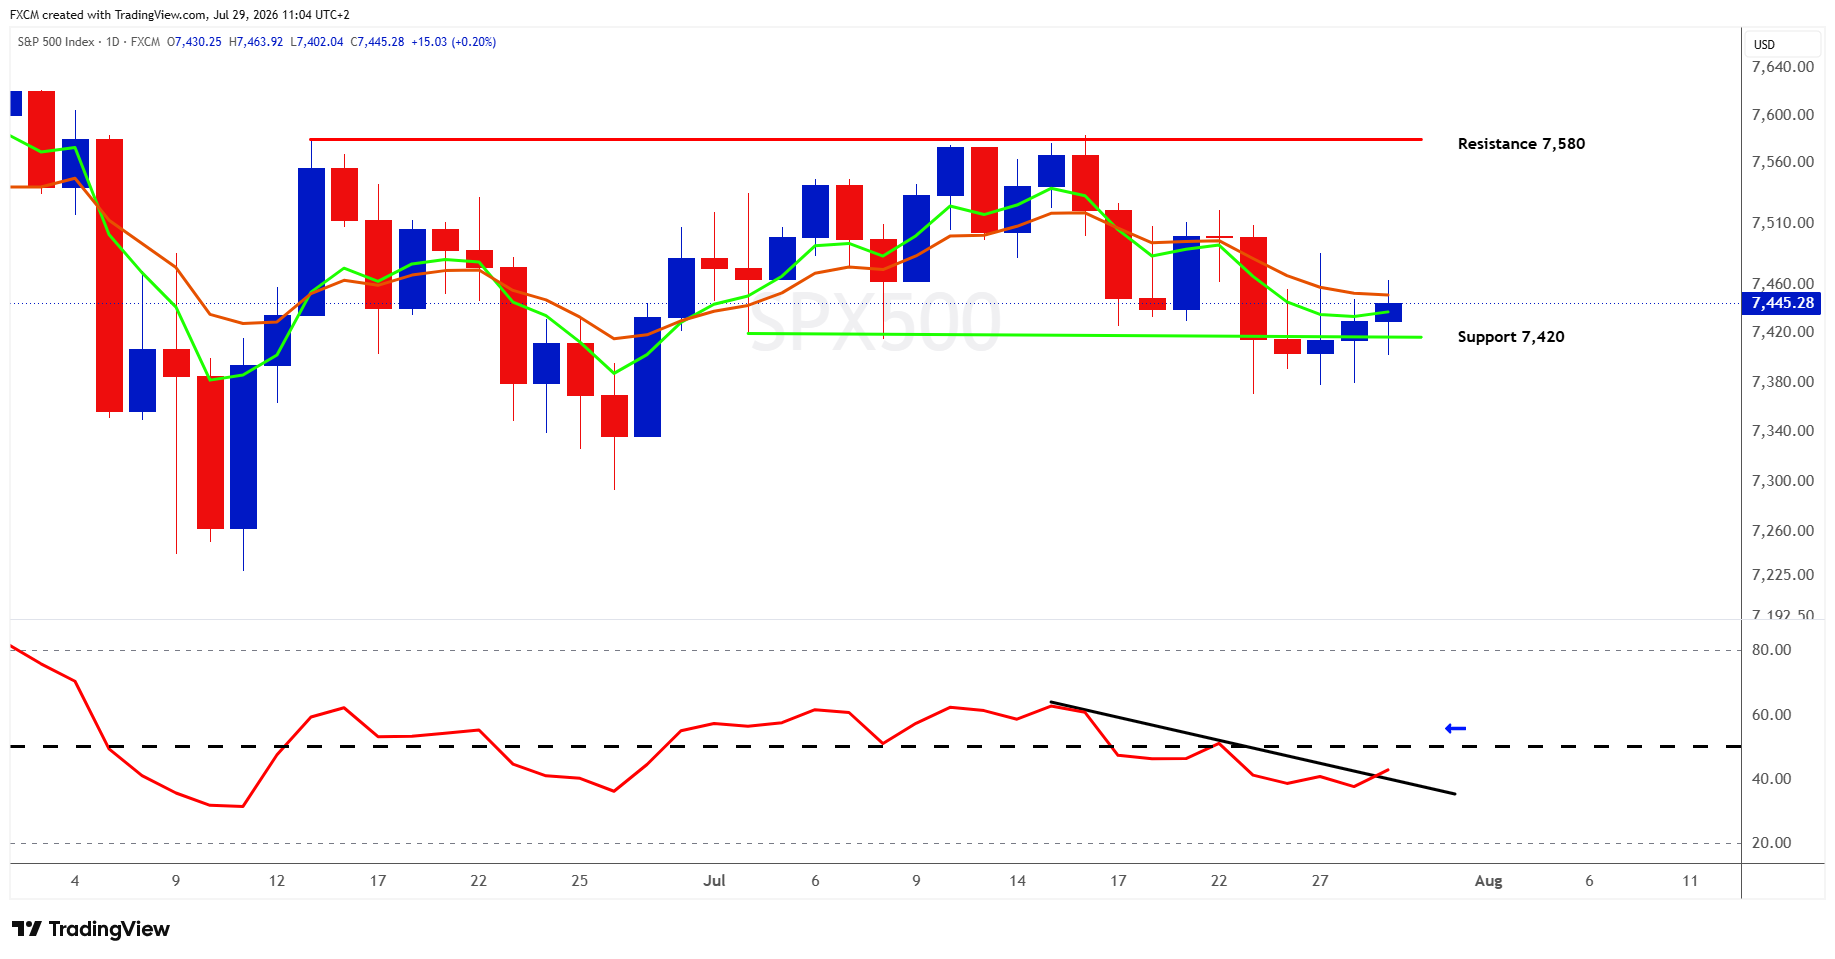
SPX500 is attempting to reclaim the important 7,420 pivot after briefly trading below it. The rebound has lifted price above the faster short-term moving average, while RSI is attempting to break its recent descending trendline, suggesting that bearish momentum may be easing. However, RSI remains below 50 and price is still capped by the slower moving average around 7,455-7,465, so the recovery is not yet confirmed. A sustained move above that zone could open the way towards 7,500-7,510, followed by major resistance near 7,580. A decisive daily close below 7,420 would weaken the rebound and refocus attention on 7,400-7,380, with approximately 7,340 below that.
Fundamental Perspective
SPX500's attempt to reclaim 7,420 reflects improving market breadth, as rotation into non-technology sectors offsets continued semiconductor weakness. The next move is likely to hinge on today's Fed decision, major technology earnings and the renewed rise in oil. A hawkish Fed or persistent oil-driven inflation pressure could push yields higher and threaten a break below 7,420, while a less-hawkish message and reassuring earnings may support a recovery towards 7,500 and ultimately 7,580. For now, the fundamentals support stabilisation, but not yet a convincing return to the previous uptrend.

Russell Shor
Senior Market Strategist
Russell Shor is a Senior Market Strategist at FXCM, having been promoted to the role in 2025 in recognition of his depth of insight and consistent delivery of high-impact market analysis. He originally joined FXCM in October 2017 as a Senior Market Specialist.
Russell holds an Honours Degree in Economics from the University of South Africa, is a certified FMVA®, and a full member of the Society of Technical Analysts (UK). With over 20 years of experience in financial markets, his work is renowned for its clarity, precision, and strategic value across asset classes.

Any opinions, news, research, analyses, prices, other information, or links to third-party sites contained on this website are provided on an "as-is" basis, as general market commentary and do not constitute investment advice. The market commentary has not been prepared in accordance with legal requirements designed to promote the independence of investment research, and it is therefore not subject to any prohibition on dealing ahead of dissemination. Although this commentary is not produced by an independent source, FXCM takes all sufficient steps to eliminate or prevent any conflicts of interests arising out of the production and dissemination of this communication. The employees of FXCM commit to acting in the clients' best interests and represent their views without misleading, deceiving, or otherwise impairing the clients' ability to make informed investment decisions. For more information about the FXCM's internal organizational and administrative arrangements for the prevention of conflicts, please refer to the Firms' Managing Conflicts Policy. Please ensure that you read and understand our Full Disclaimer and Liability provision concerning the foregoing Information, which can be accessed here.