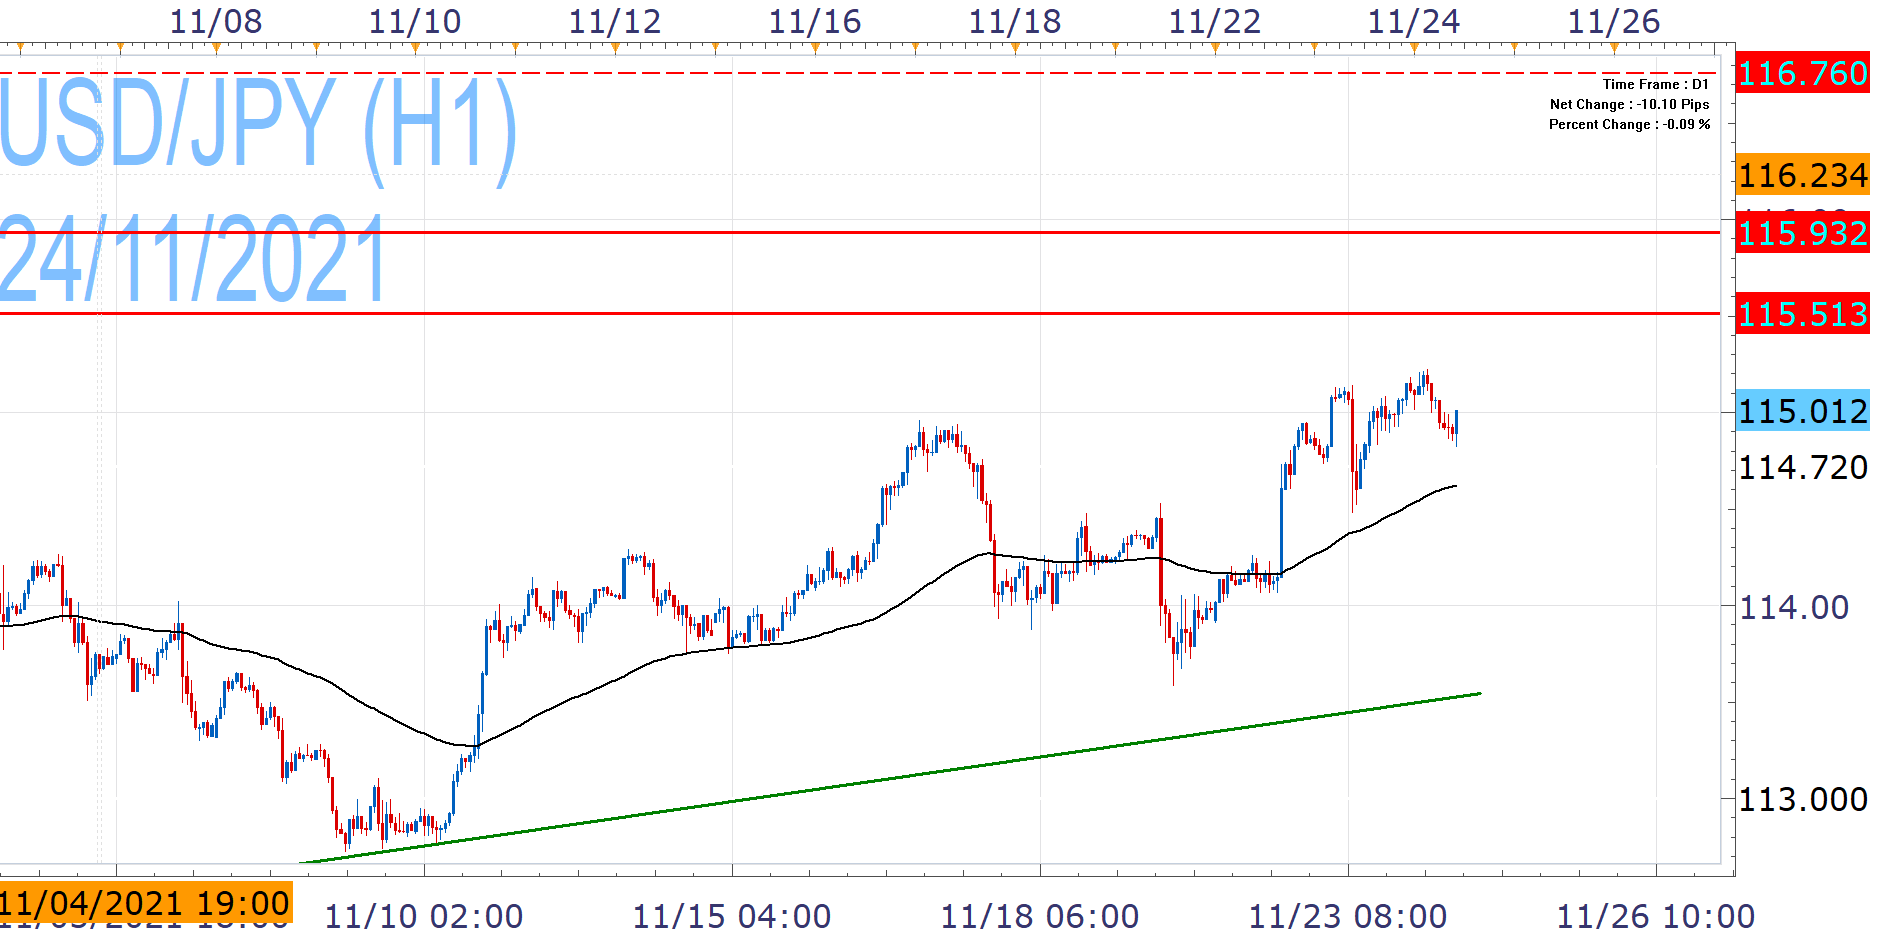
USD/JPY Soft Despite Fresh 4+ Years High
USD/JPY - H1
The pair rose to its highest levels since March 2017 during the Asia-Pacific session, but has since declined, weighed by the slide in US Bond Yields.
Bias remains tilted to the upside as it registers gains of around 1% this week and runs a 4-month profitable streak. Furthermore, today's slide is reminiscent of yesterday's reaction, since the pair had dropped then, after having clinched new highs, but ended the day with profits.
The US Dollar stays in trajectory to test 115.51, but it is probably early for a larger move that will tackle 115.93-116.00.
On the other hand, the current pressures can lead to a breach of EMA100 on the downside, but a larger decline that would challenge 11400, would require a catalyst.
In any case, there are many big news events today that can spur volatility and determine the pair's next leg, while caution is also warranted for potentially thin trading condition over the next couple of days, due to the US Holidays.
Past Performance: Past Performance is not an indicator of future results.
Nikos Tzabouras
Senior Financial Editorial Writer
Nikos Tzabouras is a graduate of the Department of International & European Economic Studies at the Athens University of Economics and Business. With extensive experience in market analysis and a strong foundation in international relations, he brings a unique perspective to financial markets. Nikos emphasizes not only technical analysis but also on fundamentals and the growing influence of geopolitics on financial trends.
As a Senior Financial Editorial Writer, he delivers comprehensive and forward-looking insights across a wide range of asset classes, including equities, commodities, and currencies. His work explores how macroeconomic events, political developments, and global policies impact market dynamics, providing readers with a deeper understanding of both short-term movements and long-term trends.
Any opinions, news, research, analyses, prices, other information, or links to third-party sites contained on this website are provided on an "as-is" basis, as general market commentary and do not constitute investment advice. The market commentary has not been prepared in accordance with legal requirements designed to promote the independence of investment research, and it is therefore not subject to any prohibition on dealing ahead of dissemination. Although this commentary is not produced by an independent source, FXCM takes all sufficient steps to eliminate or prevent any conflicts of interests arising out of the production and dissemination of this communication. The employees of FXCM commit to acting in the clients' best interests and represent their views without misleading, deceiving, or otherwise impairing the clients' ability to make informed investment decisions. For more information about the FXCM's internal organizational and administrative arrangements for the prevention of conflicts, please refer to the Firms' Managing Conflicts Policy. Please ensure that you read and understand our Full Disclaimer and Liability provision concerning the foregoing Information, which can be accessed here.