USD/JPY Posts 4+ Years High
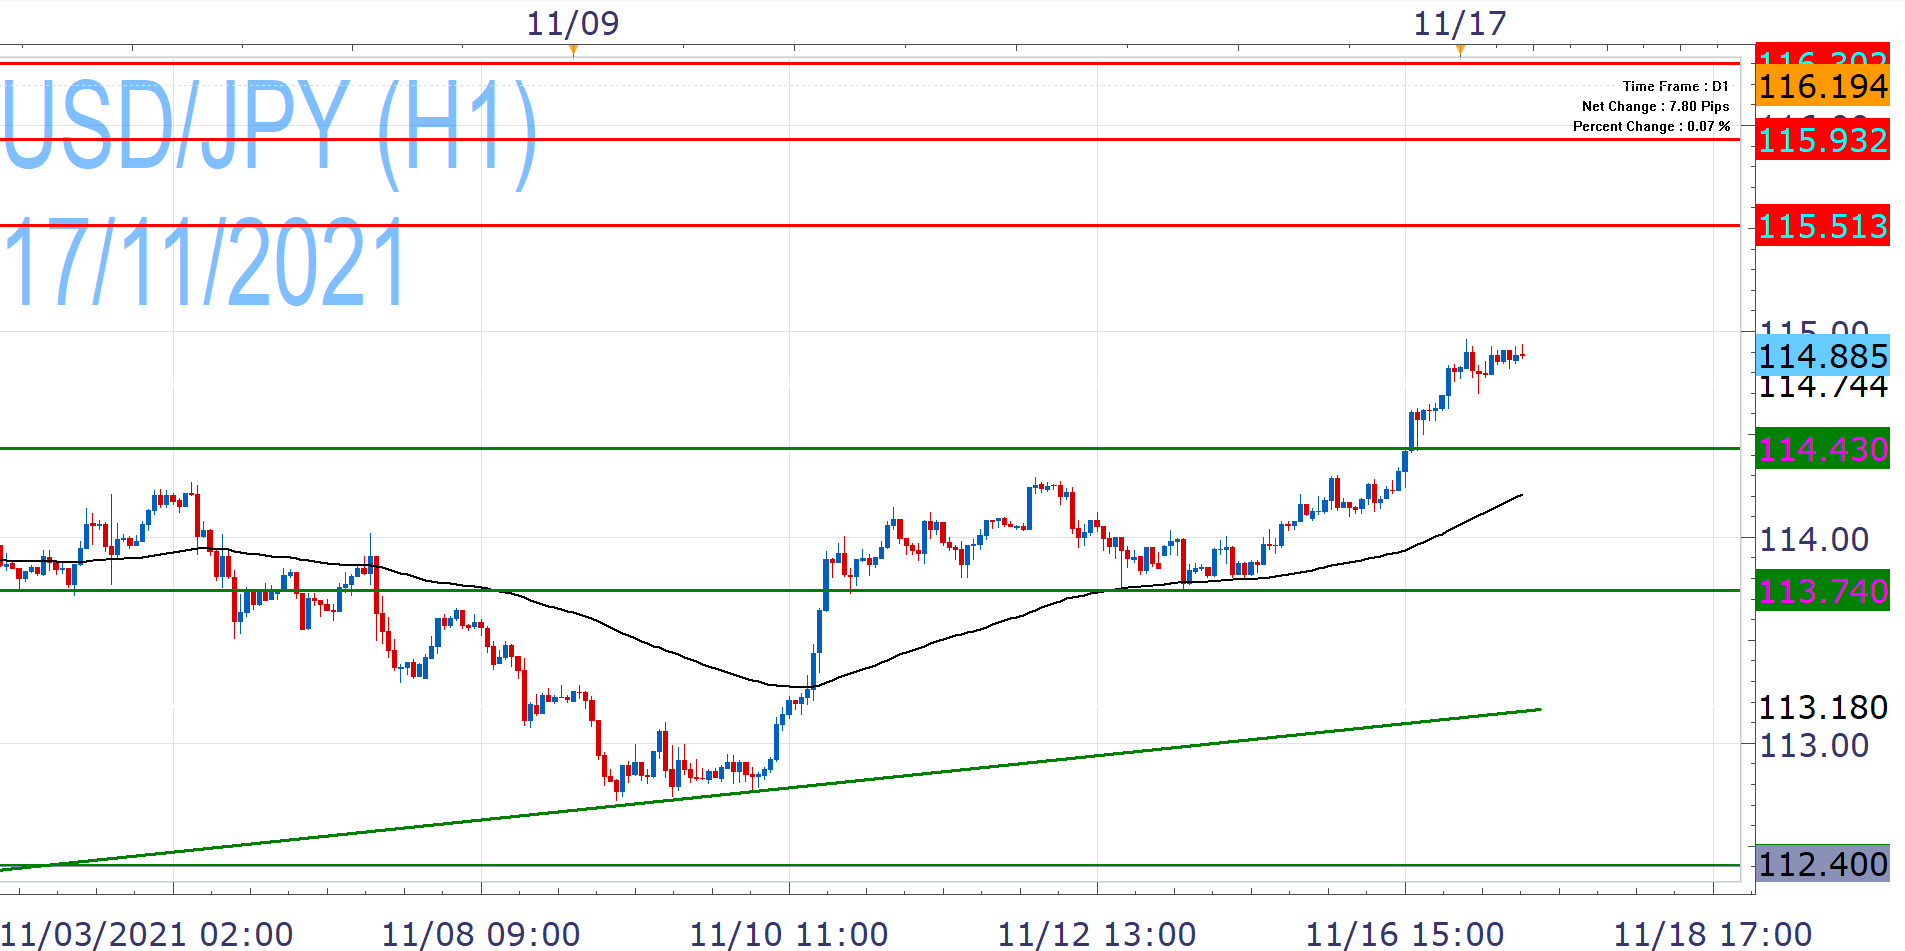
USD/JPY - H1
It took the Dollar almost a month to break above October multi-year highs, but yesterday it managed to reach its highest levels since March 2017, extending them today. This was achieved in the aftermath of Tuesday's improved US Retail Sales and Industrial Production, as well as Fed's Bullard hawkish remarks.
The greenback tries to take 115.00 out that will allow it to push towards 115.51 (March 2017 highs) and look even higher, but shows signs of exhaustion during the European hours, following its solid open to the day.
Furthermore, US 10 Year Bond Yields trade with caution today, constraining the bullish momentum. From here, a correction towards 114.50-43 would not be unlikely, but the pair is well protected from that point on, as the EMA100 follows closely. A break below this level would pause the upward momentum and expose it to the weekly lows (113.74), which are probably out of reach at this stage.
Past Performance: Past Performance is not an indicator of future results.
Nikos Tzabouras
Senior Financial Editorial Writer
Nikos Tzabouras is a graduate of the Department of International & European Economic Studies at the Athens University of Economics and Business. With extensive experience in market analysis and a strong foundation in international relations, he brings a unique perspective to financial markets. Nikos emphasizes not only technical analysis but also on fundamentals and the growing influence of geopolitics on financial trends.
As a Senior Financial Editorial Writer, he delivers comprehensive and forward-looking insights across a wide range of asset classes, including equities, commodities, and currencies. His work explores how macroeconomic events, political developments, and global policies impact market dynamics, providing readers with a deeper understanding of both short-term movements and long-term trends.
Any opinions, news, research, analyses, prices, other information, or links to third-party sites contained on this website are provided on an "as-is" basis, as general market commentary and do not constitute investment advice. The market commentary has not been prepared in accordance with legal requirements designed to promote the independence of investment research, and it is therefore not subject to any prohibition on dealing ahead of dissemination. Although this commentary is not produced by an independent source, FXCM takes all sufficient steps to eliminate or prevent any conflicts of interests arising out of the production and dissemination of this communication. The employees of FXCM commit to acting in the clients' best interests and represent their views without misleading, deceiving, or otherwise impairing the clients' ability to make informed investment decisions. For more information about the FXCM's internal organizational and administrative arrangements for the prevention of conflicts, please refer to the Firms' Managing Conflicts Policy. Please ensure that you read and understand our Full Disclaimer and Liability provision concerning the foregoing Information, which can be accessed here.