Trade Wave system
Introduction
Trading isn't a shortcut to wealth; it's a craft built on patience, discipline, and steady improvement. Success comes from understanding how markets behave and controlling risk so you can survive the rough patches and benefit when conditions turn.
This programme focuses on trading with the market's direction, not predicting every move. We align with momentum, follow clear rules, and rely on repetition to tilt probabilities in our favour.
Losses are inevitable, but they must stay small. A process that cuts losers quickly and allows bigger winners to run can produce strong long-term results, even if each trade feels uncertain.
Markets trend, pause, and trend again. Our job is to identify the trending phases and participate while they last. Technical tools guide us, but no signal guarantees the future, each trade is simply a controlled risk.
Trend following rests on one simple truth: trends continue more often than they reverse. We ride strength, step aside when it fades, and let the market decide the outcome. This systematic approach brings clarity, discipline, and confidence.
Trends
To identify market trends, we use exponential moving averages (EMAs), which are well-established trend-following indicators. Specifically, this approach applies the 50-period and 200-period EMAs to determine direction.
When the 50-period EMA is above the 200-period EMA, the market is considered to be in an uptrend. Conversely, when the 50-period EMA falls below the 200-period EMA, the market is regarded as being in a downtrend.
Uptrend
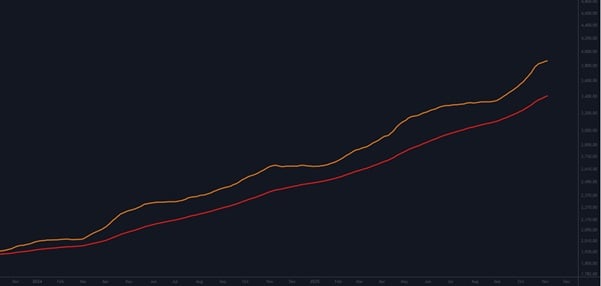
Source: TradingView
In this chart, the orange 50-day EMA sits above the red 200-day EMA, indicating an uptrend. This is important because, in an uptrend, we only look for long trade opportunities.
Now let's add the candlesticks back to the chart to observe the instrument's price action.
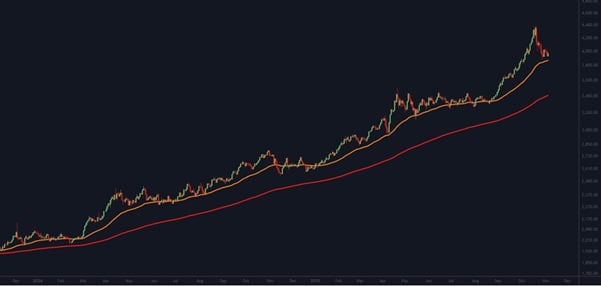
Source: TradingView
Downtrend
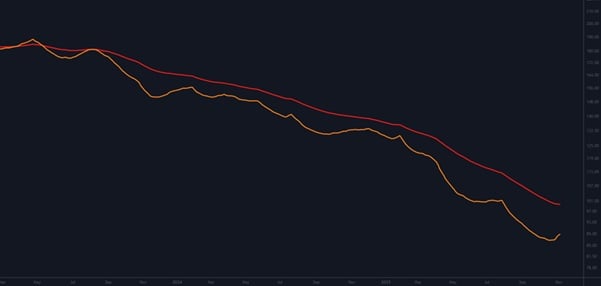
Source: TradingView
Here, the orange 50-day EMA is below the red 200-day EMA, signalling a downtrend. This matters because, in a downtrend, we only look for short trade opportunities.
Now let's add the candlesticks back to see how price has been moving in this environment.
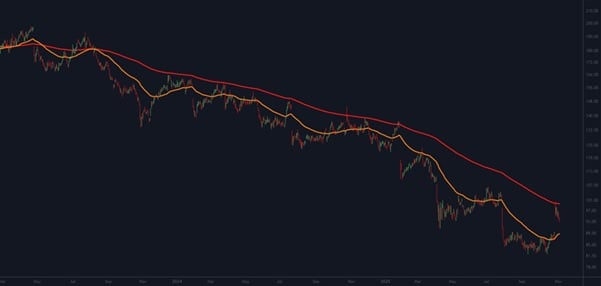
Source: TradingView
Trend Momentum
Typically, once a trend is established, it remains in place until underlying fundamentals shift. During a pullback, a dip in an uptrend or a rise in a downtrend, the area between the 50-day EMA and the 200-day EMA often acts as support in an uptrend and resistance in a downtrend.
This concept is key, as it allows us to identify lower-risk, higher-probability trade entries.
Trigger EMA
We use a faster EMA as the trigger, in this case a 12-period EMA.
Defining the EMA Stack
Because this strategy relies on EMA alignment, we introduce the term EMA stack.
An EMA stack refers to the ordering of the key EMAs relative to one another:
- Bullish EMA stack: 12 above 50, and 50 above 200
- Bearish EMA stack: 12 below 50, and 50 below 200
A clean stack shows directional clarity and confirms the underlying trend structure. A broken or tangled stack indicates indecision, chop, or transition.
Long Entry and Exit
For a long setup, we want three things to line up:
- The 50-period EMA sits above the 200-period EMA.
- Price breaks above the 12-period EMA.
- The 12-period EMA turns upward.
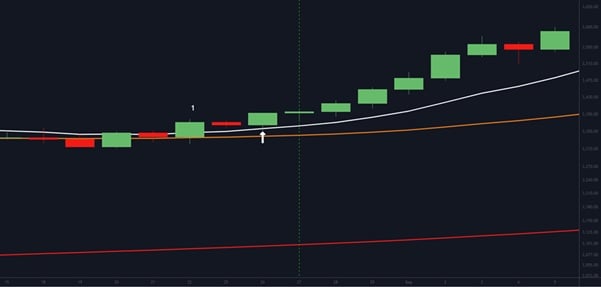
Source: TradingView
- The orange 50-period EMA is above the red 200-period EMA.
- Price closes above the white 12-period EMA at candle 1.
- Two candles later, the white 12-period EMA turns upward, completing the entry signal (white arrow).
- The entry is taken on the following candle once all conditions are met (green dashed vertical line).
Once you've entered a long trade, the cleanest and most responsive way to manage your exit is to use the 12-period EMA as your momentum line. In a strong long move, price should stay above the 12-EMA. As long as that holds, buyers are still driving the trend. The moment a candle closes below it, the momentum that powered your entry has weakened. That's your cue to step aside.
This approach gives you fast protection without overcomplicating the process. It keeps you aligned with short-term trend shifts, locks in gains when the market hesitates, and cuts you out before a deeper reversal has the chance to build.
Example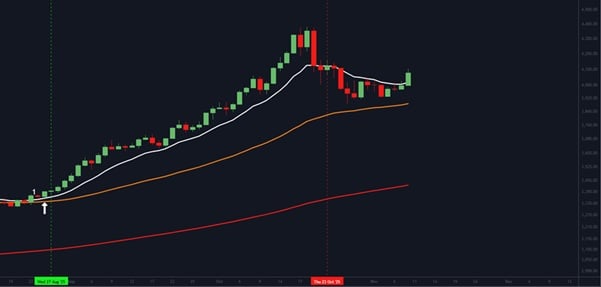
Source: TradingView
The long entry occurred on 27 August 2025. The 12-EMA exit signal appeared on 22 October when a candle closed below the white EMA. The position would have been closed on 23 October. Entry was near $3,395 and the exit around $4,095, banking roughly a 20 percent gain.
From here, the trader simply waits for the long conditions to set up again before re-entering.
Short Entry and Exit
For a short setup, we want three things to line up:
- The 50-period EMA sits below the 200-period EMA.
- Price breaks below the 12-period EMA.
- The 12-period EMA turns downward.
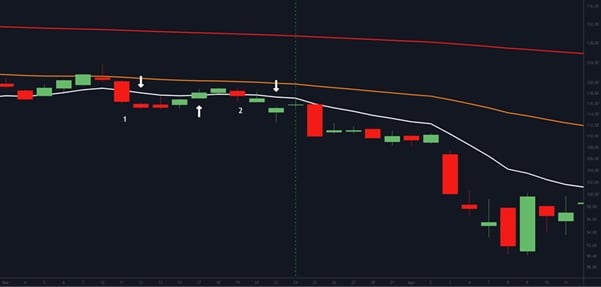
Source: TradingView
In this example, the short entry wasn't clean, and that's intentional. Trades rarely line up perfectly. To start, the orange 50-period EMA was already below the red 200-period EMA, confirming a bearish backdrop. Price then crossed below the white 12-EMA at point 1, and the 12-EMA turned down on the next candle. A short taken here may have been cancelled soon after, depending on stop-loss rules, when price briefly pushed back above the 12-EMA.
The broader move, however, was still leaning lower. Price crossed back under the 12-EMA at point 2, and the EMA turned down again. That second confirmation would trigger the short entry on the following candle.
Once you've entered a short trade, the simplest and most responsive way to manage your exit is to use the 12-period EMA as your momentum line. In a healthy downside move, price should remain below the 12-EMA. As long as that holds, sellers are still in control. The moment a candle closes back above it, the downside momentum has weakened. That's your signal to get out.
Example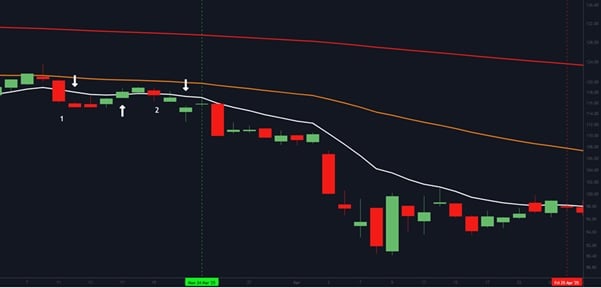
Source: TradingView
The short entry occurred on 25 March 2025. A month later, a candle closed above the 12-period EMA, triggering the exit. Entry was around 115 and the exit near 98, giving roughly an 11 percent gain.
The Strategy's Strengths and Its Vulnerable Spots
For this system to work effectively, you need clean market structure and a trend that actually develops momentum. The EMAs must separate clearly so you can read direction with confidence, and price needs to respect the 12-period EMA often enough for it to act as a reliable guide. The setup shines in smooth trending markets, whether the move is up or down, because the 12-EMA has space to behave like a true momentum line rather than a random boundary.
Complications arise when conditions turn choppy. Sideways action, whipsaws, and false breaks can trigger premature exits long before a proper trend forms. In these phases, price may flicker across the 12-EMA repeatedly, forcing unnecessary re-entries. High-volatility bursts can also distort EMA angles, temporarily breaking the visual flow of the trend and making signals harder to trust.
In short, the system performs best when structure is clear and momentum is stable. It becomes more difficult in noisy, range-bound, or news-driven markets. Recognising the difference is part of the skill: the method itself is simple, but reading the environment around it is what keeps you on the right side of the move.
The 2 Percent Rule and the Power of a Trailing Stop
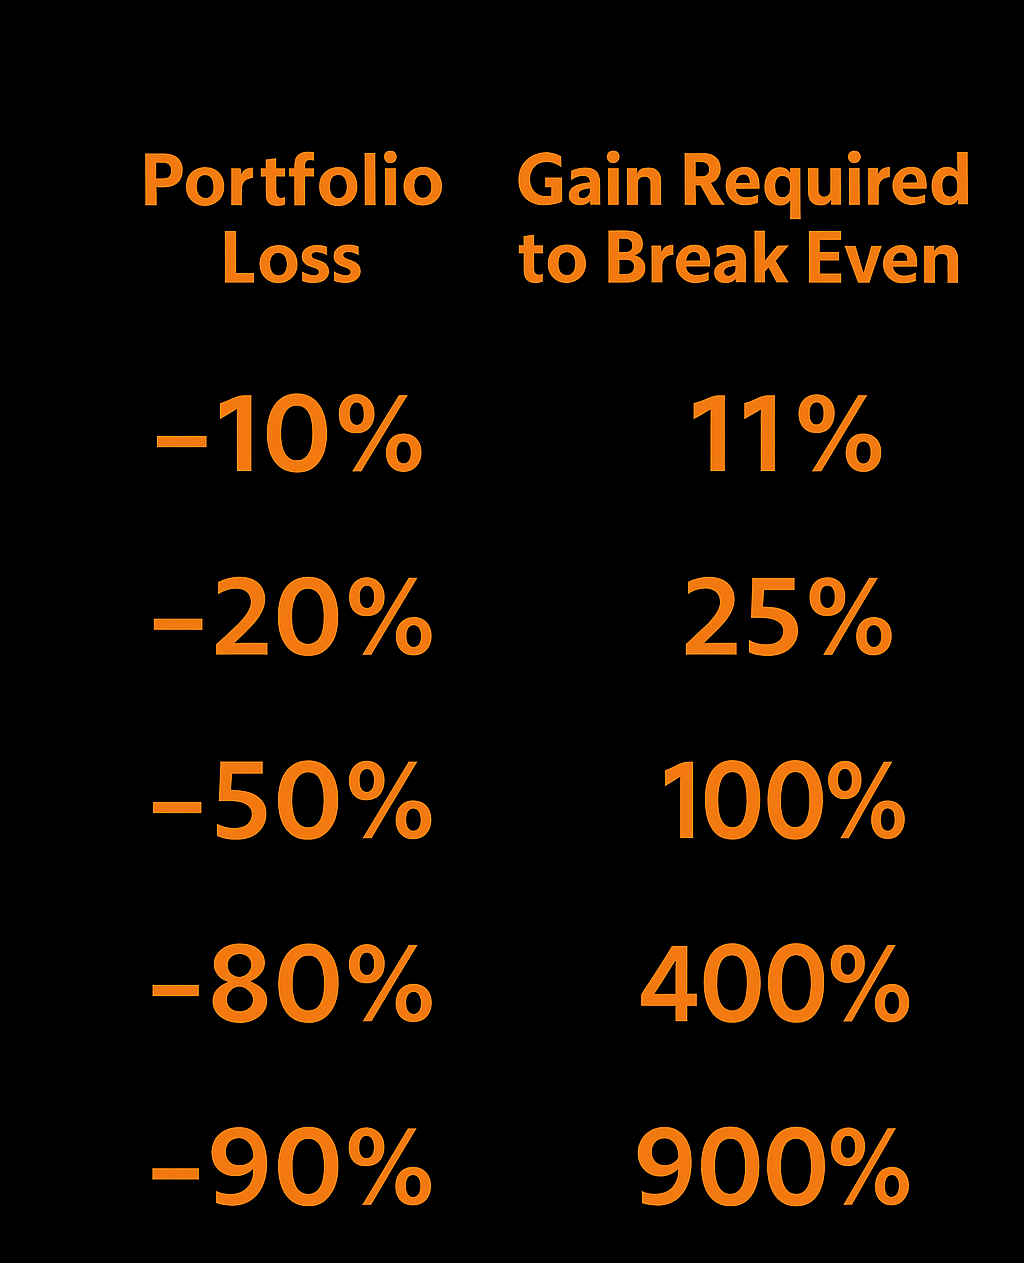
Stop-losses and money management aren't just add-ons to this system; they're the backbone that keeps you alive in the market. No matter how good the setup looks, no single trade should ever risk more than 2 percent of your account.
For a long trade, the initial stop sits below the entry. As price moves higher and the 12-period EMA rises with it, the EMA becomes your dynamic trail. Each time price respects the EMA and pushes upward, you tighten the stop accordingly. If price eventually closes below the 12-EMA, momentum has cracked, and the trade is closed.
For a short trade, the logic is flipped. The initial stop is placed above the entry, and as the trend progresses and the 12-EMA slopes downward, the stop is trailed lower. The moment price closes back above the EMA, the downside momentum has faded.
Trailing the stop with the EMA ties the entire approach together. The initial stop defines your risk. The 2 percent rule protects your capital. The EMA keeps you aligned with momentum. Together, they create consistency, control, and longevity in the market.
Position Sizing and the Initial Stop
Position sizing isn't guesswork; it's a calculation. The size of every trade begins with one unbreakable rule: no more than 2 percent of your trading account may be at risk at any time. The only way to enforce this consistently is to size each position based on the distance between the entry price and the initial stop-loss.
For a long trade, the initial stop is placed below the entry. For a short, it sits above it. The stop distance becomes the balancing number that determines how large or small the position may be. A wider stop means a smaller position; a tighter stop allows a larger one. The formula is straightforward:
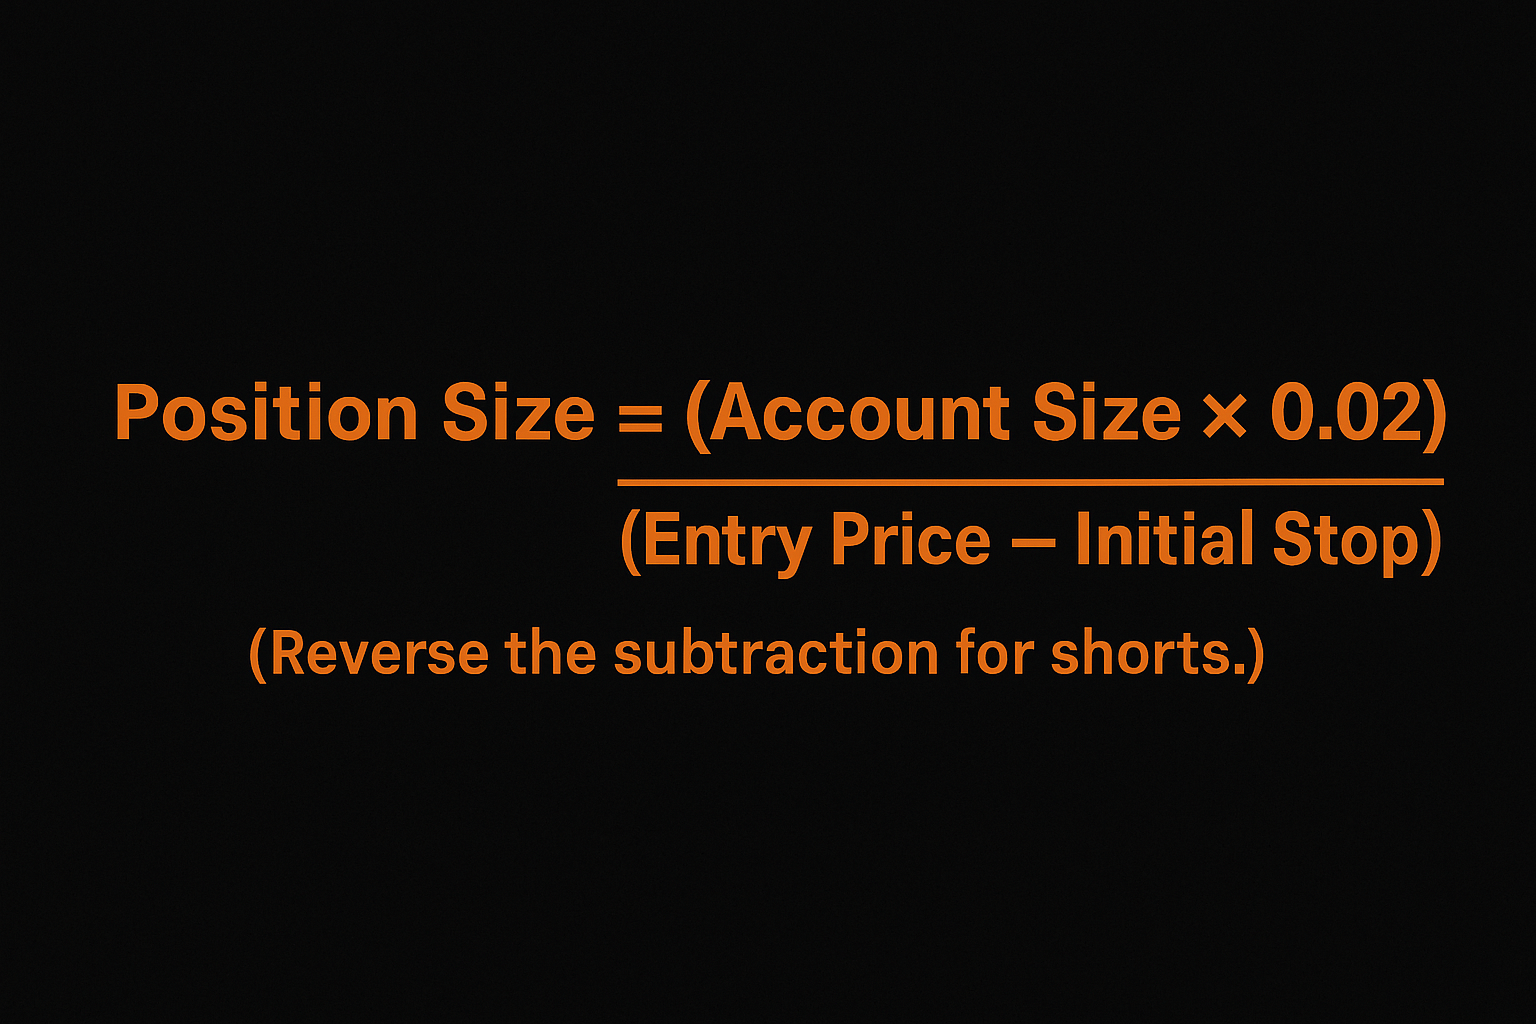
This ensures your total risk remains capped at 2 percent regardless of the instrument traded.
The initial stop defines the maximum acceptable loss and anchors the position-size calculation. Once the trade is active, the 12-period EMA becomes the dynamic exit, but the initial stop is where the risk management begins.
Some traders opt for ATR-based stops to account for volatility. An ATR stop widens in fast-moving markets and tightens in quiet markets. Common variations include 1.5× or 2× ATR beyond the entry. These can reduce premature stop-outs in volatile conditions, though they must still respect the 2 percent rule.
Whatever method you choose, structural stops or volatility-adjusted stops, your initial stop determines your position size, and your position size ensures your risk stays controlled. This discipline keeps the system robust across all market conditions.
Conclusion
The Trade Wave System is built on principles that have stood the test of time: follow the trend, protect your capital, and let the market, not emotion, dictate your decisions. By combining clear EMA structure, a simple but effective trigger, disciplined exits, and strict money management, this approach offers a repeatable framework that removes guesswork and brings consistency to your trading.
No method eliminates uncertainty, and no system wins on every trade. But a rules-driven process that keeps losses small and allows winners to grow places you firmly on the right side of probability. With practice, the Trade Wave System becomes more than a collection of indicators; it becomes a way of thinking, patient, structured, and aligned with market behaviour rather than fighting against it.
Your job is not to predict. Your job is to recognise when momentum is in your favour, participate while it lasts, and step aside the moment it fades. Do this with discipline, protect your account with the 2 percent rule, trail your stops with the EMA, and you give yourself an edge that compounds over time.
Trading rewards those who manage risk first and profit second. This system embodies that philosophy. Apply it with consistency, refine it with experience, and you will build a foundation strong enough to support a long and successful trading journey.
FXCM Research Team
FXCM Research Team consists of a number of FXCM's Market and Product Specialists.
Articles published by FXCM Research Team generally have numerous contributors and aim to provide general Educational and Informative content on Market News and Products.
Any opinions, news, research, analyses, prices, other information, or links to third-party sites contained on this website are provided on an "as-is" basis, as general market commentary and do not constitute investment advice. The market commentary has not been prepared in accordance with legal requirements designed to promote the independence of investment research, and it is therefore not subject to any prohibition on dealing ahead of dissemination. Although this commentary is not produced by an independent source, FXCM takes all sufficient steps to eliminate or prevent any conflicts of interests arising out of the production and dissemination of this communication. The employees of FXCM commit to acting in the clients' best interests and represent their views without misleading, deceiving, or otherwise impairing the clients' ability to make informed investment decisions. For more information about the FXCM's internal organizational and administrative arrangements for the prevention of conflicts, please refer to the Firms' Managing Conflicts Policy. Please ensure that you read and understand our Full Disclaimer and Liability provision concerning the foregoing Information, which can be accessed here.