Tesla Stock Declines, Weekly Pattern Breakdown, After Poor Q3 Earnings

Comment
Tesla released its Q3 earnings yesterday, which were weak and included downbeat comments from CEO Elon Musk. Company adjusted EPS was 66c with disappointing gross margins (excluding regulatory credit sales) of 16.3%. This was lower than the Wall Street estimate of 70c and 17.5% respectively. Operating margin was 7.6%, almost 10% lower than 2022's comparable.
Tesla's price cutting is largely to blame, with Musk commenting on the high-rate environment, saying "I can't emphasize this enough … the vast majority of people buying a car is about the monthly payment."
The poor results have had technical implications.
Weekly Chart Breakdown
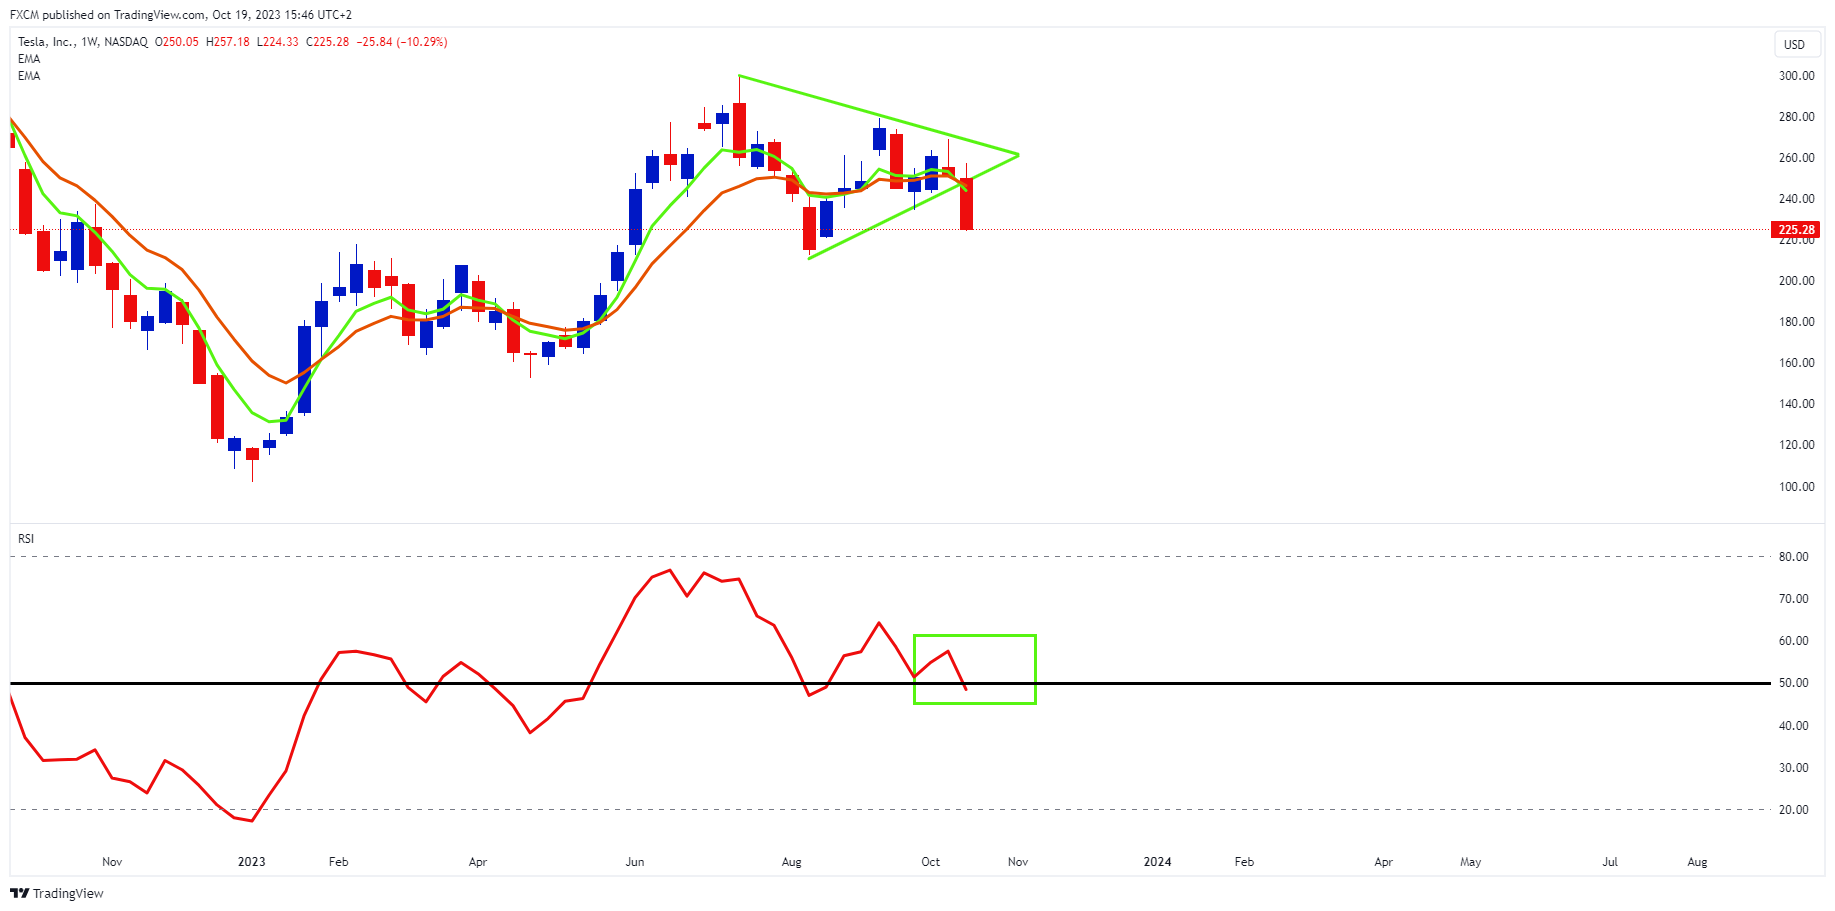
Source: www.tradingview.com
- Yesterday, we referenced the coil or symmetrical triangle that defined Tesla's weekly chart.
- Following the results release, TSLA.us stock opened over 7% down today.
- This has resulted in a breakdown from the symmetrical triangle.
- Tesla's green 5-week EMA is looking to cross below its orange 10-week EMA.
- If successful, this will put the weekly EMAs into a bearish formation.
- Moreover, the weekly RSI has dipped below 50 (green rectangle).
- If it sustains on this side of the RSI, there is likely to be an underlying bearish momentum which will act against Tesla's price.

Russell Shor
Senior Market Strategist
Russell Shor is a Senior Market Strategist at FXCM, having been promoted to the role in 2025 in recognition of his depth of insight and consistent delivery of high-impact market analysis. He originally joined FXCM in October 2017 as a Senior Market Specialist.
Russell holds an Honours Degree in Economics from the University of South Africa, is a certified FMVA®, and a full member of the Society of Technical Analysts (UK). With over 20 years of experience in financial markets, his work is renowned for its clarity, precision, and strategic value across asset classes.
Any opinions, news, research, analyses, prices, other information, or links to third-party sites contained on this website are provided on an "as-is" basis, as general market commentary and do not constitute investment advice. The market commentary has not been prepared in accordance with legal requirements designed to promote the independence of investment research, and it is therefore not subject to any prohibition on dealing ahead of dissemination. Although this commentary is not produced by an independent source, FXCM takes all sufficient steps to eliminate or prevent any conflicts of interests arising out of the production and dissemination of this communication. The employees of FXCM commit to acting in the clients' best interests and represent their views without misleading, deceiving, or otherwise impairing the clients' ability to make informed investment decisions. For more information about the FXCM's internal organizational and administrative arrangements for the prevention of conflicts, please refer to the Firms' Managing Conflicts Policy. Please ensure that you read and understand our Full Disclaimer and Liability provision concerning the foregoing Information, which can be accessed here.