SPX500 has healthy undertones despite being overbought

Source: www.tradingview.com
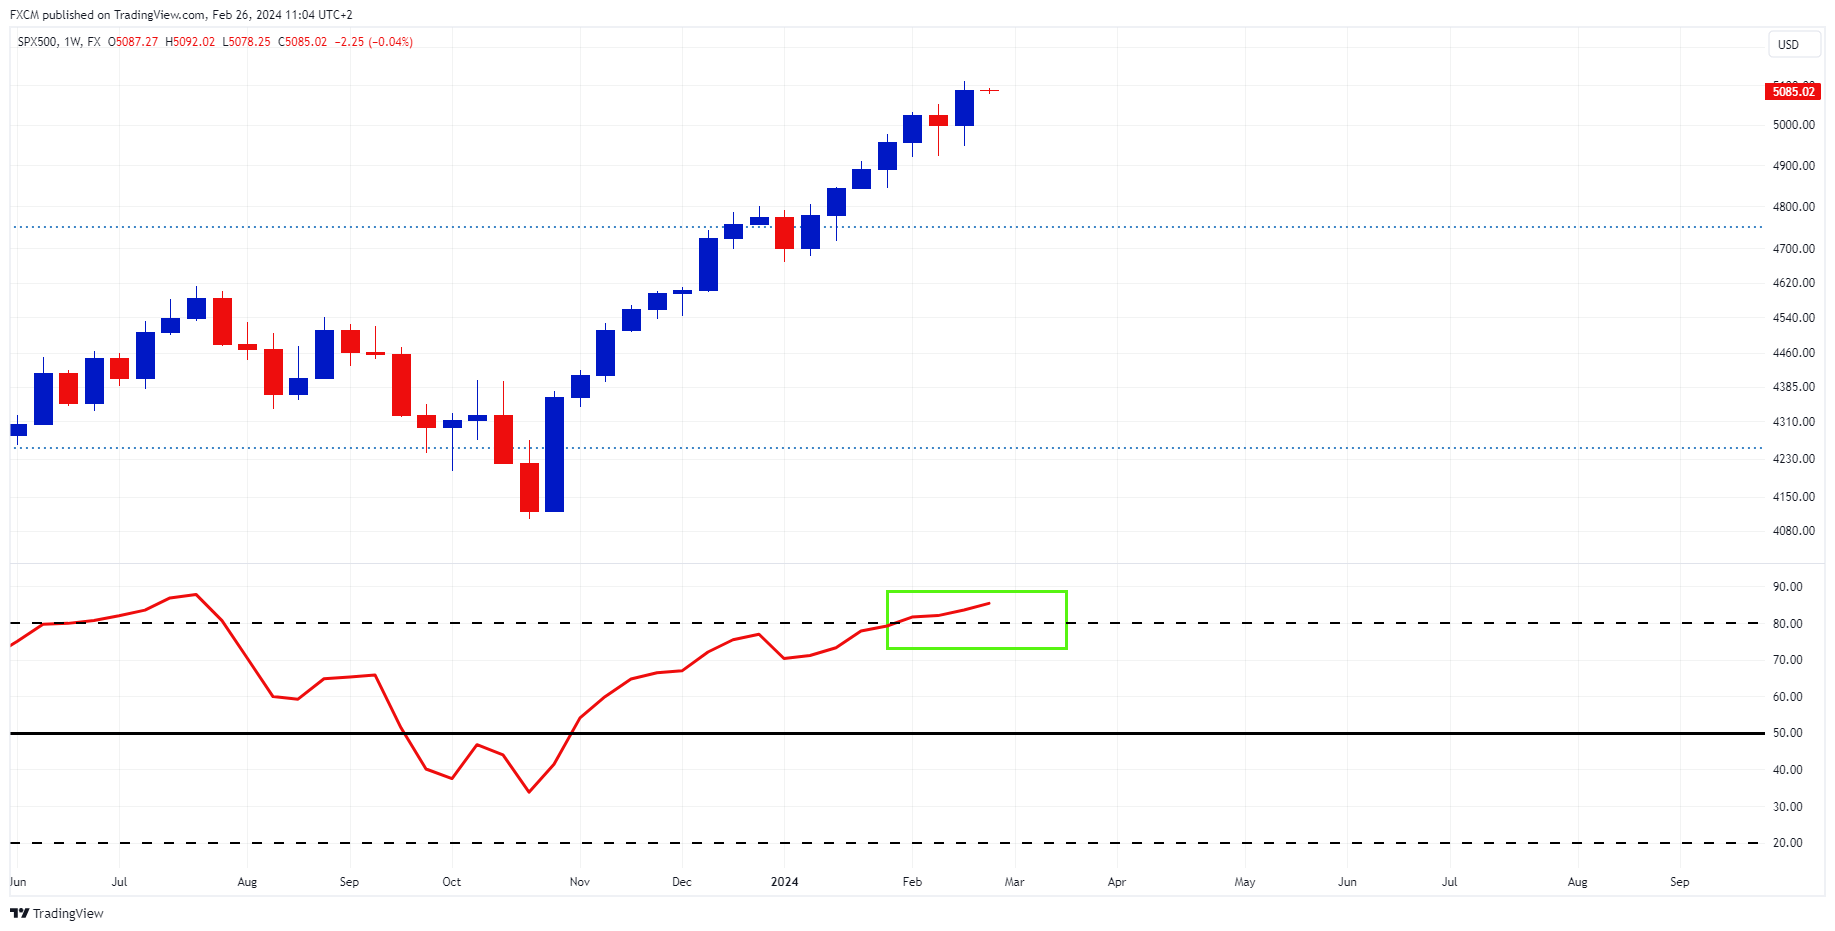
The SPX500 is overbought as per its weekly RSI (green rectangle), largely due to the artificial intelligence narrative. In this regard, some of the index's top constituents by market capitalisation, not surprisingly, are also overbought, contributing to the overall heat of the index. Examples include Meta, NVidia, and Amazon.com amongst others.
However, despite all the hype, there are signs that the general market is healthy and that the gains are not all AI related. On the contrary, the tech, healthcare and industrials sectors have hit new highs, with financials and materials just shy of new all-time highs.
Moreover, the Inveso S&P 500 equal weighted ETF (not shown) is also close to an all-time high and has charted a higher trough followed by a higher peak. I.e. the equal weighted index is trending up.
The rally persists despite the first expected rate cut for the year being shifted back from March to May and now to June. The expectations for seven rate cuts in 2024 have evaporated, yet the markets remain resilient. One of the reasons is that corporate earnings have been market supportive, with nearly 80% of companies that have reported having beaten Wall Street estimates. This is better than the historical average.
There is a possibility that the SPX500 will need to normalise along with its constituents that are overbought. However, given the health of the broader market, corrections at this point will likely garner interest by market participants, who would want to buy back in at lower and better prices.
Russell Shor
Senior Market Strategist
Russell Shor is a Senior Market Strategist at FXCM, having been promoted to the role in 2025 in recognition of his depth of insight and consistent delivery of high-impact market analysis. He originally joined FXCM in October 2017 as a Senior Market Specialist.
Russell holds an Honours Degree in Economics from the University of South Africa, is a certified FMVA®, and a full member of the Society of Technical Analysts (UK). With over 20 years of experience in financial markets, his work is renowned for its clarity, precision, and strategic value across asset classes.
Any opinions, news, research, analyses, prices, other information, or links to third-party sites contained on this website are provided on an "as-is" basis, as general market commentary and do not constitute investment advice. The market commentary has not been prepared in accordance with legal requirements designed to promote the independence of investment research, and it is therefore not subject to any prohibition on dealing ahead of dissemination. Although this commentary is not produced by an independent source, FXCM takes all sufficient steps to eliminate or prevent any conflicts of interests arising out of the production and dissemination of this communication. The employees of FXCM commit to acting in the clients' best interests and represent their views without misleading, deceiving, or otherwise impairing the clients' ability to make informed investment decisions. For more information about the FXCM's internal organizational and administrative arrangements for the prevention of conflicts, please refer to the Firms' Managing Conflicts Policy. Please ensure that you read and understand our Full Disclaimer and Liability provision concerning the foregoing Information, which can be accessed here.