Rivian reports strong deliveries for Q2

Source: www.tradingview.com
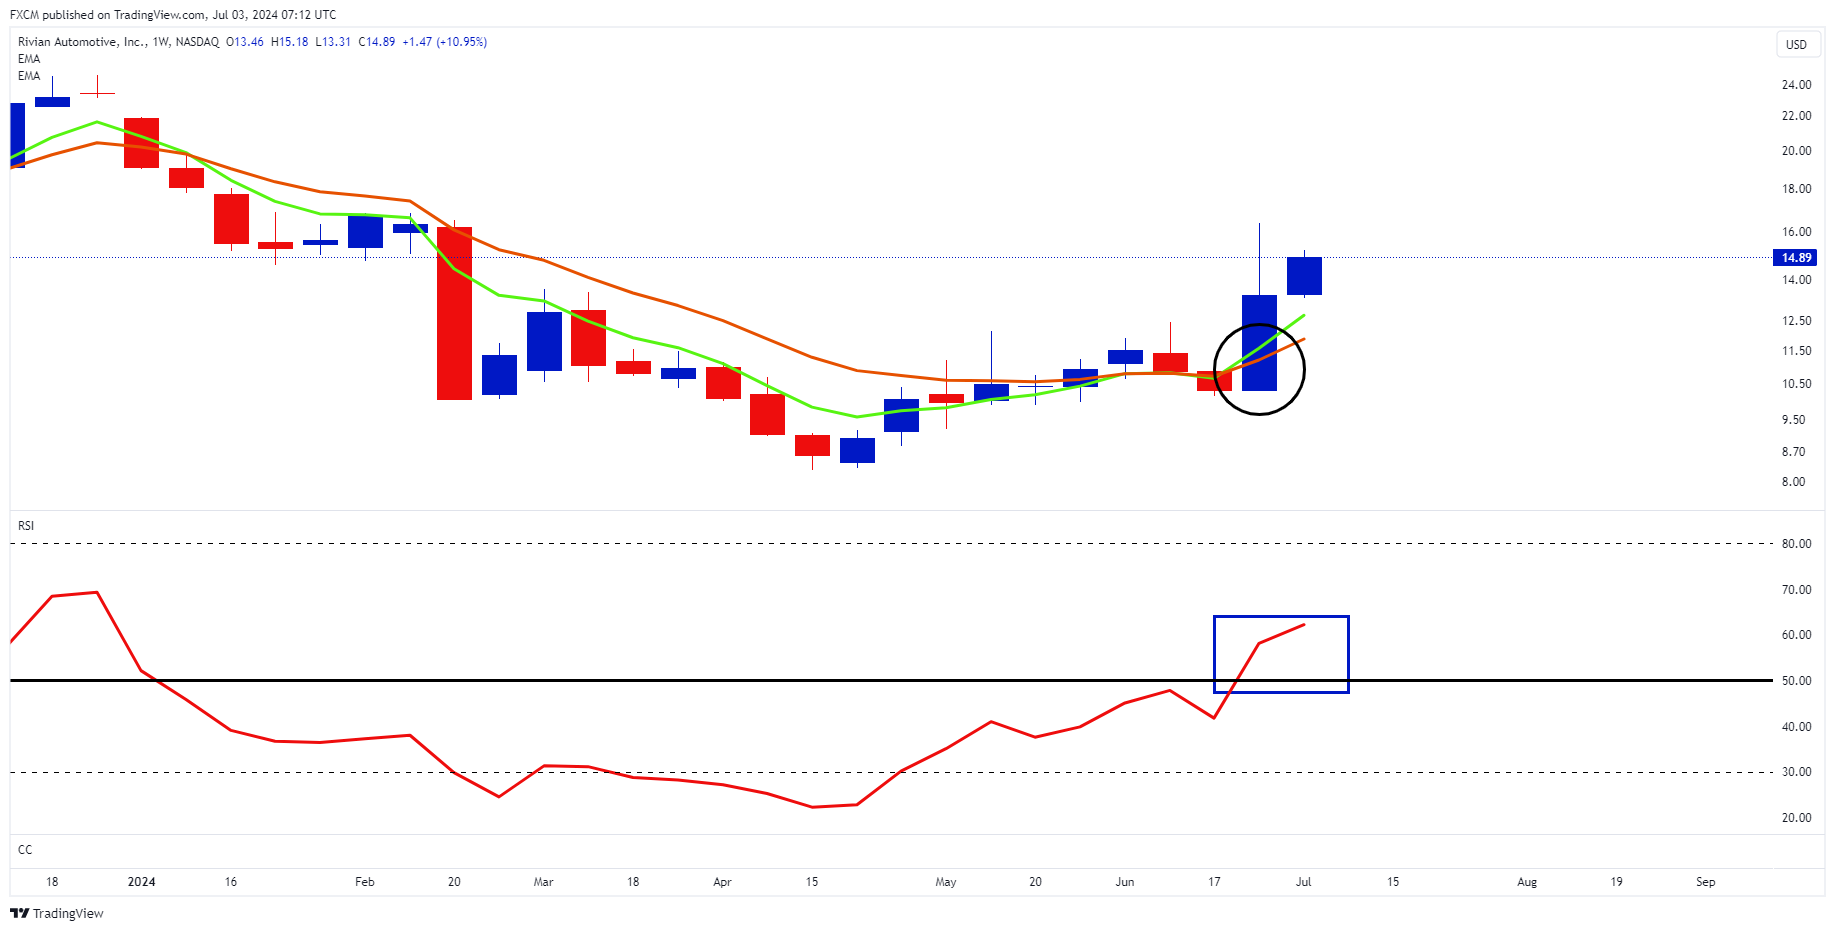
Rivian Automotive reported strong Q2 deliveries of 13,790 vehicles, a 9% year-over-year increase, surpassing Wall Street's expectation of 12,000 units. However, production dropped to approximately 9,600 vehicles from nearly 14,000 in Q1 2024. Rivian aims to produce about 57,000 vehicles in 2024, needing around 17,000 per quarter in the second half of the year. Rivian's stock rose 6.97% to $14.89 on Tuesday, though it fell slightly post-delivery report. The stock saw a 40% rise recently, driven by a joint venture with Volkswagen and a positive investor day, which detailed cost cutting and plans to move to profitability. Rivian also benefited from Tesla's strong delivery report, indicating sustained global EV demand.
Analysts see resistance at $15 per share, with potential to reach $20. However, there are positive technical developments. The 5- and 10-week EMA have crossed bullishly (black ellipse). Moreover, the weekly RSI is on the bullish side of 50 (blue rectangle). The longer it maintains above 50 the greater the likelihood of further price appreciation ahead.
Despite this, Rivian shares are down 32% year to date due to slowing sales growth.

Russell Shor
Senior Market Strategist
Russell Shor is a Senior Market Strategist at FXCM, having been promoted to the role in 2025 in recognition of his depth of insight and consistent delivery of high-impact market analysis. He originally joined FXCM in October 2017 as a Senior Market Specialist.
Russell holds an Honours Degree in Economics from the University of South Africa, is a certified FMVA®, and a full member of the Society of Technical Analysts (UK). With over 20 years of experience in financial markets, his work is renowned for its clarity, precision, and strategic value across asset classes.
Any opinions, news, research, analyses, prices, other information, or links to third-party sites contained on this website are provided on an "as-is" basis, as general market commentary and do not constitute investment advice. The market commentary has not been prepared in accordance with legal requirements designed to promote the independence of investment research, and it is therefore not subject to any prohibition on dealing ahead of dissemination. Although this commentary is not produced by an independent source, FXCM takes all sufficient steps to eliminate or prevent any conflicts of interests arising out of the production and dissemination of this communication. The employees of FXCM commit to acting in the clients' best interests and represent their views without misleading, deceiving, or otherwise impairing the clients' ability to make informed investment decisions. For more information about the FXCM's internal organizational and administrative arrangements for the prevention of conflicts, please refer to the Firms' Managing Conflicts Policy. Please ensure that you read and understand our Full Disclaimer and Liability provision concerning the foregoing Information, which can be accessed here.