
Oil’s Geopolitical Rally Meets it’s Technical Wall


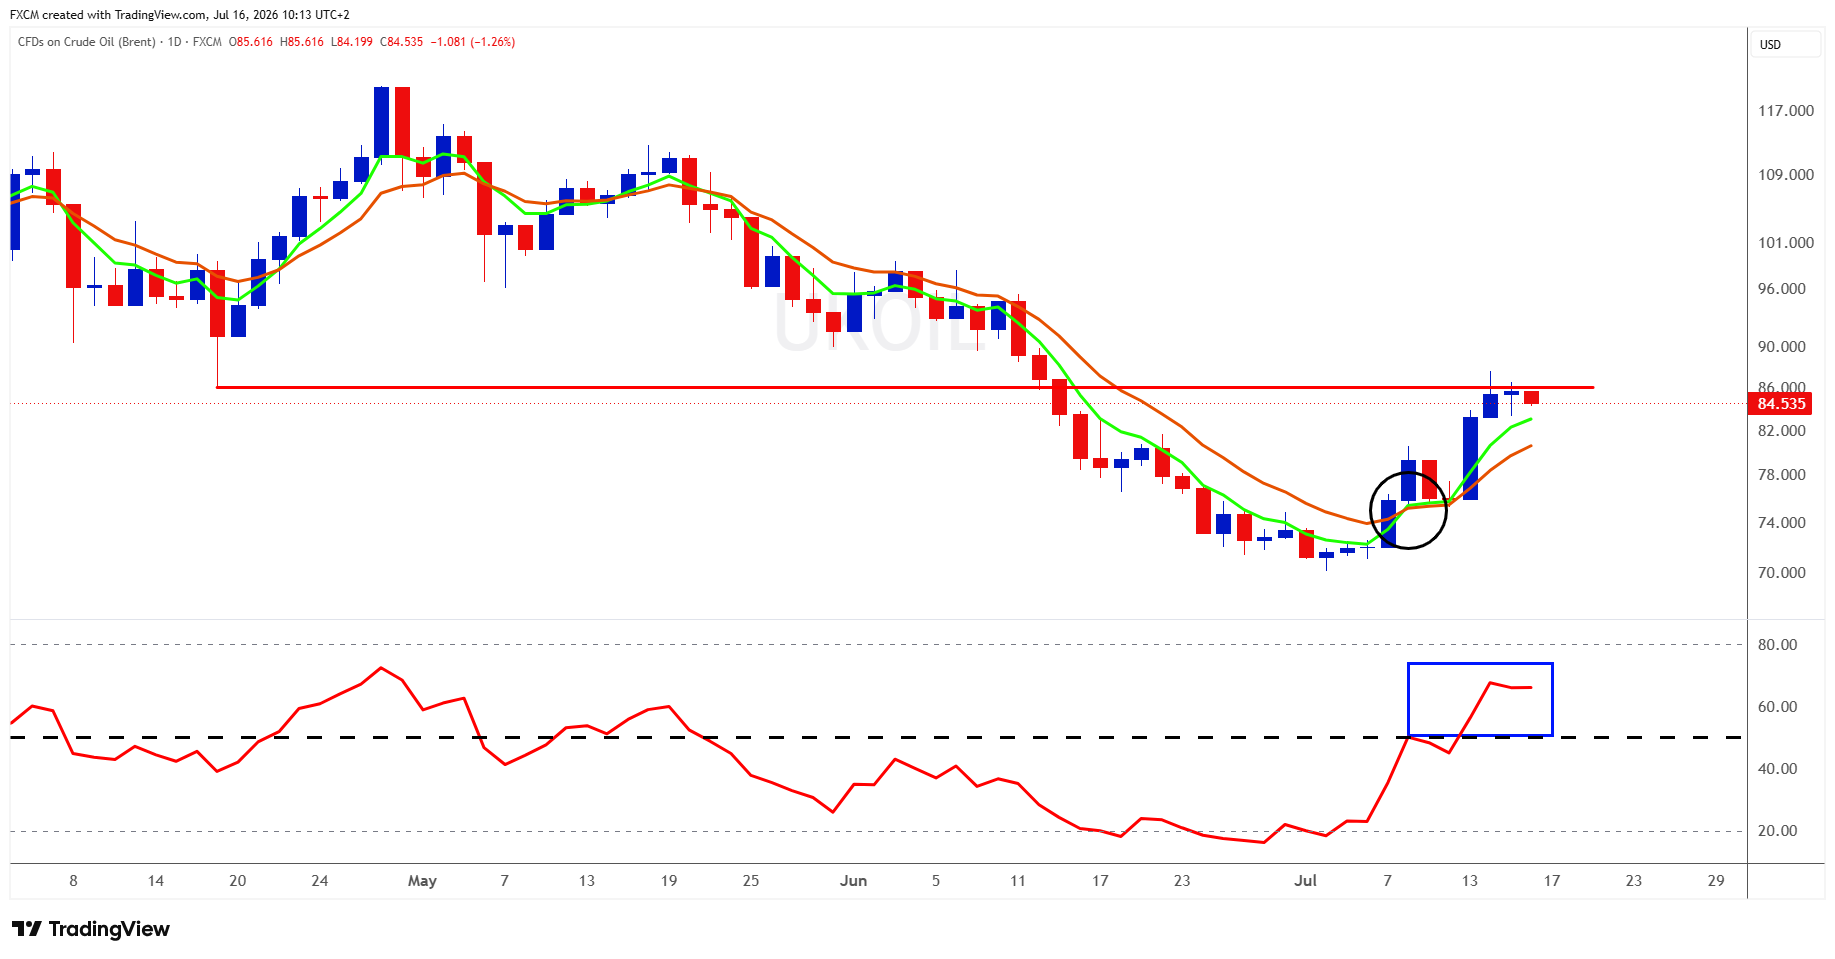
UKOil is once again being driven less by comfortable supply-and-demand arithmetic than by the possibility of something going badly wrong. The supplied daily chart captures that change in mood. UKOil has rebounded from roughly $70 in early July to $84.51, recovering above both short-term moving averages. The faster average has crossed above the slower one, while RSI has climbed from deeply oversold territory into the upper 60s. Momentum has plainly improved, but the rally has now reached a serious test.
The immediate obstacle is the $85.50-$86 area, which previously acted as support before June's breakdown and is now behaving as resistance. Thursday's still-forming candle shows price pushing into that zone and then slipping back. A decisive daily close above $86 would strengthen the bullish case and expose $90, followed by the broader $95-$96 region. Failure here would not automatically end the recovery, but it would make a pullback towards the rising short-term average near $82 more likely.
The United States has renewed strikes on Iran and reimposed its naval blockade, while Iran has retaliated and continued to threaten shipping through Hormuz. Vessel traffic has fallen, and UKOil was still near a one-month high despite Thursday's profit-taking. Before the war, roughly one-fifth of global oil trade and roughly one-fifth of global LNG trade passed through Hormuz.
The market is therefore trading two very different futures. In the first, attacks intensify, insurance and freight costs rise, and physical flows remain constrained. US commercial crude stocks recently fell to their lowest seasonal level since 2014, leaving less cushion than traders might normally expect. Tight refined-product markets add another layer of vulnerability: the IEA says refinery runs remain well below last year's levels, while product margins have risen sharply.
In the second future, diplomacy stabilises Hormuz and supply returns faster than demand. That would remove much of the geopolitical premium. The IEA reported that global supply rebounded by 4.1 million barrels a day in June, although output remained 9.4 million barrels below pre-war levels. The EIA expects inventory draws to slow during the third quarter, then reverse into builds of 2.7 million barrels a day in the fourth quarter. Its forecast has UKOil averaging about $70 in that quarter.
Demand is another source of disagreement. The IEA and EIA expect global consumption to contract in 2026, reflecting high prices, shortages and conflict-related demand destruction. OPEC is more constructive, forecasting growth of about 0.8 million barrels a day, led mainly by non-OECD economies. Seven OPEC+ countries have agreed to increase August production by 188,000 barrels a day, although additional barrels only matter if producers can ship them.
That leaves price unusually vulnerable to headlines where one shipping incident could trigger a breakout, while credible negotiations could unwind the rally just as quickly.
For now, the chart and fundamentals tell the same story: Brent has bullish momentum, but it is pressing into resistance while carrying a large and unstable geopolitical premium. Above $86, the market may begin pricing a more severe disruption. Below $82, attention is likely to swing back towards recovering supply and eventual oversupply. The next move will probably be decided in the Strait, not on the chart.
References
- bloomberg.com
- reuters.com
- iea.org
- eia.org
- publications.opec.org/
- opec.org

Russell Shor
Senior Market Strategist
Russell Shor is a Senior Market Strategist at FXCM, having been promoted to the role in 2025 in recognition of his depth of insight and consistent delivery of high-impact market analysis. He originally joined FXCM in October 2017 as a Senior Market Specialist.
Russell holds an Honours Degree in Economics from the University of South Africa, is a certified FMVA®, and a full member of the Society of Technical Analysts (UK). With over 20 years of experience in financial markets, his work is renowned for its clarity, precision, and strategic value across asset classes.

Any opinions, news, research, analyses, prices, other information, or links to third-party sites contained on this website are provided on an "as-is" basis, as general market commentary and do not constitute investment advice. The market commentary has not been prepared in accordance with legal requirements designed to promote the independence of investment research, and it is therefore not subject to any prohibition on dealing ahead of dissemination. Although this commentary is not produced by an independent source, FXCM takes all sufficient steps to eliminate or prevent any conflicts of interests arising out of the production and dissemination of this communication. The employees of FXCM commit to acting in the clients' best interests and represent their views without misleading, deceiving, or otherwise impairing the clients' ability to make informed investment decisions. For more information about the FXCM's internal organizational and administrative arrangements for the prevention of conflicts, please refer to the Firms' Managing Conflicts Policy. Please ensure that you read and understand our Full Disclaimer and Liability provision concerning the foregoing Information, which can be accessed here.