Market Threads – The Short End of the Yield Curve Is Still Influencing Financial Markets
.png)
Tracking important market threads across currencies, commodities, and indices.
- Is the worst over for oil? We break down the charts and the latest Strait of Hormuz developments shaping crude prices.
- Is the USDOLLAR preparing for its next breakout? Discover what the charts and the Fed are signalling.
- Why is gold struggling despite ongoing geopolitical tensions? We unpack the charts and the fundamentals.
- The SPX500 is knocking on the door of new highs, but will the bulls break through?
Cross Asset View
Rising 2-year US Treasury yields continue to dominate the cross-asset landscape, reflecting growing expectations that the Federal Reserve will maintain a hawkish stance, with markets now pricing a high probability of a 25-basis point rate increase in September.
Higher short-term yields have strengthened the USDOLLAR, pressured XAUUSD by increasing the opportunity cost of holding non-yielding assets, and kept financial conditions restrictive despite the resilience of equity markets.
At the same time, enthusiasm surrounding artificial intelligence and expectations for another solid earnings season continue to underpin the SPX500, while easing supply concerns following the reopening of shipping through the Strait of Hormuz have weighed on oil prices.
Together, these themes highlight a market increasingly driven by the balance between higher-for-longer interest rates and the ability of corporate earnings and AI-led investment to offset the headwinds created by tighter monetary policy.
Oil
Technical Analysis
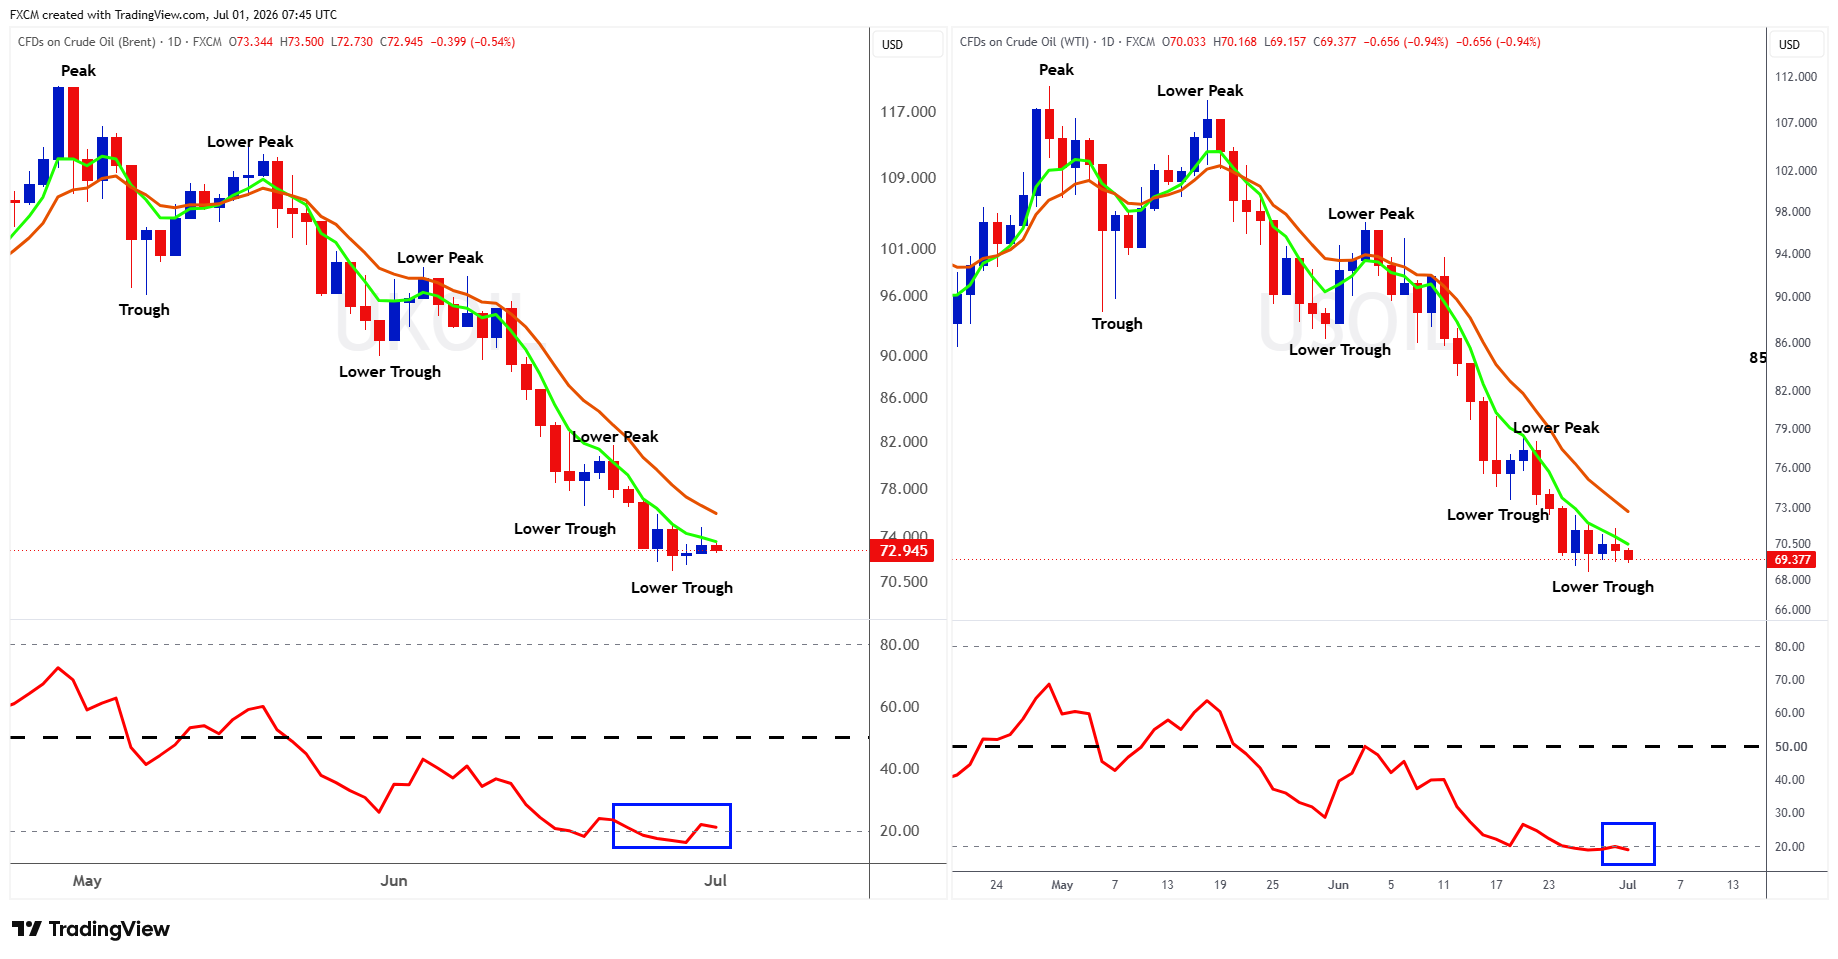
Both Brent (UKOil) and WTI (USOil) crude oil remain in well-established downtrends, with the technical picture continuing to be characterised by a sequence of lower peaks and lower troughs. Prices are still trading below both moving averages, while the shorter-term moving average remains beneath the longer-term average, confirming that sellers continue to control the broader trend. Although the bearish structure remains intact, the pace of the decline has slowed noticeably over the past week.
The biggest change since last week's analysis is that selling momentum has begun to ease. Instead of the large bearish candles seen during the sharp decline, both Brent and WTI are now producing much smaller candles, suggesting the aggressive selling pressure is fading. Brent has stabilised around the $73 per barrel level, while WTI has found temporary support near $69-70 per barrel, indicating that there may be support emerging around these levels.
Momentum indicators also point to a market that is becoming increasingly stretched. The RSI remains in oversold territory on both charts. While an oversold RSI does not guarantee a reversal, it often signals that downside momentum is weakening and that sellers are becoming exhausted.
Overall, the longer-term technical outlook remains bearish, with no evidence yet that the prevailing downtrend has reversed. However, the charts do suggest that downside momentum may be easing, reducing (but not eliminating) the chances of another sell-off. A sustained change in trend would require prices to break the sequence of lower peaks, reclaim the moving averages, and begin forming higher peaks and higher troughs. Until that occurs, any strength should be viewed as a pause within the broader downtrend rather than confirmation of a new bullish trend.
Fundamental Perspective
Oil prices remain under pressure as the market increasingly believes the worst of the supply shock from the Strait of Hormuz has passed. Although shipping through the Strait of Hormuz remains below pre-war levels and negotiations between the United States and Iran remain unresolved, tanker traffic has improved considerably from the height of the disruption, easing fears of a prolonged supply shock.
At the same time, OPEC+ is gradually restoring production while Middle Eastern exports continue to recover as shipping flows normalise. Softer Chinese crude demand has also weighed on sentiment, reinforcing expectations of a more balanced global oil market.
While the unresolved geopolitical situation continues to leave room for renewed volatility and maintains a modest risk premium in prices, improving supply conditions and softer demand expectations have shifted the fundamental backdrop back towards a more bearish outlook.
The USDOLLAR
Technical Analysis
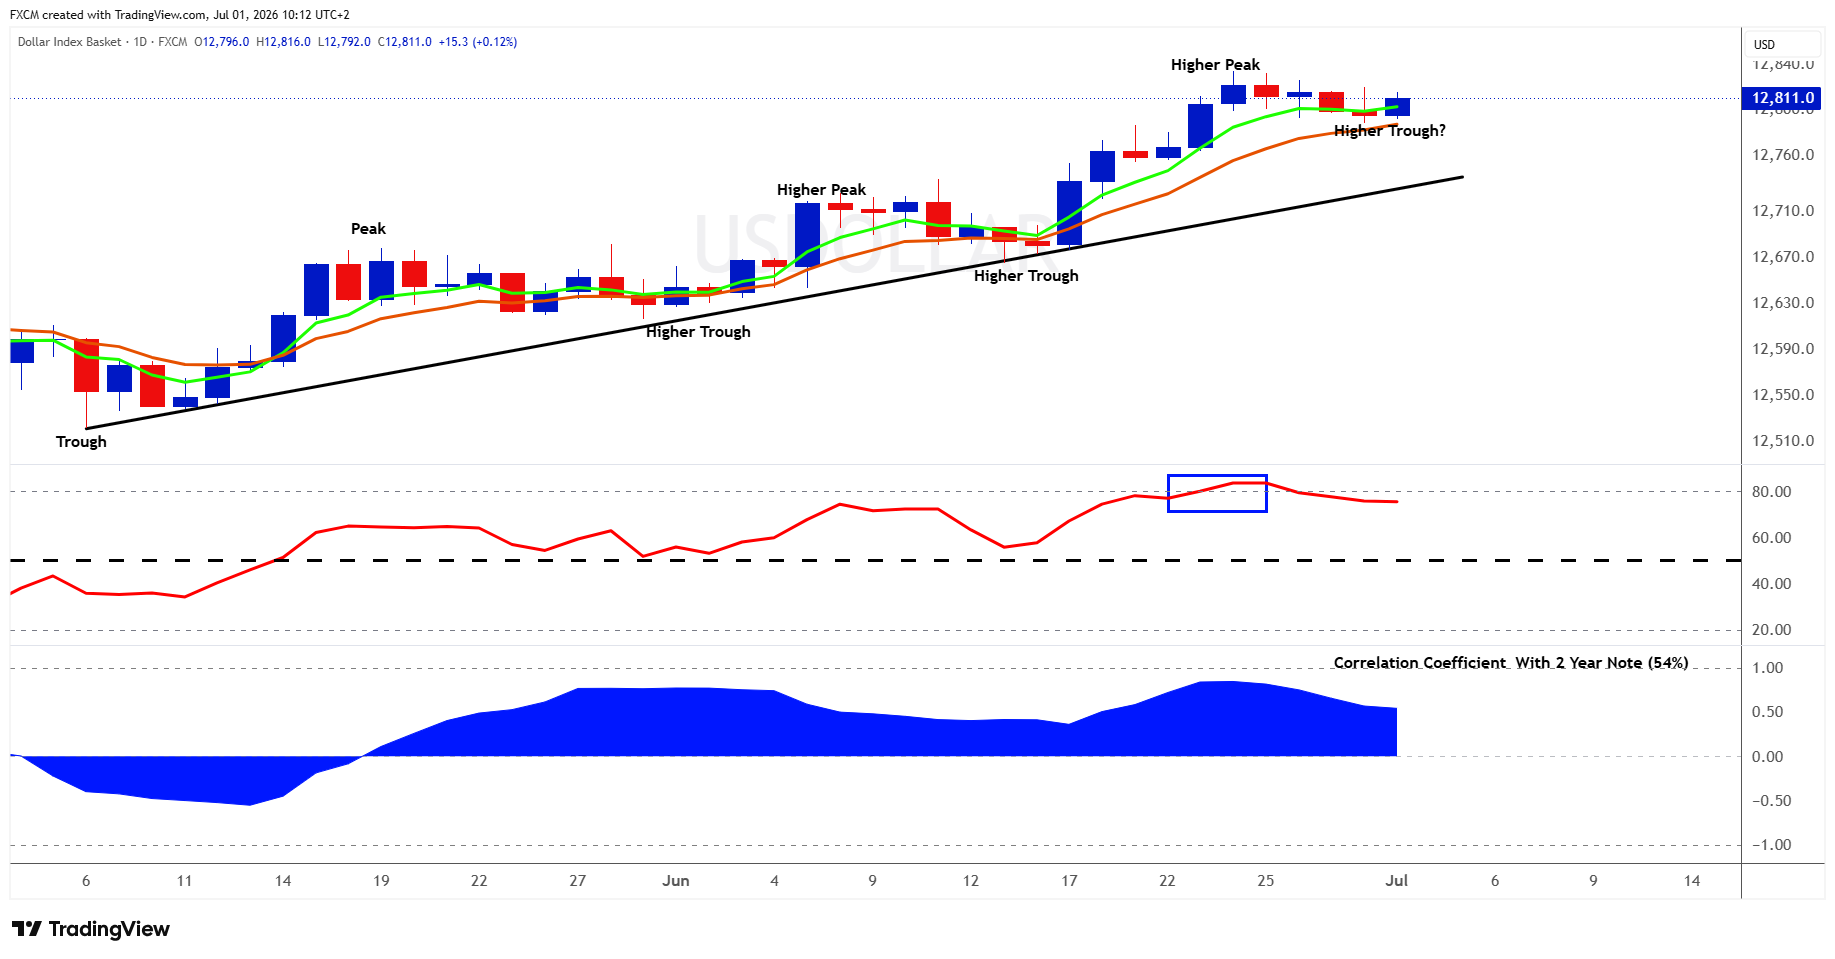
FXCM's USDOLLAR remains in a well-established uptrend, with the chart continuing to display a clear sequence of higher peaks and higher troughs. Price is trading comfortably above the long-term rising trendline, while both moving averages are sloping upwards. Importantly, the shorter-term moving average remains above the longer-term moving average, confirming that buyers continue to control the broader trend.
The biggest development over the past week has been a pause in upward momentum rather than a reversal. After rallying strongly to a fresh higher peak, price has entered a period of sideways consolidation, with several relatively small candles forming near the recent highs. This suggests that the market is digesting its recent gains rather than experiencing aggressive selling. Encouragingly for the bulls, price has so far held above the short-term moving average, and what is developing could become another higher trough, provided support continues to hold.
Momentum also remains constructive. The RSI recently pushed into overbought territory, reflecting the strength of the preceding rally. Since then, it has eased slightly but remains at elevated levels, indicating that bullish momentum has moderated, while remaining positive.
The correlation coefficient with the US 2-Year Treasury Note remains positive at around 54%, indicating that the relationship between the USDOLLAR and short-term Treasury yields remains supportive. This suggests that interest rate expectations continue to provide a favourable backdrop for the USDOLLAR.
Overall, the technical outlook remains bullish. The series of higher peaks and higher troughs is intact, price continues to trade above its key moving averages and rising trendline, and there is no evidence yet that buyers have lost control of the broader trend. The recent sideways movement appears to be a healthy consolidation following a strong advance. A deterioration in the outlook would require price to break below the developing higher trough, fall beneath the short-term moving average, and ultimately violate the long-term rising trendline. Until then, the path of least resistance remains to the upside.
Fundamental Perspective
The USDOLLAR continues to draw support from elevated Treasury yields, persistent inflation concerns, and expectations that the Federal Reserve will maintain a restrictive policy stance. Persistent inflation has increased expectations for another Fed rate hike in September, lifting short-dated Treasury yields, including the policy-sensitive 2-year Treasury note.
As the 2-year note closely reflects monetary policy expectations, its strength has reinforced the dollar's yield advantage over many major currencies. Investors are also awaiting key US labour market data for further clues on the Fed's next move, while recent comments from Federal Reserve officials have maintained a hawkish tone.
Although geopolitical uncertainty surrounding US-Iran negotiations continues to influence markets, the primary driver of the greenback remains the expectation that US interest rates will remain higher for longer than those of many other developed economies, providing ongoing fundamental support for the dollar.
A Word About the Yen
The Japanese yen remains under intense pressure, with USDJPY trading near its weakest level since 1986 despite repeated warnings from Tokyo that it stands ready to intervene if currency moves become excessive. While Japanese officials have argued that previous intervention was effective and continue to coordinate closely with their US counterparts, the market remains focused on the wide interest rate differential between the United States and Japan. As long as US Treasury yields remain elevated and the Federal Reserve maintains a hawkish policy stance, any intervention is likely to slow the yen's decline rather than reverse the broader trend. For a more detailed explanation of why intervention alone is unlikely to change the long-term direction of the yen, read our article: Why Japan Can Slow the Yen's Fall But Probably Can't Stop It.
Gold
Technical Analysis
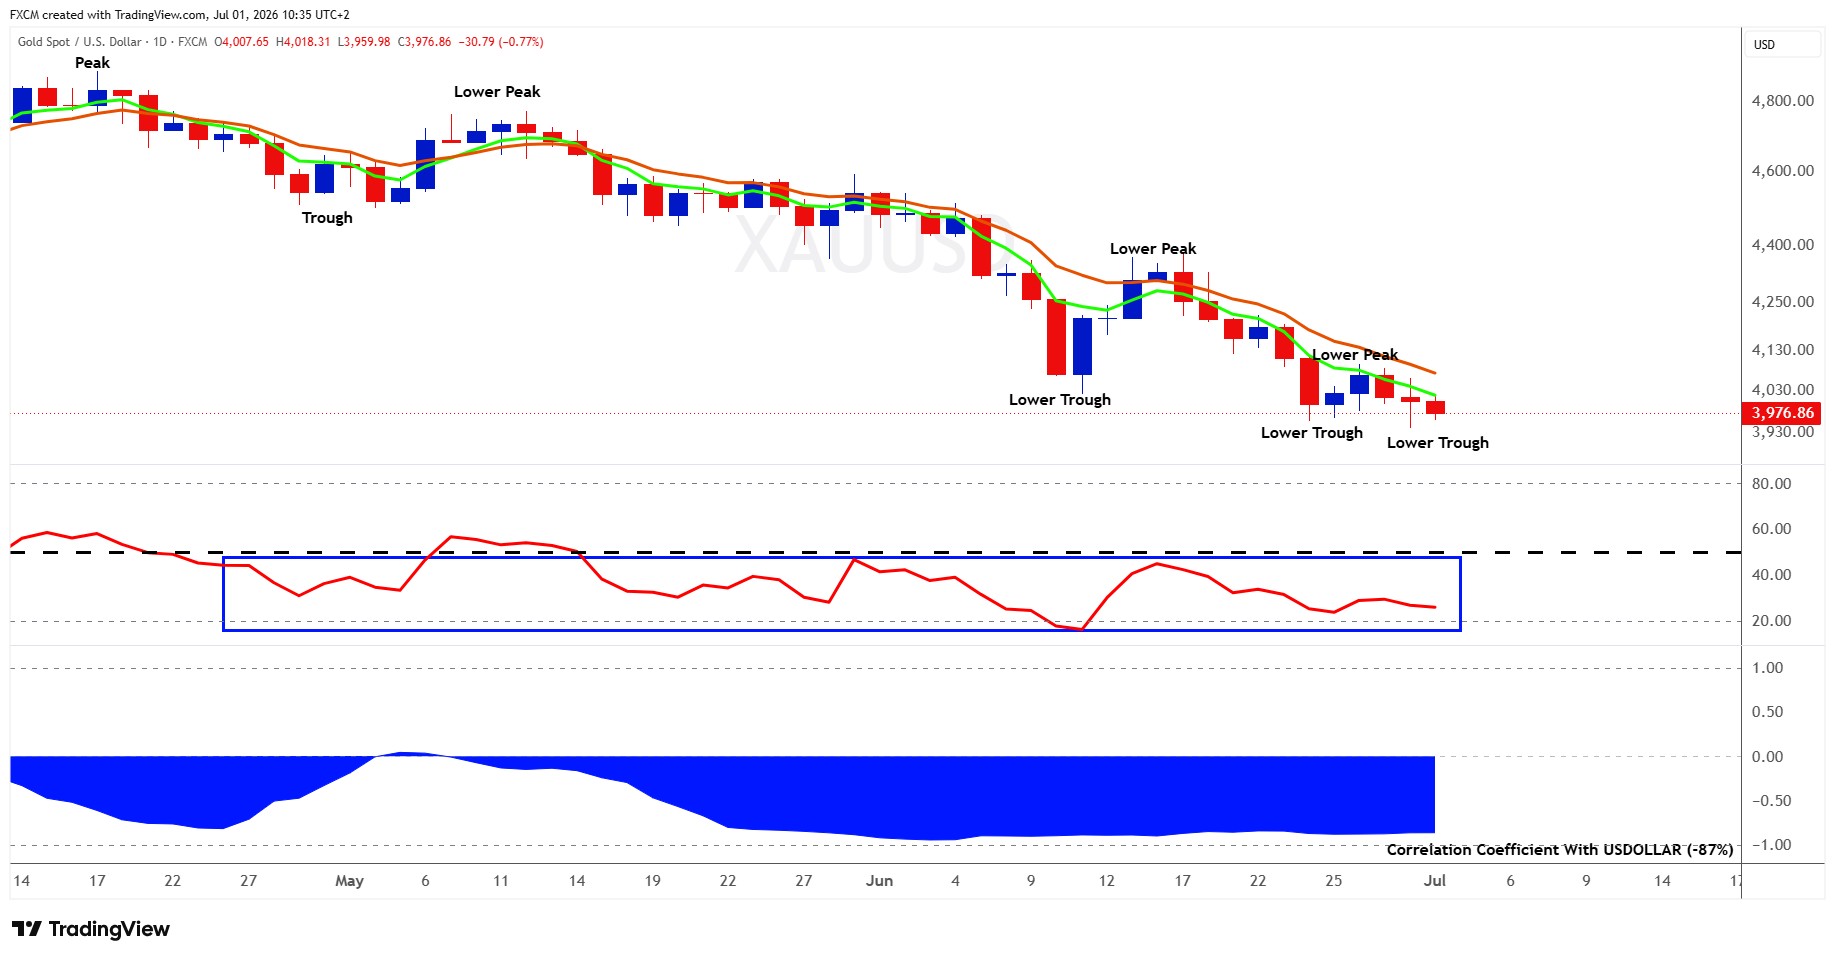
Gold remains in a well-established downtrend, with the chart continuing to display a clear sequence of lower peaks and lower troughs. Price is trading below both moving averages, while the shorter-term moving average remains beneath the longer-term moving average, confirming that sellers continue to control the broader trend. The moving averages are also sloping lower, reinforcing the bearish technical structure.
The biggest development over the past week has been the market's inability to produce any meaningful recovery. Following a brief rebound in mid-June, XAUUSD has resumed making fresh lower troughs, with only shallow rallies that have failed to break the sequence of lower peaks. The latest candles remain relatively short, suggesting that while aggressive selling has eased, buyers still lack the conviction needed to reverse the trend.
Momentum indicators continue to favour the bears. The RSI has spent an extended period in the lower half of its range, reflecting persistent downside momentum.
The correlation coefficient with the USDOLLAR remains strongly negative at approximately -87%, highlighting the inverse relationship between the two instruments. With the USDOLLAR remaining technically strong, that relationship continues to provide a headwind for gold prices, as a stronger USDOLLAR typically makes the precious metal more expensive for holders of other currencies.
Overall, the technical outlook remains bearish. The sequence of lower peaks and lower troughs remains firmly intact, price continues to trade below its key moving averages, and there is no evidence yet that the prevailing downtrend has reversed. A sustained improvement in the technical outlook would require XAUUSD to break the pattern of lower peaks, reclaim both moving averages, and begin forming higher peaks and higher troughs. Until then, any short-term strength should be viewed as a corrective bounce within the broader downtrend rather than confirmation of a new bullish trend.
Fundamental Perspective
Gold continues to face a challenging fundamental backdrop as persistent inflation and expectations of tighter Federal Reserve policy support both the USDOLLAR and Treasury yields. Sticky inflation has increased market expectations of another Fed rate hike in September, lifting short-dated Treasury yields, including the policy-sensitive 2-year Treasury note.
As short-term yields rise, the USDOLLAR strengthens by offering investors relatively more attractive returns than many other major currencies. A stronger USDOLLAR, in turn, places downward pressure on XAUUSD because the precious metal is priced in dollars, making it more expensive for holders of other currencies and reducing global demand.
Higher Treasury yields also increase the opportunity cost of holding gold, as bullion generates no income or interest, encouraging investors to favour yield-bearing assets instead. While ongoing geopolitical uncertainty surrounding US-Iran negotiations and the Strait of Hormuz continues to provide some safe-haven support, it has been insufficient to offset the combined headwinds of a firmer dollar, rising short-term yields, and growing expectations that US interest rates will remain higher for longer.
Index in Focus: SPX500
Technical Analysis
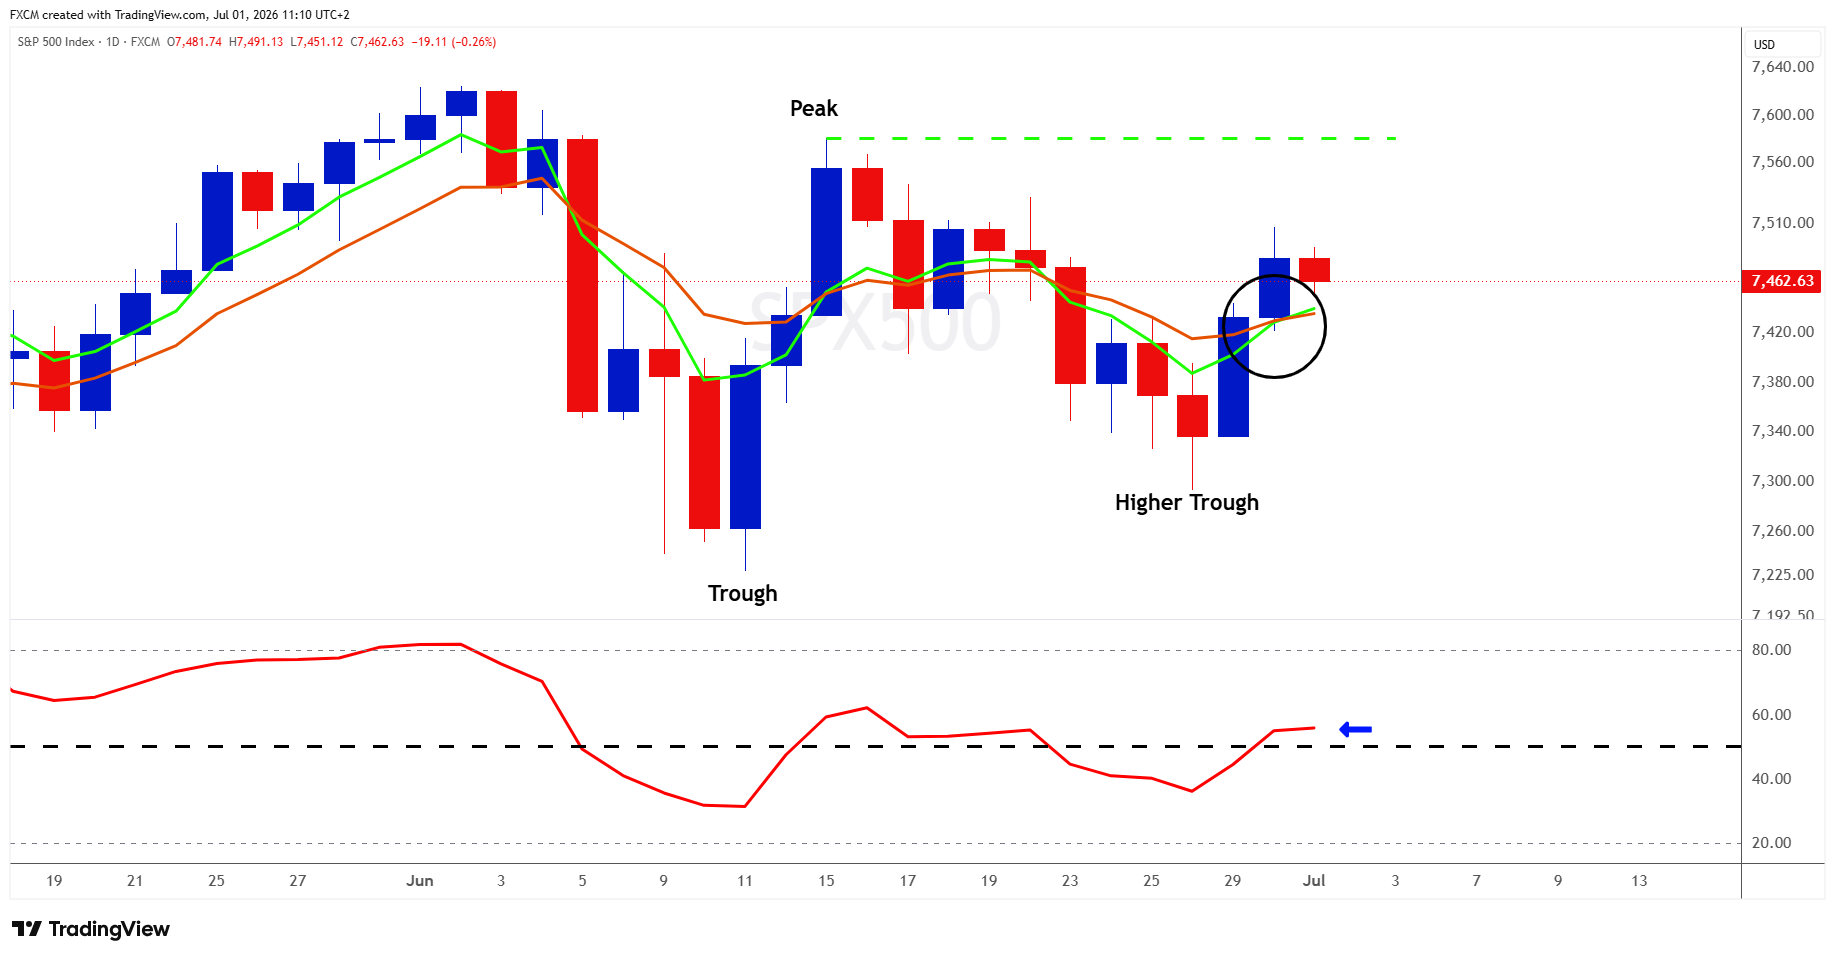
The SPX500 has moved into bullish mode, and the broader structure remains constructive, with the market recently establishing a higher trough, suggesting buyers continue to step in on pullbacks. While the index has not yet produced a new higher peak, the higher trough is an encouraging sign that the longer-term bullish trend remains intact.
The biggest development over the past week has been the strength of the rebound from the late-June pullback. Buyers successfully defended the higher trough and pushed the index back above both moving averages, with the shorter-term moving average now beginning to turn higher and crossing back above the longer-term moving average. This improvement in trend structure suggests bullish momentum is rebuilding, although the index is now approaching an important area of resistance just below the previous peak.
Momentum indicators are also improving. The RSI has climbed back above the 50 level after recovering from weaker readings during the recent correction. An RSI holding above 50 generally suggests that bullish momentum is returning, leaving room for further upside should buyers remain in control.
Overall, the technical outlook remains constructively bullish. The formation of a higher trough, improving momentum, and price reclaiming both moving averages all point towards a market attempting to resume its broader upward trend. However, the previous peak remains the key technical hurdle. A decisive break above that resistance would confirm the next leg higher, while a failure to hold above the recent higher trough and the short-term moving average would weaken the bullish outlook and increase the risk of a deeper correction. Until then, the balance of evidence continues to favour the bulls.
Fundamental Perspective
The SPX500 continues to be supported by resilient corporate earnings and ongoing enthusiasm surrounding artificial intelligence, but the outlook is becoming increasingly dependent on inflation and Federal Reserve policy. Persistent inflation has strengthened expectations that the Fed could raise interest rates in September, lifting short-dated Treasury yields, including the policy-sensitive 2-year Treasury note, which is widely regarded as reflecting monetary policy expectations.
Higher yields increase borrowing costs for households and businesses, raising debt-servicing expenses and potentially reducing discretionary consumer spending, which can weigh on corporate revenues and profit margins over time. They also increase the discount rate used to value future corporate earnings, making richly valued growth stocks less attractive.
Despite these headwinds, investors remain optimistic that continued AI infrastructure investment and another strong earnings season, particularly from large-cap technology and semiconductor companies, will support earnings growth and underpin the broader market. As a result, the SPX500 is currently balancing the positive momentum from AI-driven earnings against the potential drag of higher-for-longer interest rates and tighter financial conditions.
Russell Shor
Senior Market Strategist
Russell Shor is a Senior Market Strategist at FXCM, having been promoted to the role in 2025 in recognition of his depth of insight and consistent delivery of high-impact market analysis. He originally joined FXCM in October 2017 as a Senior Market Specialist.
Russell holds an Honours Degree in Economics from the University of South Africa, is a certified FMVA®, and a full member of the Society of Technical Analysts (UK). With over 20 years of experience in financial markets, his work is renowned for its clarity, precision, and strategic value across asset classes.
Any opinions, news, research, analyses, prices, other information, or links to third-party sites contained on this website are provided on an "as-is" basis, as general market commentary and do not constitute investment advice. The market commentary has not been prepared in accordance with legal requirements designed to promote the independence of investment research, and it is therefore not subject to any prohibition on dealing ahead of dissemination. Although this commentary is not produced by an independent source, FXCM takes all sufficient steps to eliminate or prevent any conflicts of interests arising out of the production and dissemination of this communication. The employees of FXCM commit to acting in the clients' best interests and represent their views without misleading, deceiving, or otherwise impairing the clients' ability to make informed investment decisions. For more information about the FXCM's internal organizational and administrative arrangements for the prevention of conflicts, please refer to the Firms' Managing Conflicts Policy. Please ensure that you read and understand our Full Disclaimer and Liability provision concerning the foregoing Information, which can be accessed here.