Market Threads: Oil Jumps Higher
.png)
Tracking important market threads across currencies, commodities, and indices.
- Oil is on the brink: bullish momentum meets geopolitical tension, watch the key $120/barrel level.
- USDOLLAR at a turning point: oil, the Fed, and geopolitics are about to decide the next move.
- Gold under pressure: rising oil and fading momentum are setting up the next move.
- UK100 under pressure as oil-driven inflation bites, are markets bracing for deeper downside?
Cross-Asset View
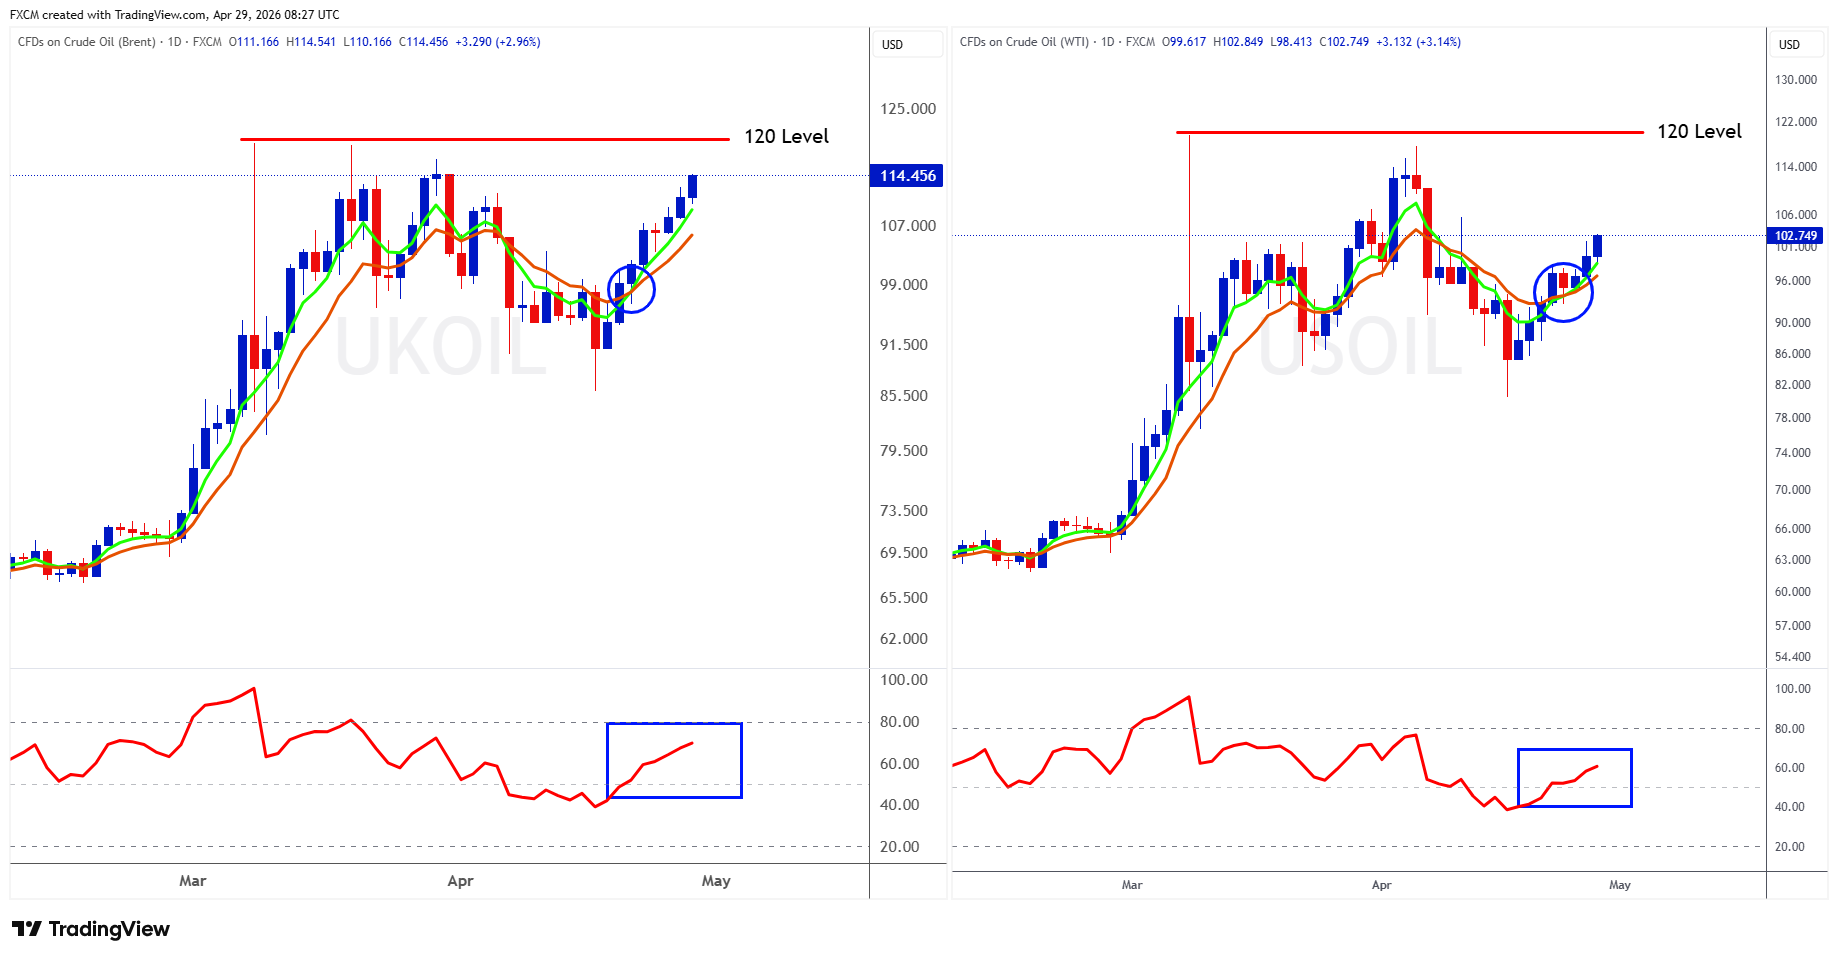
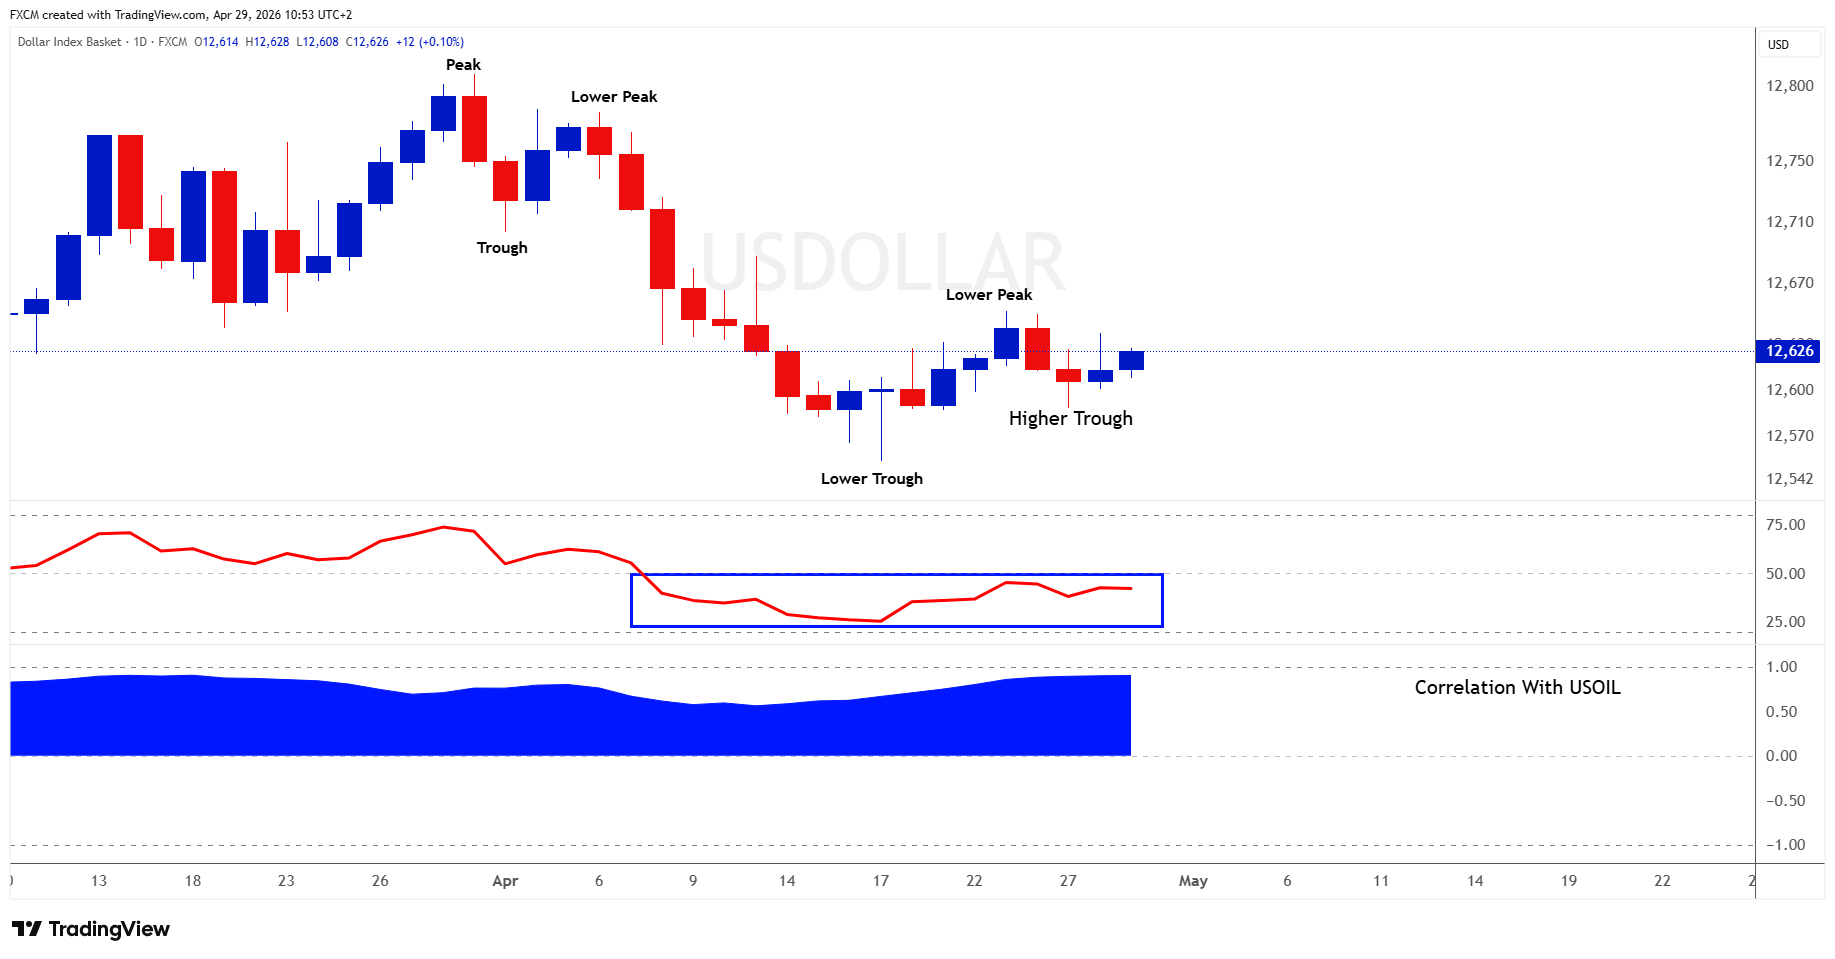
Oil has pushed higher, with UKOil around $114 and USOil near $102.50. This has offered some support to FXCM's USDOLLAR. As a result, gold has come under pressure, slipping back towards the $4,500 level. Of note, the correlation between UKOil and the dollar has softened slightly, while the USOil–dollar relationship remains strong at around 85%. This reinforces the view that currently USOil remains the more relevant benchmark for USDOLLAR analysis.
Oil
Technical Analysis
The left chart shows FXCM's UKOil, while the right displays USOil. In both cases, the EMAs have crossed higher and are aligned in a bullish structure. RSI readings are holding above 50, providing support to price action.
As long as RSI remains above this level, the bias for further upside stays intact. The key level to watch is 120 on both charts; a decisive break above it would signal a move to new highs in this cycle.
Fundamental Perspective
Oil prices are edging higher as markets weigh the risk of a prolonged United States–Iran conflict, including potential disruption to the Strait of Hormuz, against shifting supply dynamics following the United Arab Emirates exit from OPEC. While the UAE's move could lift output over time, near-term supply remains tight, leaving geopolitics as the dominant pricing force. Comments from President Trump have reinforced the sense that tensions remain unresolved, keeping a risk premium embedded in crude. Until there is clarity on both supply flows and political direction, oil is likely to trade in a fragile balance between disruption risk and future production increases.
The USDOLLAR
Technical Analysis
USDOLLAR is presenting a more nuanced technical picture. The trend has stalled, with price forming a lower peak followed by a higher trough, suggesting a period of consolidation and the potential development of a short-term pattern. This phase warrants close monitoring.
RSI remains below 50, keeping the near-term bias tilted to the downside. However, the correlation with USOIL remains notably strong, indicating that the dollar's direction is still largely tied to moves in oil.
If USOil continues towards the key 120 level, it is likely to pull the dollar higher and lift RSI in tandem. Conversely, if USOil begins to roll over, that weakness would likely feed through into the dollar as well.
Fundametal Perspective
The USDOLLAR is being driven by the interaction between Fed expectations, oil, and geopolitics. The Fed is widely expected to hold rates steady, shifting the focus to guidance rather than the decision itself.
At the same time, the Iran conflict remains the key macro driver. Oil has surged toward the $110–$115 range amid ongoing disruption risks around the Strait of Hormuz, reinforcing inflation pressures. This keeps rate cuts pushed out and supports yields, providing a structural tailwind for the dollar.
However, the setup is not one-directional. While the dollar is supported by higher-for-longer expectations and safe-haven demand, elevated oil prices also raise growth risks, which can cap upside (stagflation).
Ultimately, direction hinges on the Fed. A hawkish tone that acknowledges persistent oil-driven inflation should support the greenback and reinforce its link with USOil. A more cautious tone would weaken that relationship, leaving the dollar range-bound in the near term.
Some Currencies to Keep an Eye On
Last week we focused on EUR/USD, GBP/USD, AUD/USD and NZD/USD, and that framing still holds. These pairs remain largely a function of the broader USDOLLAR, which is currently consolidating rather than trending. Without a clear dollar direction, conviction across the majors is thin, so for now the more sensible stance is to stay patient and wait for a cleaner setup.
Fundamentally, little has changed. Fed expectations continue to anchor the narrative, with markets focused more on guidance than the decision itself in a higher-for-longer environment. At the same time, firm oil prices, driven by tensions around the Strait of Hormuz, are keeping inflation risks elevated and supporting yields. That combination leaves the dollar supported but not decisive, keeping these pairs broadly range-bound.
Gold
Technical Analysis
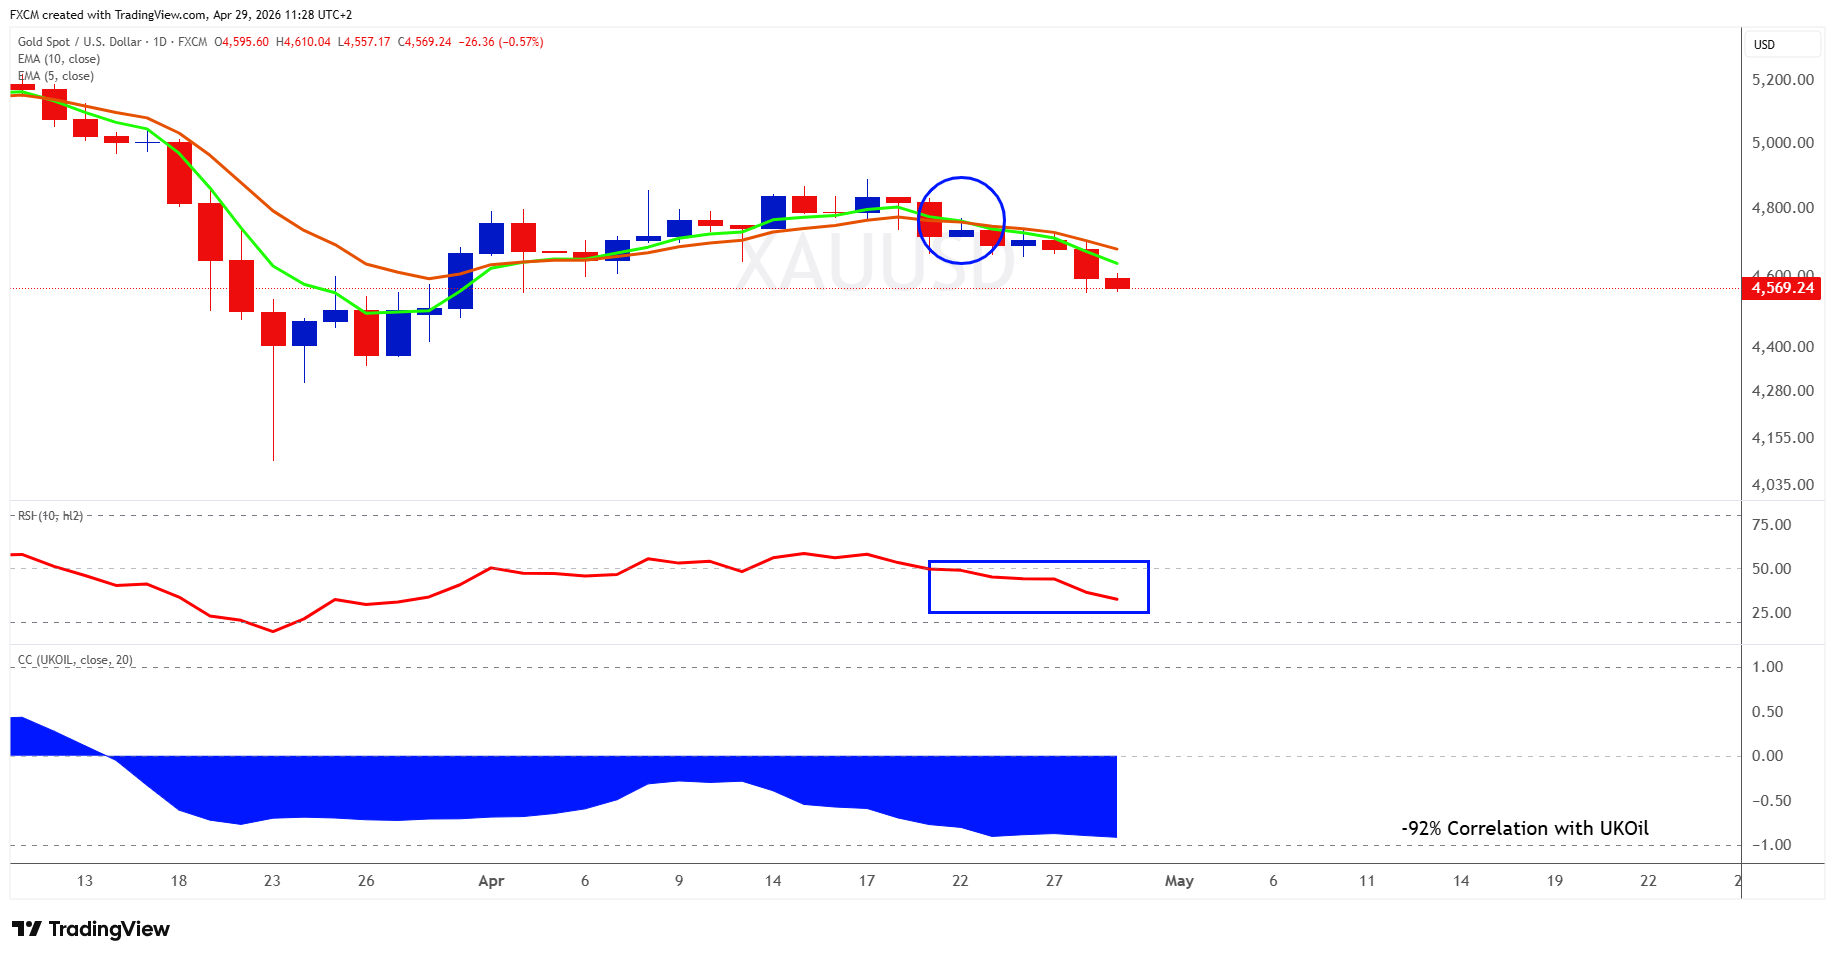
Last week, we noted that gold's momentum was fading, and that weakness has carried into this week. The EMAs have now crossed lower, forming a bearish structure.
RSI has also slipped firmly below 50, signalling negative momentum. If it holds below this level, the bias remains to the downside, which is likely to keep pressure on gold prices.
Fundamental Perspective
Gold is currently being driven by developments in the oil market, particularly UKOil. The correlation has strengthened to around -92%, indicating a very tight inverse relationship. As a result, oil's strong week has translated into a weak one for gold.
The mechanism is straightforward: higher oil prices push inflation higher, which raises the likelihood of tighter policy and elevated yields. This, in turn, makes interest-bearing assets more attractive relative to gold, which offers no yield, putting downward pressure on prices.
Index in Focus: UK100
Technical Analysis
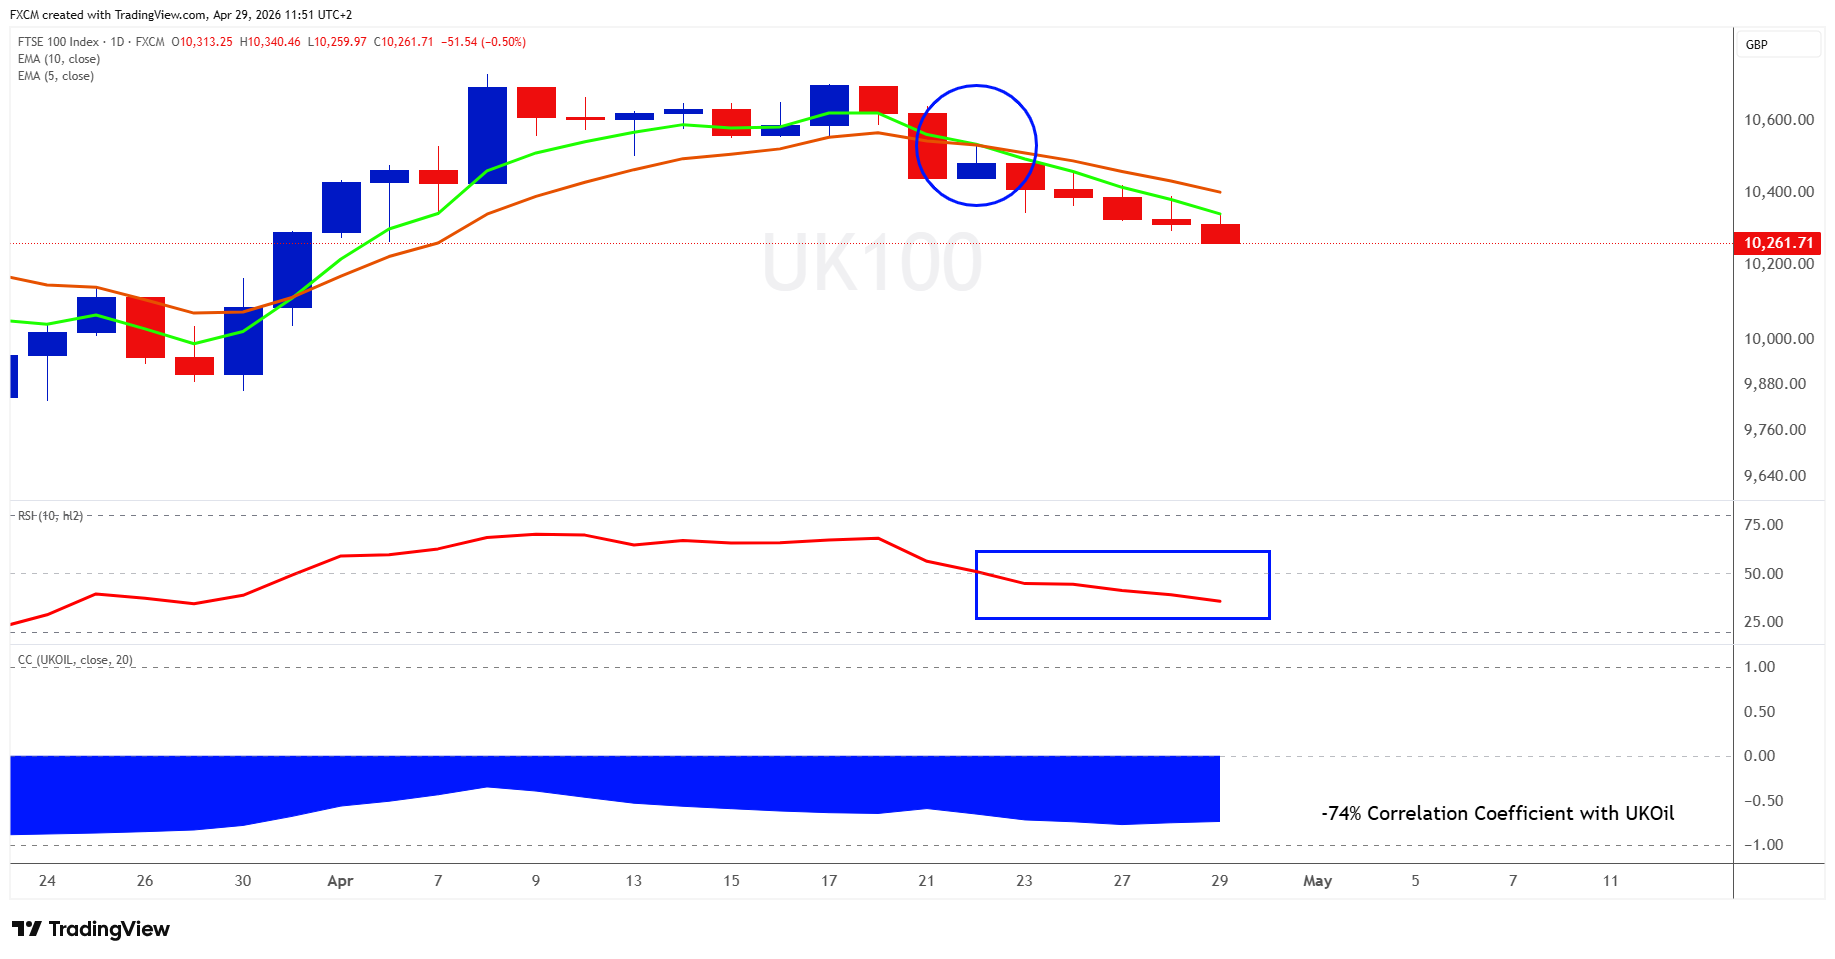
The UK100 is also showing bearish signals. Its EMAs have crossed lower, forming a negative structure, while the RSI has moved below 50, indicating downside momentum. The longer it holds below this level, the more pressure is likely to build on the index.
Fundamental Perspective
Of interest, the UK100 shows a -74% correlation coefficient with UKOil. Here, oil is best understood as a macro shock, not a sector driver. The recent rise in UKOil is driven by geopolitical supply risk, not stronger demand, which makes it a negative shock that lifts costs while weakening growth.
For the UK, this feeds quickly into inflation and pushes bond yields higher, now over 5%, tightening financial conditions and weighing on equities. Recent market moves confirm this: UK100 weakness has coincided with rising oil and inflation concerns, while periods of falling oil have supported rallies.
At the index level, energy stocks benefit, but they are outweighed by declines in banks, airlines, and consumer sectors as higher fuel costs and weaker demand hit earnings.
The result is a regime where higher oil signals inflation, tighter policy, and slower growth, which dominate any positive impact from energy stocks and drive the UK100 lower.
Russell Shor
Senior Market Strategist
Russell Shor is a Senior Market Strategist at FXCM, having been promoted to the role in 2025 in recognition of his depth of insight and consistent delivery of high-impact market analysis. He originally joined FXCM in October 2017 as a Senior Market Specialist.
Russell holds an Honours Degree in Economics from the University of South Africa, is a certified FMVA®, and a full member of the Society of Technical Analysts (UK). With over 20 years of experience in financial markets, his work is renowned for its clarity, precision, and strategic value across asset classes.
Any opinions, news, research, analyses, prices, other information, or links to third-party sites contained on this website are provided on an "as-is" basis, as general market commentary and do not constitute investment advice. The market commentary has not been prepared in accordance with legal requirements designed to promote the independence of investment research, and it is therefore not subject to any prohibition on dealing ahead of dissemination. Although this commentary is not produced by an independent source, FXCM takes all sufficient steps to eliminate or prevent any conflicts of interests arising out of the production and dissemination of this communication. The employees of FXCM commit to acting in the clients' best interests and represent their views without misleading, deceiving, or otherwise impairing the clients' ability to make informed investment decisions. For more information about the FXCM's internal organizational and administrative arrangements for the prevention of conflicts, please refer to the Firms' Managing Conflicts Policy. Please ensure that you read and understand our Full Disclaimer and Liability provision concerning the foregoing Information, which can be accessed here.