
Market Threads – Markets Balance Geopolitical Optimism Against Fed Tightening

.png)
Tracking important market threads across currencies, commodities, and indices.
- UKOil and USOil face mounting technical pressure as hopes of a US-Iran breakthrough weigh on prices.
- USDOLLAR's bullish breakout gains momentum as Fed tightening fuels the recovery.
- XAUUSD faces mounting pressure as Fed tightening and a stronger dollar threaten key support at $4,280.
- JPN225 breaks higher as AI enthusiasm, a weaker yen and falling oil prices fuel the recovery.
Cross-Asset View
Markets are navigating a delicate balance between easing geopolitical tensions and tighter monetary policy. Hopes of a US-Iran diplomatic breakthrough are weighing on UKOil and USOil, potentially easing inflation pressures, while the Fed's hawkish stance continues to support USDOLLAR and challenge XAUUSD. Equities, meanwhile, are drawing strength from renewed enthusiasm for AI and semiconductor demand, with lower oil prices offering additional relief. The question now is whether improving supply conditions can ease inflation and temper interest rate expectations without renewed geopolitical tensions disrupting the recovery.
Oil
Technical Analysis
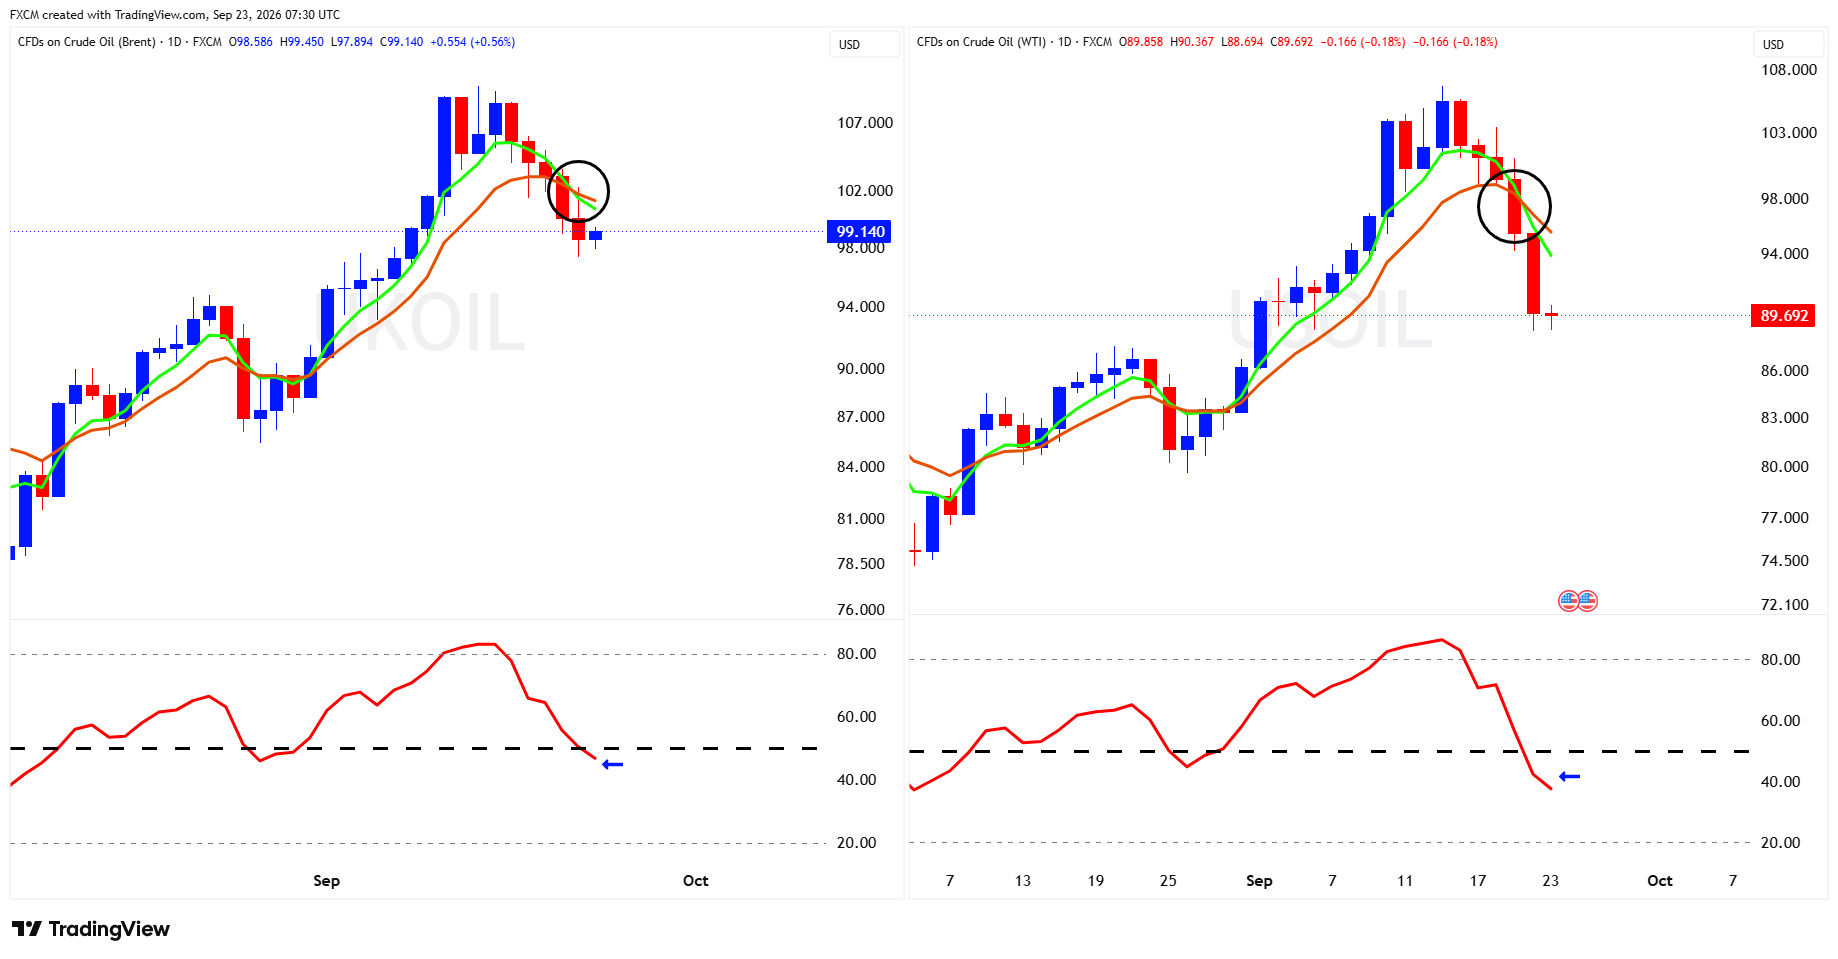
UKOil has come under increasing technical pressure, with a bearish EMA crossover and the RSI slipping below 50 signalling a loss of upward momentum. The longer the RSI remains below this threshold, the greater the risk that selling pressure intensifies. Importantly, the broader pattern of rising peaks and troughs remains intact, but sustained weakness could threaten this structure. Conversely, an RSI recovery above 50 would strengthen the case for the latest pullback establishing a higher trough, keeping the broader uptrend alive.
USOil faces a more pronounced technical deterioration, with a bearish EMA crossover accompanied by a sharp decline in the RSI below 50. Continued weakness beneath this threshold would increase the likelihood of further selling and put the existing sequence of higher peaks and troughs at risk. For now, that broader bullish structure has not been decisively broken. A recovery in the RSI above 50, however, would suggest that downside momentum is fading and strengthen the prospect of a higher trough forming, potentially laying the groundwork for renewed upside.
Fundamental Perspective
Fundamentals are adding to the pressure on UKOil and USOil as hopes of a diplomatic breakthrough between Washington and Tehran brighten the outlook for crude supplies. President Trump has described recent discussions as productive, while an Iranian official has indicated that shipping through the Strait of Hormuz could resume within a week, provided the US reduces military pressure and ends its blockade of Iranian ports. Saudi Arabia's partial restart of its East-West pipeline has offered further relief, although a full recovery could take several weeks. But there is still plenty that could go wrong. Trump has warned of further military action if negotiations fail, and, despite signs of recovering crude flows, shipping through Hormuz remains heavily constrained. For now, the prospect of peace is weighing on oil prices, but until an agreement is secured, the market remains exposed to another bout of geopolitical turbulence.
USDOLLAR
Technical Analysis
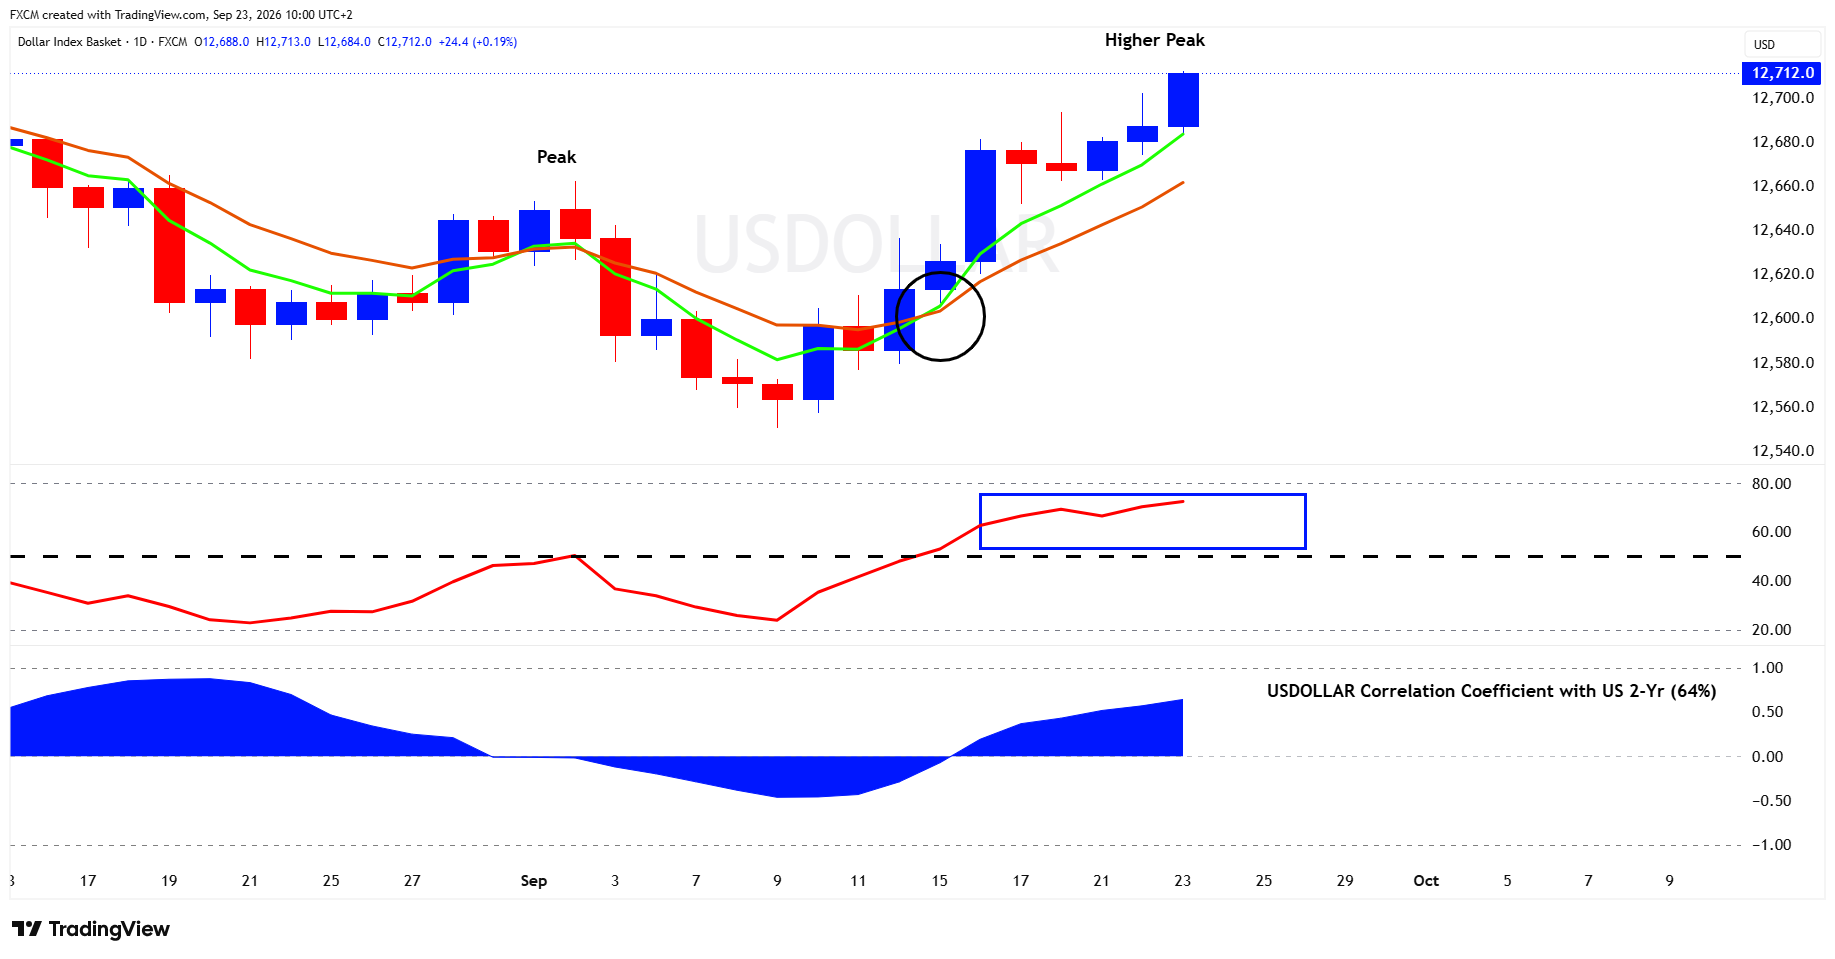
USDOLLAR has broken its previous downtrend, charting a higher peak and signalling a bullish shift in market structure. A positive EMA crossover, with both averages now rising, reinforces the recovery, while the RSI, holding comfortably above 50, points to strengthening underlying momentum. The dollar's positive correlation with the US two-year Treasury yield has also increased to 64%, suggesting that interest rate expectations are once again influencing its direction. The next technical milestone is the formation of a higher trough, which would further confirm the emerging uptrend. For now, the combination of improving price structure, bullish EMA alignment and firm RSI momentum suggests that buyers remain in control.
Fundamental Perspective
USDOLLAR's recovery is finding support in the Fed's increasingly hawkish stance, with last week's 25-basis-point rate hike to 3.75%–4.00% and the prospect of further tightening underpinning the dollar's interest rate appeal. The Middle East conflict has added to inflation concerns through higher energy prices, keeping pressure on the Fed to maintain a restrictive policy stance. But there is a potential turning point. Hopes of a diplomatic breakthrough between Washington and Tehran have sent oil prices lower, raising the prospect of easing inflation pressures and a less aggressive interest rate outlook. For now, expectations of further tightening remain an important source of dollar support. With markets already pricing in additional rate increases, however, incoming inflation data and the direction of US Treasury yields will be crucial in determining whether USDOLLAR can sustain its recovery.
Gold
Technical Analysis
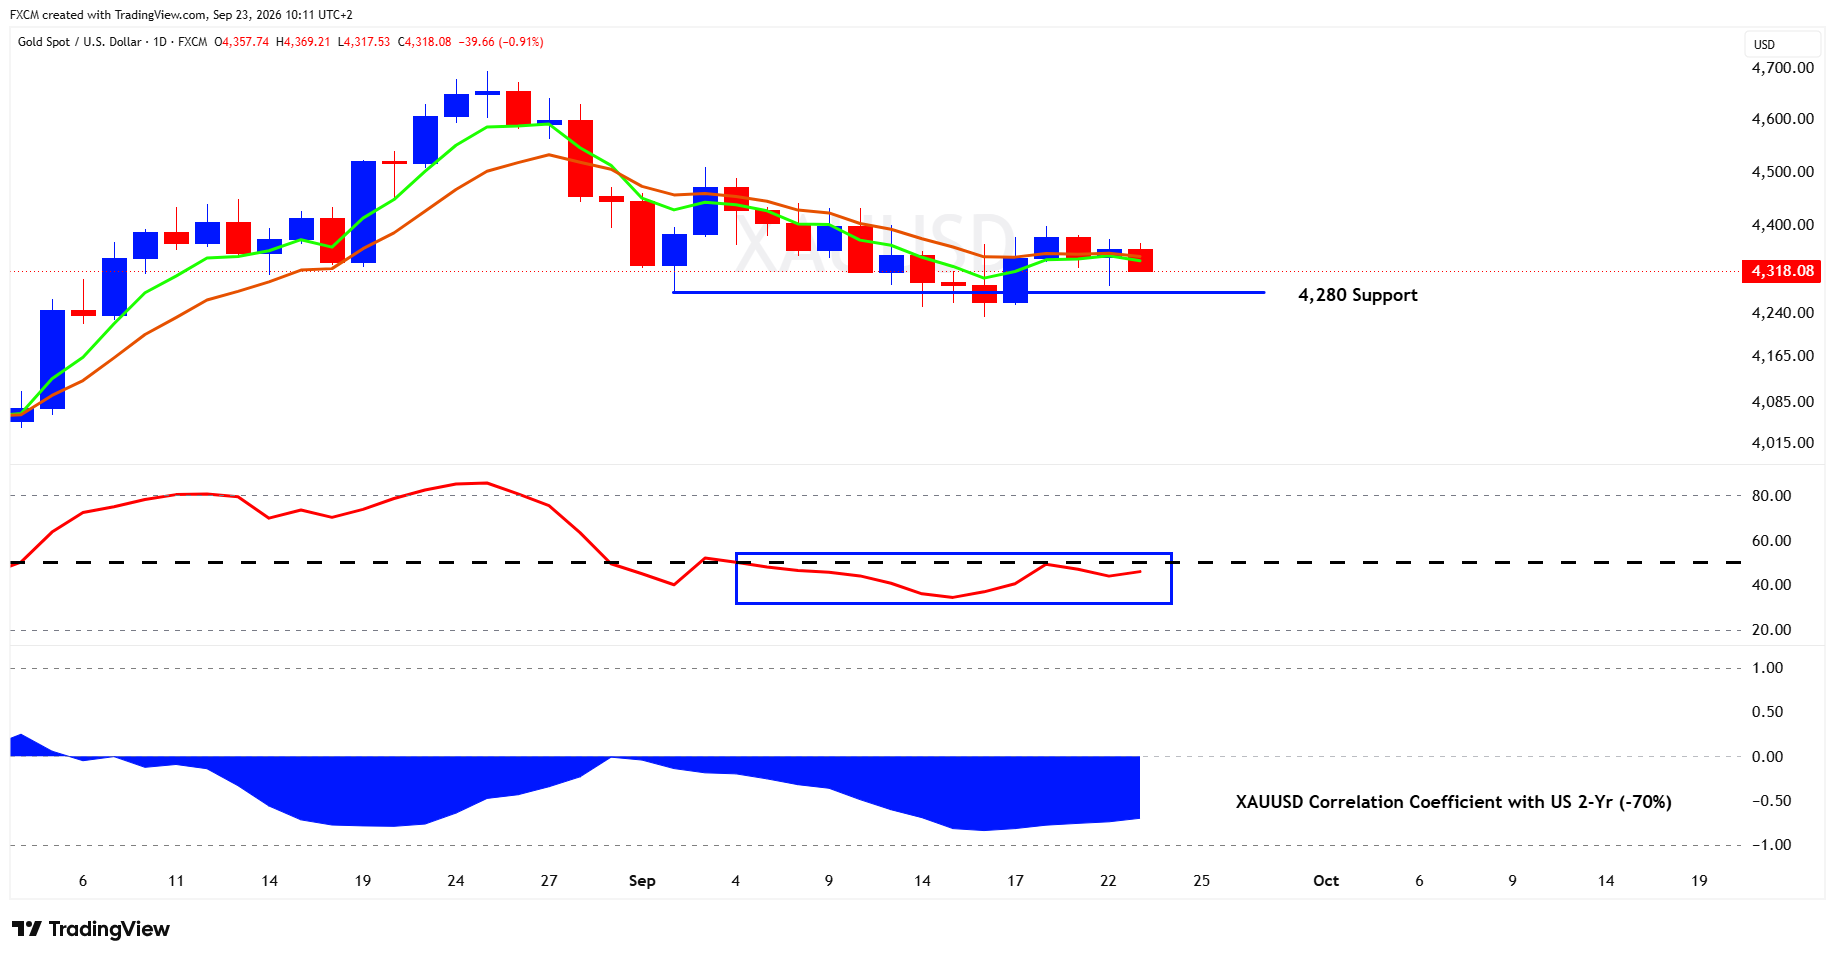
XAUUSD is at a critical technical juncture, with the $4,280 support level emerging as the line in the sand for gold's broader bullish structure. Price action remains subdued, with the EMAs flattening and converging as the market struggles to regain upward momentum. The RSI is hovering just below 50, reflecting a near-neutral reading with a slight bearish bias. A sustained break below $4,280 would confirm a lower trough and strengthen the case for further downside, while a recovery above the EMAs, accompanied by an RSI move above 50, would improve the outlook and raise the prospect of renewed upside. Adding to the pressure, gold's correlation with the US two-year Treasury yield stands at -70%, highlighting its sensitivity to interest rate expectations. With yields and the dollar strengthening, the $4,280 level could prove decisive in determining gold's next move.
Fundamental Perspective
XAUUSD is struggling against a more hawkish Fed, with last week's rate increase and the prospect of further tightening supporting the dollar and keeping pressure on the non-yielding metal. The Middle East conflict has added to inflation concerns through higher energy prices, reinforcing the case for restrictive monetary policy. But there is a new twist. Hopes of a diplomatic breakthrough between Washington and Tehran have helped pull oil prices lower, potentially easing inflation pressures and taking some of the heat out of interest rate expectations. A lasting agreement remains uncertain, however, and renewed tensions could revive gold's safe-haven appeal. For now, the dollar and US Treasury yields remain central to gold's next move. Further strength in either could put the $4,280 support level under pressure, while a sustained retreat would give gold a better chance of regaining its footing.
Index in Focus: JPN225
Technical Analysis
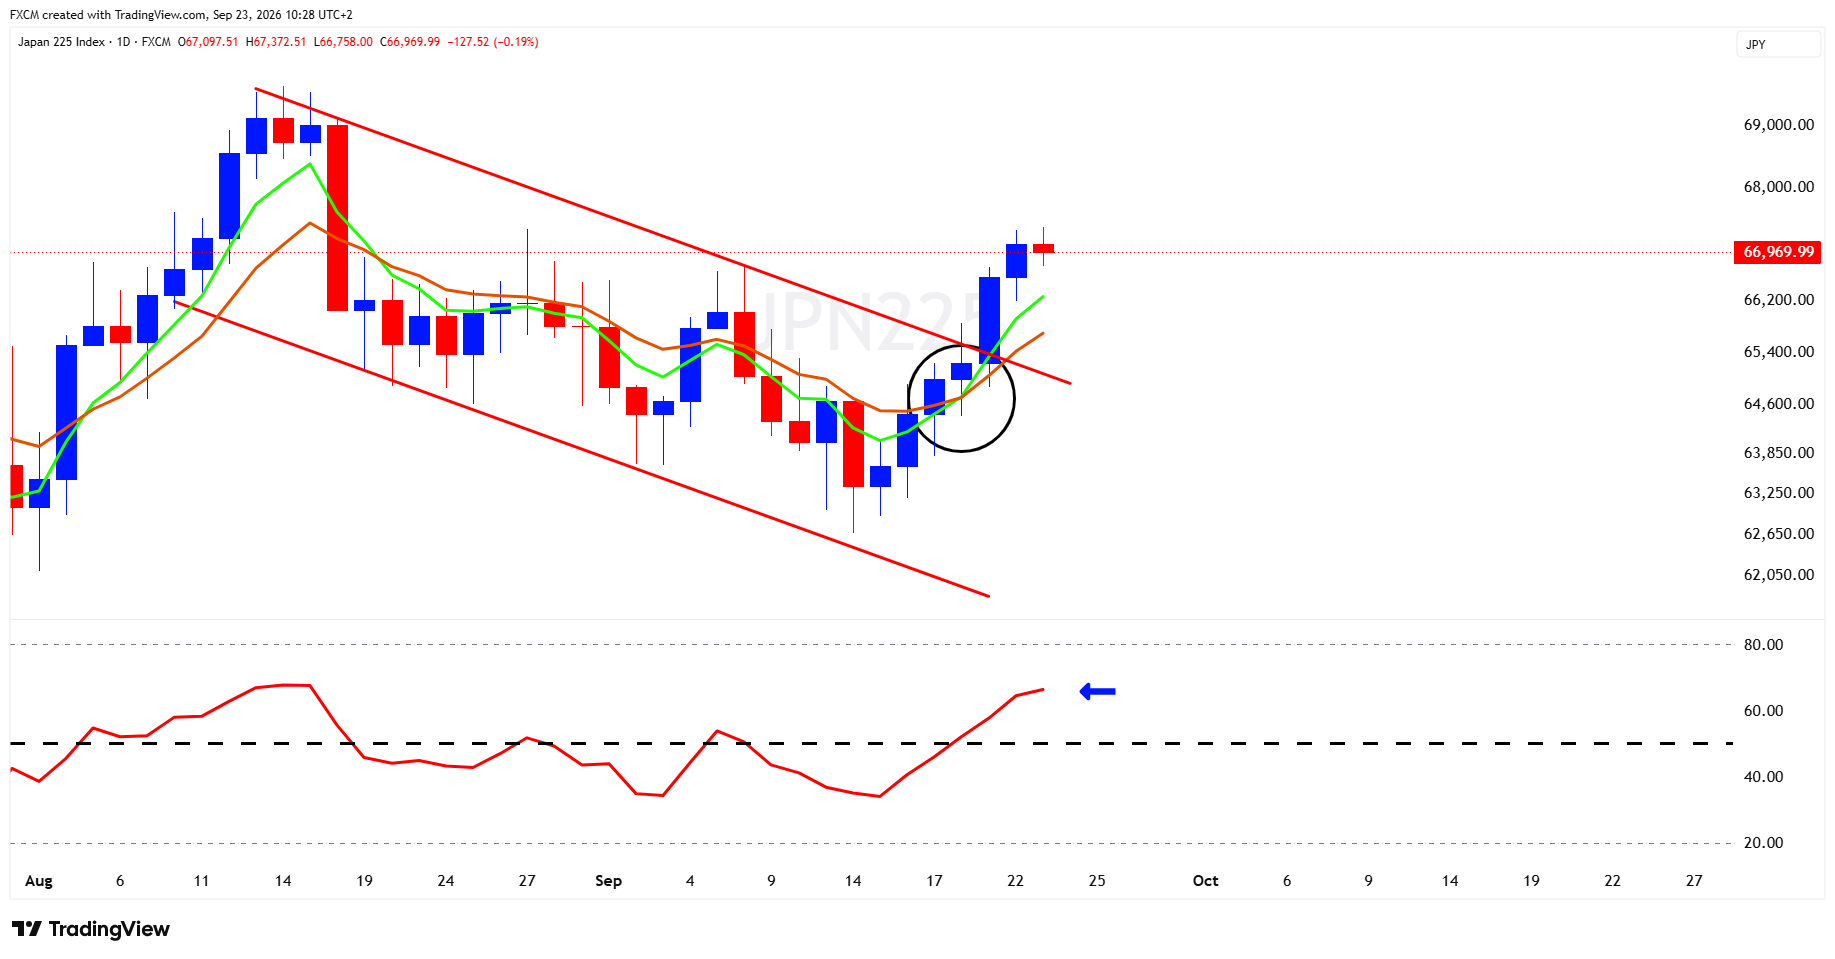
JPN225 is showing renewed bullish momentum, breaking above its descending channel as buyers regain control following the recent correction. A positive EMA crossover, with both averages now turning higher, reinforces the breakout, while the RSI's move above 50 signals strengthening underlying momentum. The longer the RSI holds above this threshold, the stronger the case for a sustained recovery. The next technical milestone is the formation of a higher trough, which would further confirm the emerging uptrend. For now, the combination of a channel breakout, bullish EMA alignment and improving RSI momentum suggests that the balance of power is shifting decisively towards the bulls.
Fundamental Perspective
JPN225's recovery is finding support in renewed enthusiasm for AI, with the rebound in US technology stocks providing a favourable backdrop for Japan's semiconductor and chip-equipment heavyweights. The Bank of Japan's recent rate increase to 1.25% has also failed to lift the yen, offering some relief to exporters through improved overseas earnings. Meanwhile, falling oil prices are welcome news for Japan's energy-dependent economy, potentially easing import costs and pressure on corporate margins. But there is a delicate balance at play. Further BOJ tightening could strengthen the yen and raise borrowing costs, while renewed Middle East tensions threaten to push energy prices higher again. For now, AI-related demand, the yen and oil prices remain central to the outlook, with the next moves in global semiconductor stocks likely to provide an important test of whether JPN225 can sustain its technical breakout.
AI Powers the Rally, but Market Risks Are Mounting
AI is back in the driving seat, pushing technology stocks to fresh highs, but the rally is looking increasingly narrow as much of the broader market struggles to keep pace. Despite their recent retreat, oil prices remain elevated and the US 10-year Treasury yield is hovering near 5%, leaving markets vulnerable to inflation concerns and renewed geopolitical tensions. Strong earnings and continued AI investment offer reasons for optimism, but a more sustainable advance may require lower oil prices, a less hawkish Fed and stronger participation beyond the technology sector.

Russell Shor
Senior Market Strategist
Russell Shor is a Senior Market Strategist at FXCM, having been promoted to the role in 2025 in recognition of his depth of insight and consistent delivery of high-impact market analysis. He originally joined FXCM in October 2017 as a Senior Market Specialist.
Russell holds an Honours Degree in Economics from the University of South Africa, is a certified FMVA®, and a full member of the Society of Technical Analysts (UK). With over 20 years of experience in financial markets, his work is renowned for its clarity, precision, and strategic value across asset classes.

Any opinions, news, research, analyses, prices, other information, or links to third-party sites contained on this website are provided on an "as-is" basis, as general market commentary and do not constitute investment advice. The market commentary has not been prepared in accordance with legal requirements designed to promote the independence of investment research, and it is therefore not subject to any prohibition on dealing ahead of dissemination. Although this commentary is not produced by an independent source, FXCM takes all sufficient steps to eliminate or prevent any conflicts of interests arising out of the production and dissemination of this communication. The employees of FXCM commit to acting in the clients' best interests and represent their views without misleading, deceiving, or otherwise impairing the clients' ability to make informed investment decisions. For more information about the FXCM's internal organizational and administrative arrangements for the prevention of conflicts, please refer to the Firms' Managing Conflicts Policy. Please ensure that you read and understand our Full Disclaimer and Liability provision concerning the foregoing Information, which can be accessed here.