General Motors Setting Up to Potentially Outperform Ford

Source: www.tradingview.com
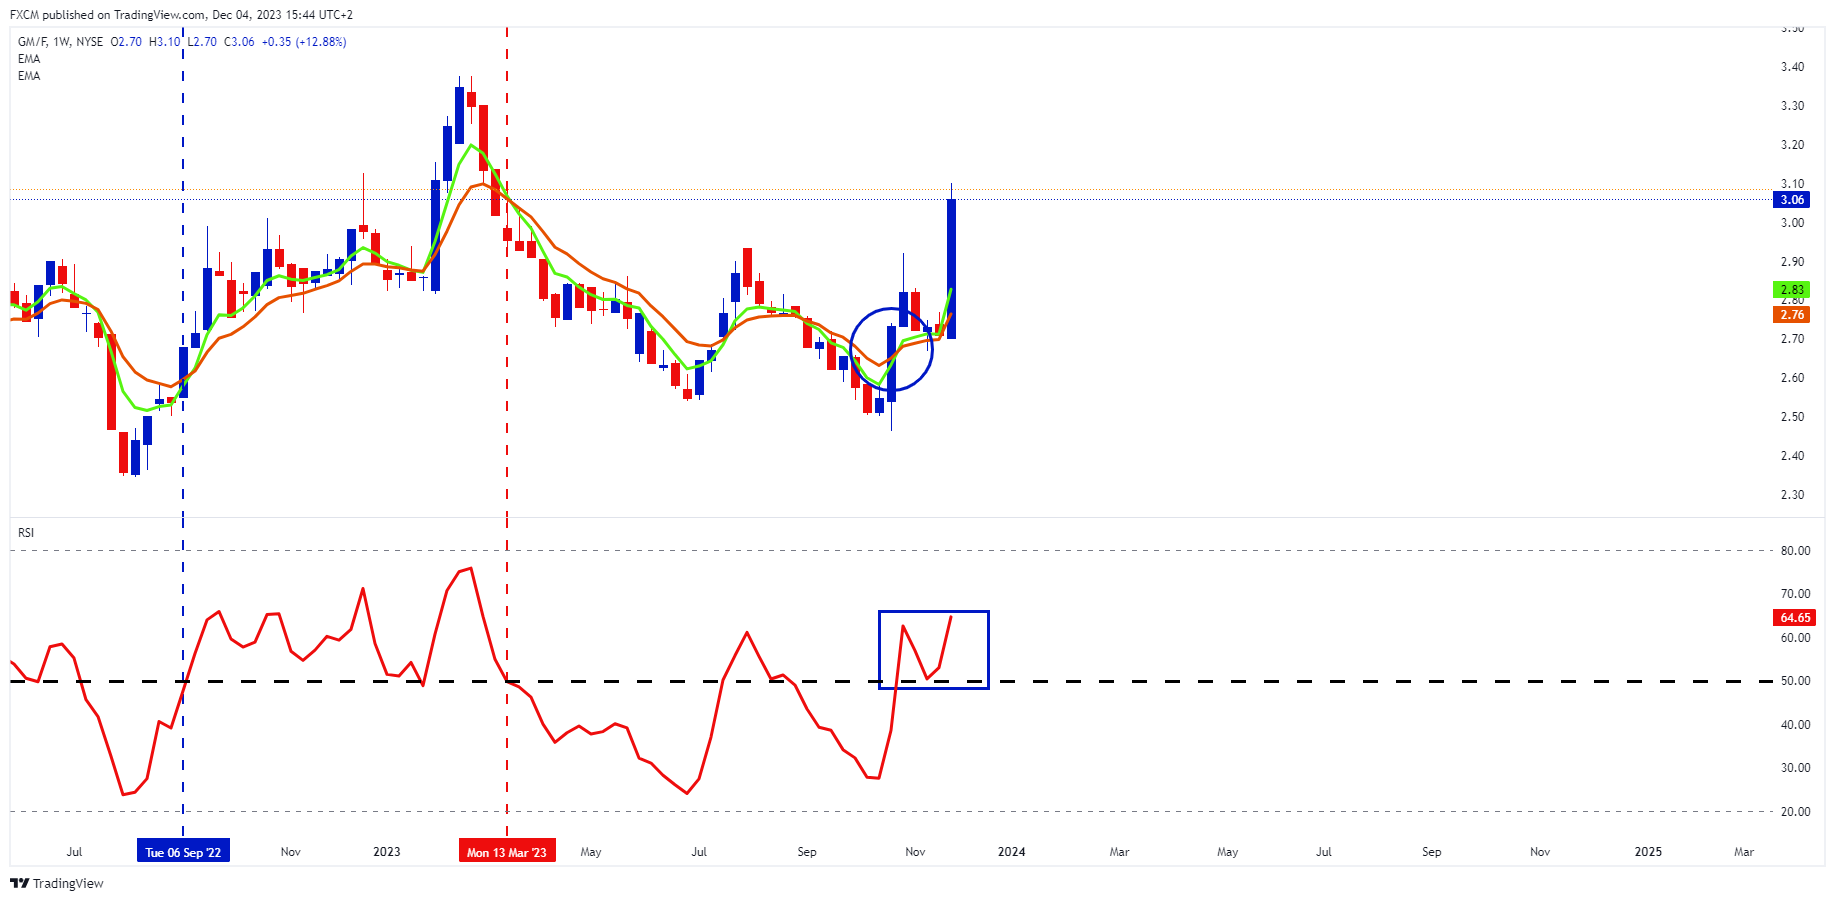
General Motors (GM.us) stock is looking set to outperform Ford (F.us). The relative strength chart, with GM.us as the numerator and F.us as the denominator, has bullish developments. The green 5-week EMA has crossed bullishly above the orange 10-week EMA (blue circle) and the RSI has crossed to the bullish side of 50 (blue rectangle).
Similar signals have charted previously (blue dashed vertical), only to reverse six and half months later (red dashed vertical). However, if the RSI maintains above 50 for a sustained period, the EMAs will develop angle and separation to the upside, which would emphasise GM.us's outperformance over F.us.
According to Barrons, Vijay Rakesh from Mizuho upgraded GM.us from a Hold to a Buy. Rakesh cited the following reasons for his upgrade, "The UAW strike is in the rearview mirror, production has resumed, and we see idiosyncratic catalysts."
The stock-based catalysts include a $10 billion share repurchase plan that was recently announced and cost savings to counter the UAW wage increase.
HSBC has also given GM.us a Buy rating, whilst keeping F.us as a Hold.
Approximately 65% of analysts covering GM.us rate the stock a Buy, with a 40% premium set in price targets. On the other hand, slightly more than 45% of analysts rate F.us as a buy with a target near $13.25, which is 25% higher from current price levels.

Russell Shor
Senior Market Strategist
Russell Shor is a Senior Market Strategist at FXCM, having been promoted to the role in 2025 in recognition of his depth of insight and consistent delivery of high-impact market analysis. He originally joined FXCM in October 2017 as a Senior Market Specialist.
Russell holds an Honours Degree in Economics from the University of South Africa, is a certified FMVA®, and a full member of the Society of Technical Analysts (UK). With over 20 years of experience in financial markets, his work is renowned for its clarity, precision, and strategic value across asset classes.
Any opinions, news, research, analyses, prices, other information, or links to third-party sites contained on this website are provided on an "as-is" basis, as general market commentary and do not constitute investment advice. The market commentary has not been prepared in accordance with legal requirements designed to promote the independence of investment research, and it is therefore not subject to any prohibition on dealing ahead of dissemination. Although this commentary is not produced by an independent source, FXCM takes all sufficient steps to eliminate or prevent any conflicts of interests arising out of the production and dissemination of this communication. The employees of FXCM commit to acting in the clients' best interests and represent their views without misleading, deceiving, or otherwise impairing the clients' ability to make informed investment decisions. For more information about the FXCM's internal organizational and administrative arrangements for the prevention of conflicts, please refer to the Firms' Managing Conflicts Policy. Please ensure that you read and understand our Full Disclaimer and Liability provision concerning the foregoing Information, which can be accessed here.