
AlphaTrack – SPX500 Faces a Key Test as Bulls Defend 7,650


Thoughtful insights and approachable analysis.
- Micron heads into earnings with bullish momentum and a shot at fresh highs if AI demand and margins stay strong.
- ASML breaks higher as bullish momentum and AI investment strengthen the case for further gains.
- US banks are testing key support, with earnings season set to decide whether September's sell-off becomes a buy-the-dip opportunity.
Quick Market Overview
US stocks fell as renewed tensions with Iran pushed oil prices higher and reinforced expectations that interest rates may need to stay elevated. The DUS30 lost 0.62%, while the SPX500 and NAS100 fell 0.75% and 1.14% respectively, as investors weighed the risk of further conflict, sticky inflation and additional Federal Reserve tightening. Rising Treasury yields are also making bonds more competitive with equities and putting added pressure on stock valuations.
General Equity Market Health (SPX500)
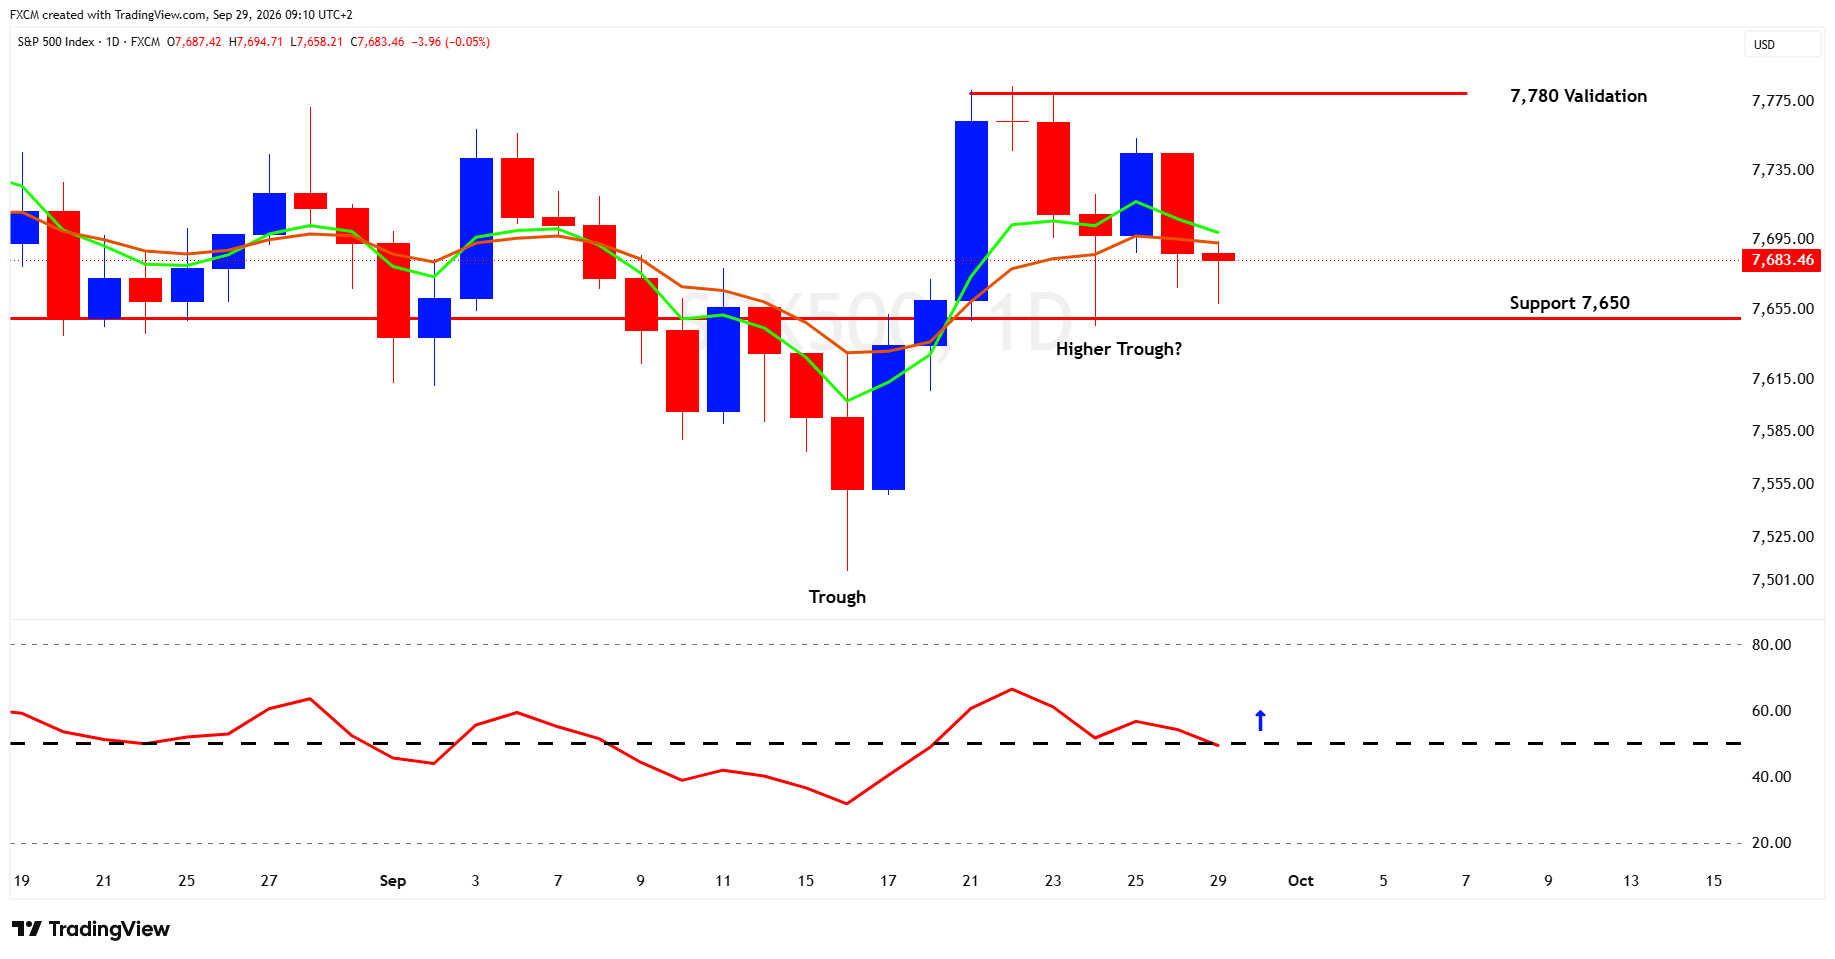
The S&P 500 is approaching an important technical inflection point, with the recent pullback testing whether a higher trough can develop above the mid-September low. Near-term support sits around 7,650, and holding this level would keep the emerging higher-trough structure intact. Confirmation, however, requires a decisive break above 7,780, which would clear the recent peak and re-establish a sequence of higher highs and higher lows. Momentum is equally important. RSI has retreated towards 50 after reaching the mid-60s, so a rebound back above 50 alongside a recovery in price would strengthen the bullish case, while failure to do so would suggest that momentum is fading rather than simply resetting. The short-term moving average has also begun to roll over, while price is hovering around the slower average, reinforcing the sense that the market is at a decision point rather than already resuming its advance. A break below 7,650 with RSI remaining below 50 would therefore be a short-term negative development, weakening the higher-trough thesis and increasing the risk of a move back towards the 7,585 to 7,555 area. For now, the setup is constructive but unconfirmed. 7,650 defines the risk, 7,780 provides the validation, and RSI could provide the early clue as to which side wins.
US economic activity remains solid, capital investment is robust and corporate earnings growth is unusually strong, with S&P 500 profits expected to rise by more than 30 percent in the third quarter. The complication is that the same resilience is keeping inflation and interest-rate pressure alive. The Fed raised rates by 25 basis points in September to 3.75 to 4.00 percent, while the US 10-year Treasury yield has climbed above 5.2 percent and UKOil is trading above $107 a barrel amid continuing Middle East supply concerns.
That leaves equities caught between a powerful earnings engine and an increasingly demanding cost of capital. The next test comes quickly, with PCE inflation due on 30 September and the September payroll report on 2 October. Softer inflation without a meaningful deterioration in growth would ease some of the pressure coming from bonds and strengthen the case for the index to hold 7,650 and eventually challenge 7,780. Another inflation surprise or further rise in Treasury yields would make that technical support considerably harder to defend. For now, the fundamental picture is still supportive, but the bond market is making equities work for every point higher.
Potential Trade Setups
September has created a handful of interesting setups across very different parts of the market. One semiconductor name is trying to turn strong momentum into another leg higher, another is testing whether a major trend shift has real staying power, while the banks are probing an old resistance zone that could now become support. The common thread is confirmation. Momentum, moving averages and key price levels are all lining up in ways that could create opportunities, but each still needs further evidence before the setup is fully validated.
Micron Technology Inc. (MU.us)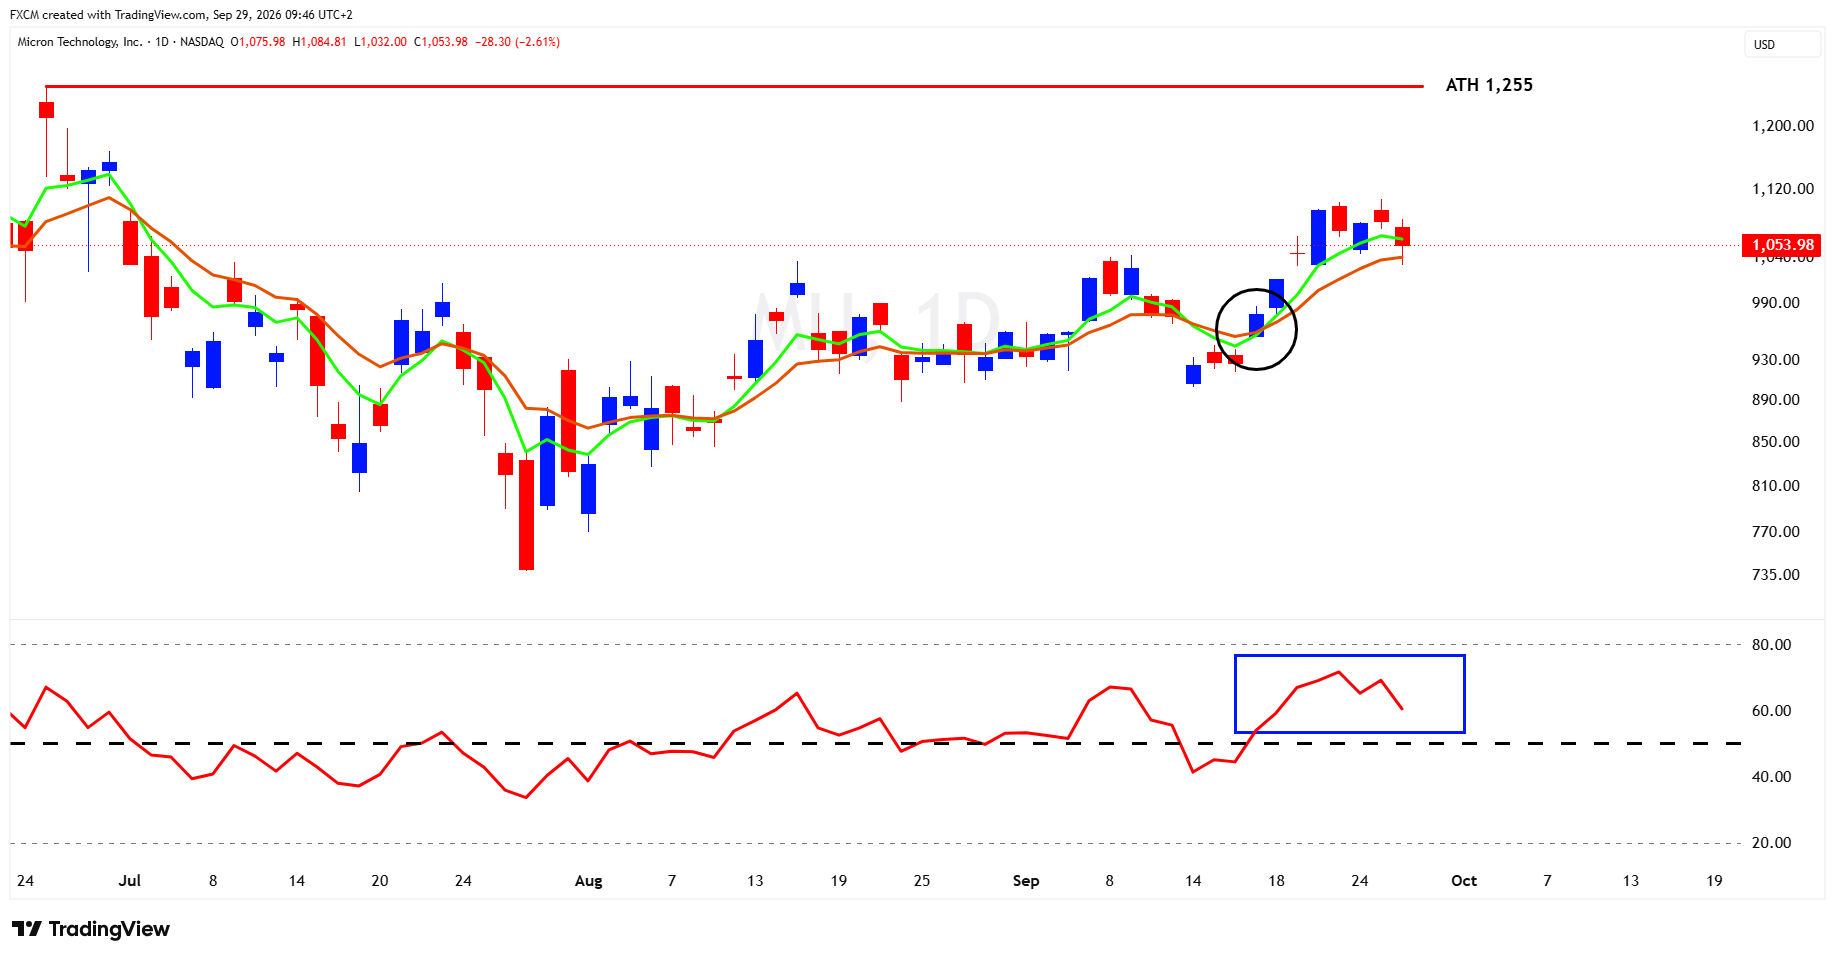
Technical Analysis
MU's technical picture remains constructive after the recent recovery, with the short-term EMAs having crossed bullishly and price holding above both averages. The next test is whether those EMAs can maintain their upward angle and continue to separate, which would signal that the trend is gaining rather than losing momentum. RSI is equally important and, after pushing into the upper 60s, has eased but remains comfortably above 50, keeping underlying momentum supportive for now. The recent consolidation around 1,050 to 1,100 therefore looks more like a pause after a strong advance than an outright reversal, although a sustained move below RSI 50 alongside a flattening or bearish turn in the EMAs would weaken that view. If momentum holds and price can clear the recent highs around 1,100, the path would begin to open towards the all-time high near 1,255. For now, the trend is positive, but the quality of the next move will depend on whether the EMAs keep widening and RSI continues to hold its bullish regime above 50.
Caveat
A drop below RSI 50 would be a negative development, and a sustained move below that level would increase pressure on the Micron share price.
Fundamental Perspective
Micron's results tomorrow will be about much more than simply beating the quarter, with investors focused on whether the extraordinary strength in memory can continue into fiscal 2027. Wall Street is looking for roughly $50.9 billion of revenue and around $31.50 of adjusted EPS, compared with Micron's guidance of $50 billion plus or minus $1 billion and non-GAAP EPS of $31.00 plus or minus $1.00, while gross margin around the company's 86% target will be another key test.
The bigger share-price drivers are likely to be Micron's forward outlook, HBM demand, DRAM and NAND pricing, capital spending and any evidence that tight memory supply can persist through fiscal 2027. Micron has already begun high-volume shipments of HBM4 to its lead customer, while the wider industry is devoting an increasing share of DRAM capacity to HBM, potentially keeping conventional memory supply tight.
Investors will want evidence that AI-driven demand remains strong, margins can stay elevated and management's fiscal 2027 commentary supports the idea that the current memory upcycle still has room to run.
ASML Holding NV (ASML.nl)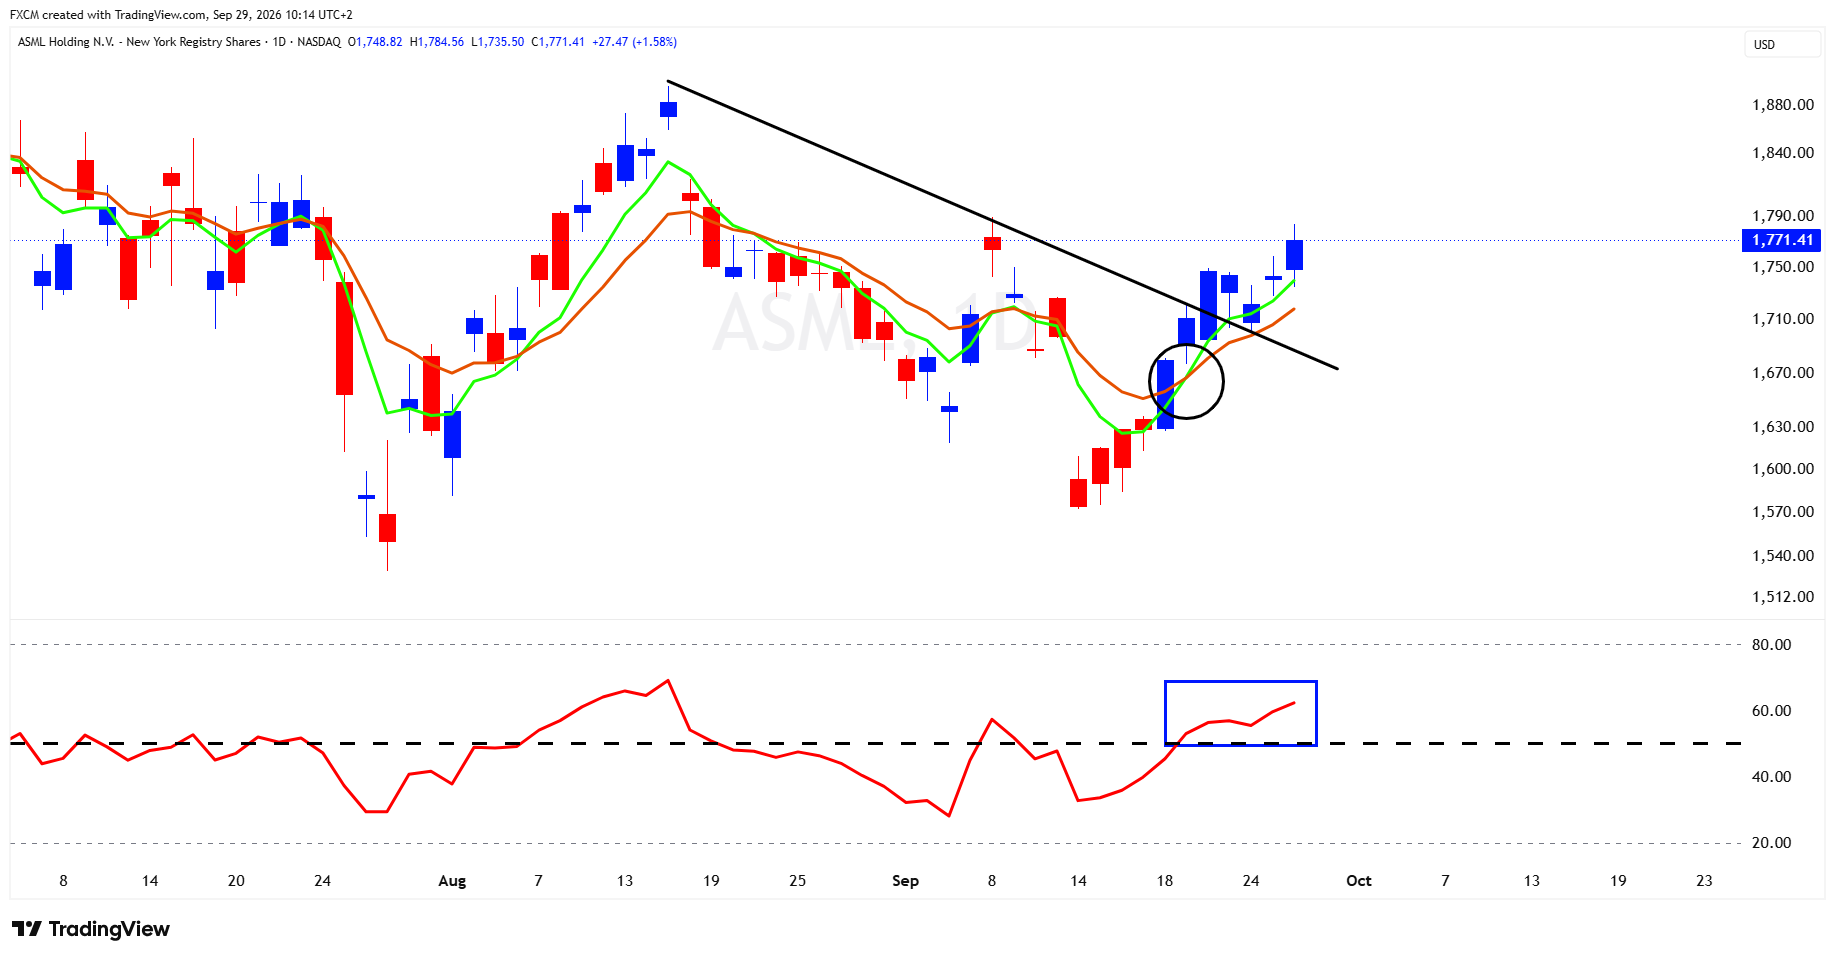
Technical Analysis
ASML's technical picture has improved meaningfully, with the short-term EMAs crossing bullishly and now showing both positive angle and growing separation, a combination that suggests the recovery is developing into a more established trend. Importantly, price has also pushed above the descending trendline that had capped the shares since the August peak, adding weight to the breakout and signalling an improvement in momentum. RSI supports that view, having moved firmly above 50 and into the low 60s without yet reaching overbought territory, which leaves room for further upside. As long as RSI can remain above 50 and the EMAs continue to rise and widen, the technical backdrop should remain supportive. The next area to watch is around 1,790, followed by the August highs near 1,840 to 1,880.
Caveat
A retreat back below the broken trendline accompanied by RSI falling under 50 would weaken the breakout and raise the risk that the recent strength proves temporary.
Fundamental Perspective
ASML's improving technical picture is being supported by a strong fundamental backdrop, with continued AI investment driving demand for the advanced logic and memory capacity that depends heavily on the company's lithography systems.
ASML raised its 2026 revenue outlook in July to €43 billion to €45 billion and plans to increase low-NA EUV production capacity by around 30% in 2027 as customers expand leading-edge capacity. High NA EUV adoption is also progressing, with Intel already using the technology in high-volume manufacturing, while ASML and TSMC recently launched an initiative to develop larger 12-inch photomasks that should improve High NA productivity and economics over time.
The wider semiconductor backdrop remains supportive, with preliminary South Korean trade data showing extraordinary growth in chip exports during September as AI-related demand stays strong, although final monthly figures are still due.
The main risks remain tighter restrictions on sales to China, longer-term Chinese efforts to develop domestic lithography capability and pressure on technology valuations from rising bond yields. For now, however, continued AI capex and expanding customer capacity plans provide a credible fundamental tailwind behind ASML's recent technical improvement.
USBANKS (FXCM US Banks Basket)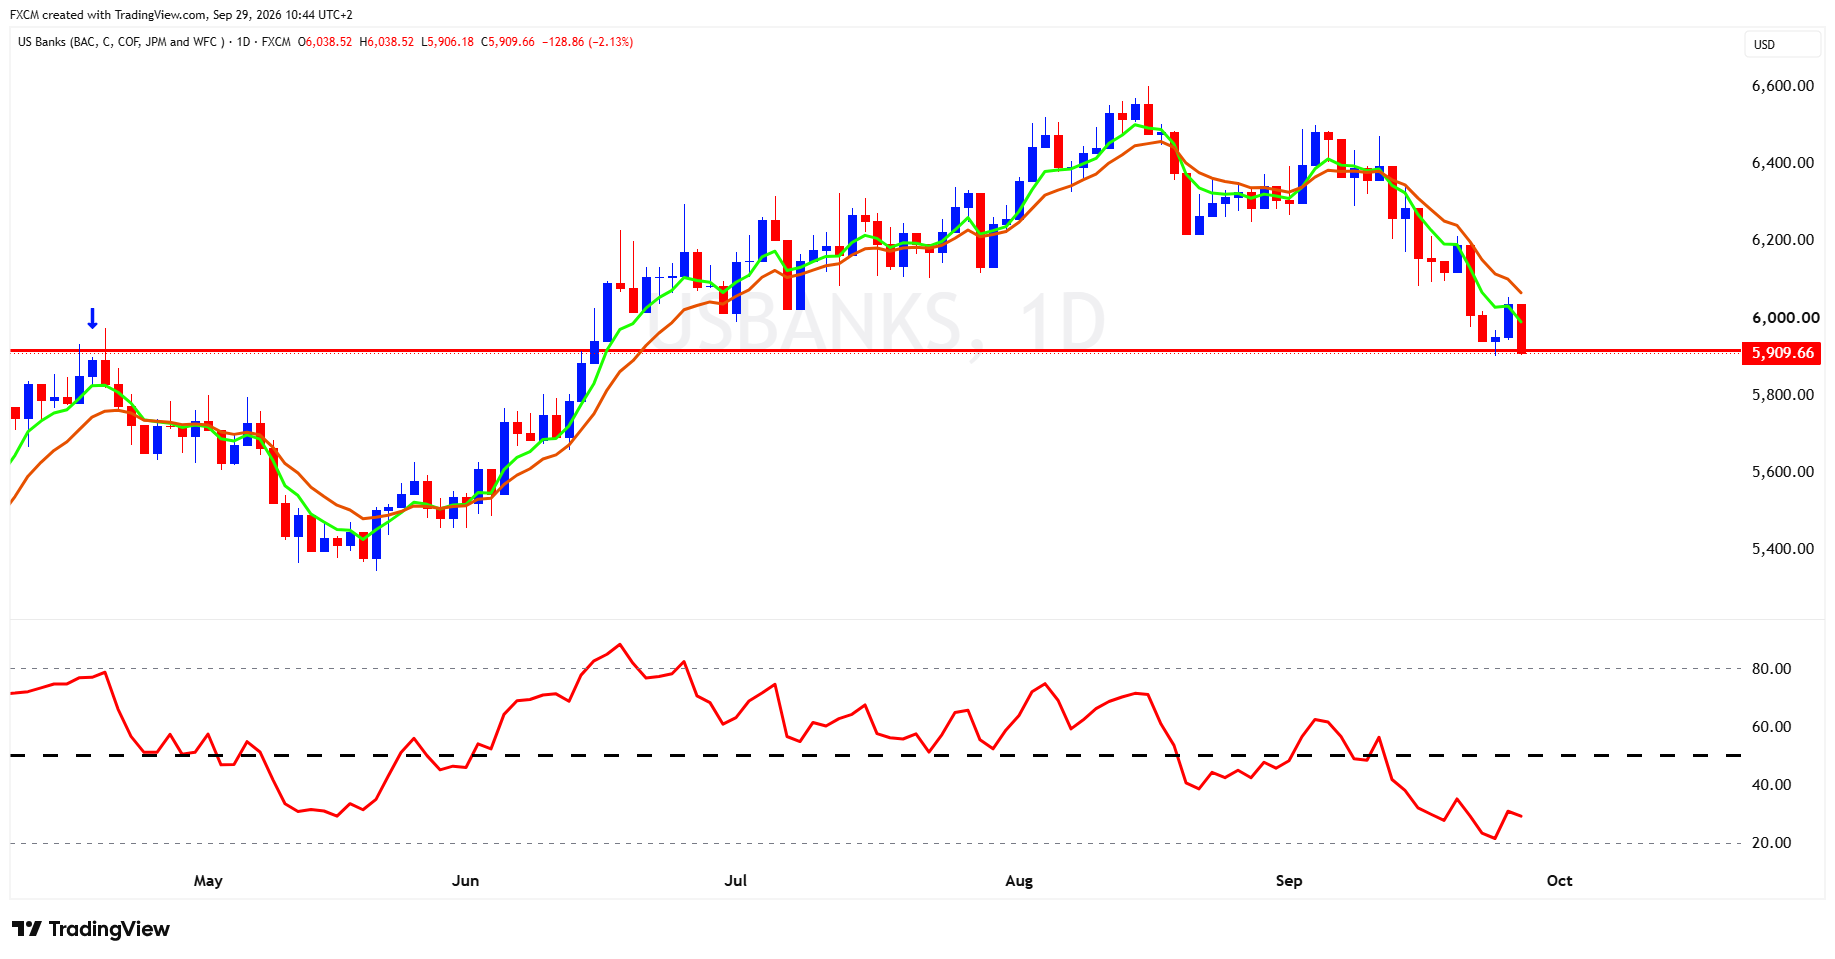
Technical Analysis
US banks have pulled back sharply through September and are now testing an area around 5,900 that previously acted as resistance, making this an important level for determining whether the decline develops into a genuine buy-the-dip opportunity. If former resistance can turn into support and the basket begins to stabilise here, that would be an encouraging sign that buyers are stepping back in after the recent sell-off. Momentum, however, is still working against the bulls. RSI remains below 50, confirming that the short-term trend is still under pressure, while the faster EMA has rolled beneath the slower average. For any rebound to look convincing, RSI will need to recover back above 50 and the moving averages will need to flatten and eventually turn higher. Until then, the setup is interesting but not yet confirmed, with the current support zone doing most of the heavy lifting.
Caveat
If RSI fails to reclaim 50, the banking basket is likely to remain under pressure and any rebound could struggle to gain traction.
Fundamental Perspective
US bank shares have pulled back sharply in September as investors have reassessed the outlook for margins, deal activity and credit against a more difficult rate backdrop. The 2-year to 10-year Treasury curve flattened to its narrowest since March 2025, raising concern that the spread between bank funding costs and lending returns could come under pressure, while expectations for further Fed tightening have increased as inflation and oil prices remain elevated. Earnings season will therefore be less about the quarter just finished and more about what management says comes next. Bank of America has already warned that third-quarter investment banking fees could fall by at least 10%, even though its deal pipeline remains strong, while Wells Fargo has struck a more encouraging tone by reaffirming roughly $50 billion of full-year net interest income and saying third-quarter net interest margin should be better than previously expected. That sets up a fascinating reporting season. The market will be listening closely for evidence that net interest income can hold up, loan growth remains healthy and credit losses stay contained, because if management teams can reassure on those points, some of September's weakness may start to look more like a valuation reset than the beginning of a deeper earnings problem.
Hot News, Cold Logic
Global markets remain under pressure as oil prices rise and government bond yields sit near multi-year highs, forcing investors to reassess how long interest rates may stay elevated. The Middle East conflict, heavy sovereign borrowing and massive AI-related financing needs have all contributed to higher yields, while resilient US growth has so far delayed the economic impact. With the 10-year Treasury yield near 5.3% and markets pricing a strong chance of another Fed hike in October, the key question is how long the economy and equities can withstand tighter financial conditions.
Final Thought
Markets approach the final quarter caught between strong profits and increasingly expensive money. Resilient growth and the AI investment boom continue to support the equity story, but oil above $100 and bond yields at multi-year highs are steadily raising the hurdle for equity valuations. The bull case remains intact while earnings deliver, but from here the market will increasingly have to earn its gains through profit growth rather than rely on cheaper money or renewed multiple expansion.

Russell Shor
Senior Market Strategist
Russell Shor is a Senior Market Strategist at FXCM, having been promoted to the role in 2025 in recognition of his depth of insight and consistent delivery of high-impact market analysis. He originally joined FXCM in October 2017 as a Senior Market Specialist.
Russell holds an Honours Degree in Economics from the University of South Africa, is a certified FMVA®, and a full member of the Society of Technical Analysts (UK). With over 20 years of experience in financial markets, his work is renowned for its clarity, precision, and strategic value across asset classes.

Any opinions, news, research, analyses, prices, other information, or links to third-party sites contained on this website are provided on an "as-is" basis, as general market commentary and do not constitute investment advice. The market commentary has not been prepared in accordance with legal requirements designed to promote the independence of investment research, and it is therefore not subject to any prohibition on dealing ahead of dissemination. Although this commentary is not produced by an independent source, FXCM takes all sufficient steps to eliminate or prevent any conflicts of interests arising out of the production and dissemination of this communication. The employees of FXCM commit to acting in the clients' best interests and represent their views without misleading, deceiving, or otherwise impairing the clients' ability to make informed investment decisions. For more information about the FXCM's internal organizational and administrative arrangements for the prevention of conflicts, please refer to the Firms' Managing Conflicts Policy. Please ensure that you read and understand our Full Disclaimer and Liability provision concerning the foregoing Information, which can be accessed here.