
Market Threads – Oil Risk Premium Still in Play

.png)
Tracking important market threads across currencies, commodities, and indices.
- Oil is back in play as geopolitical risk meets key resistance.
- USDOLLAR holds firm as Fed rate bets keep the breakout case alive.
- Gold steadies, but dollar strength and yield pressure keep the downtrend intact.
- SPX500 holds firm as yields, Fed minutes and AI earnings take centre stage.
Cross Asset View
Markets are entering a more delicate phase, with oil, the dollar, gold and equities all reacting to the same central tension: whether renewed geopolitical risk and a hawkish Fed backdrop are enough to disrupt the broader risk recovery.
Oil has regained a risk premium, USDOLLAR is being supported by firmer rate expectations, XAUUSD remains pressured by dollar and yield strength, and SPX500 is testing whether earnings optimism can withstand higher short-term yields.
The result is a cross-asset setup where the next move may depend less on any single chart and more on how the FOMC minutes, the 2-year yield and Middle East risk shape investor confidence.
Oil
Technical Analysis
UKOil
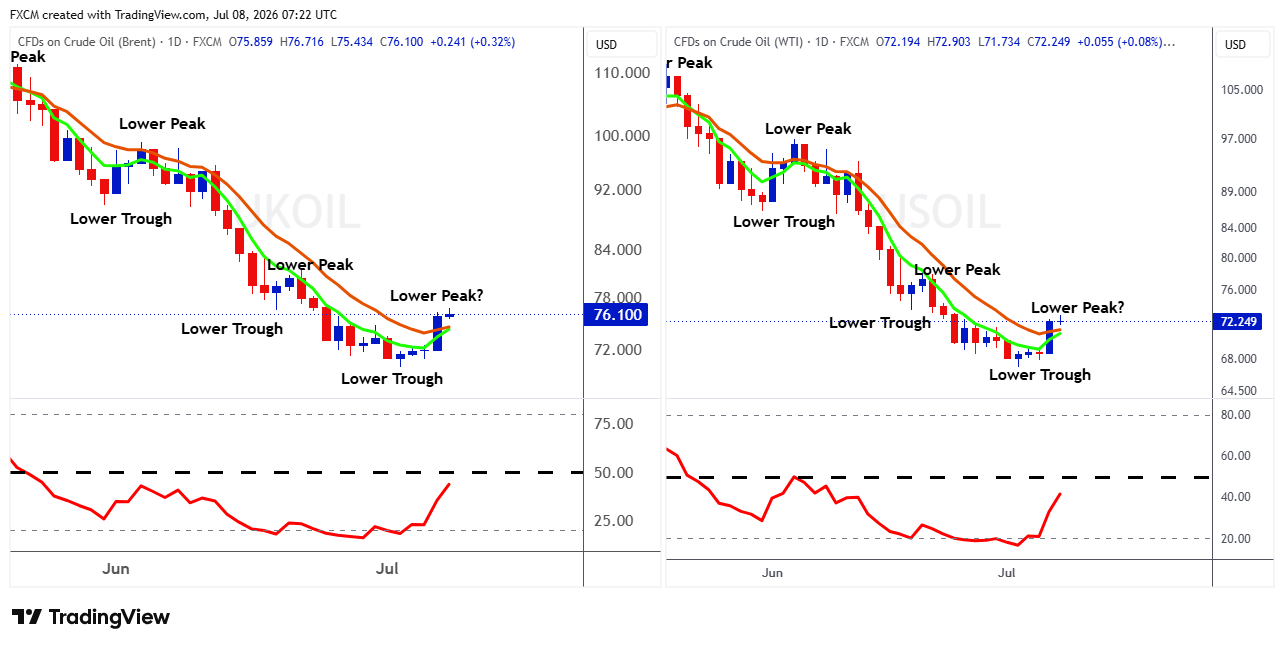
UKOil remains in a broader short-term downtrend, with the chart still defined by a sequence of lower peaks and lower troughs from the May high. The recent bounce from the early-July trough is encouraging, but it has not yet done enough to confirm a reversal. For now, the move looks more like a rebound into resistance than a clean trend change.
The key issue is the area around $76–$78. Price has pushed back towards the declining moving averages and is now testing the zone where another lower peak could form. The shorter moving average has started to turn higher, which shows improving near-term momentum, but the burden of proof still remains with the bulls.
Momentum has improved sharply. The RSI has rebounded from oversold territory and is moving towards the 50 area, suggesting that selling pressure has eased. However, until RSI can break and hold above 50 and hold, the recovery remains unconfirmed.
A sustained break above the recent lower-peak area would improve the technical picture and raise the chance that UKOil is building a base. Failure here, however, would keep the lower-high structure intact and leave the recent trough around $70–$71 as the key downside level to watch.
USOil
USOil shows a very similar structure. The dominant pattern is still a downtrend, with a clear run of lower peaks and lower troughs since the May high. The latest rally has lifted price off the early-July low, but it is now approaching the same problem area: the point where the market either breaks the downtrend or forms yet another lower peak.
The current resistance zone sits around $72–$74. Price has moved back towards the moving averages, and the shorter average is turning higher, which is a positive near-term sign. But the broader price structure still favours caution.
Momentum is recovering from oversold conditions. The RSI has turned up strongly, which suggests that the downside move became stretched and that buyers have returned. Still, the RSI remains below the 50 line, so momentum has improved but has not yet turned bullish.
For USOil, a break above the current lower-peak zone would be the first meaningful sign that the downtrend is losing control. Until then, the risk is that this remains a relief rally inside a falling trend. The recent low around $67–$69 is the key support area; a break below that would restore downside pressure.
Overall view
Both UKOil and USOil are trying to stabilise after a sharp decline, but neither chart has yet confirmed a bullish reversal. The immediate technical question is whether the current bounce can break above the latest lower-peak zones. If it can, the market may be shifting from a downtrend into a basing phase. If it cannot, the current rally may simply mark another lower high before renewed weakness.
Fundamental Perspective
The recent bounce in UKOil and USOil reflects the return of an oil risk premium, as renewed tension around the Strait of Hormuz has revived fears of supply disruption. Fresh US-Iran tit-for-tat strikes, reported attacks on commercial vessels near Hormuz, damage to Qatari LNG and Saudi crude tankers, and several tankers turning back from the strait have all added to that premium.
Even so, the premium remains less extreme than earlier in the conflict, with much of the geopolitical risk already unwound after Hormuz flows reopened. The EIA also expects higher production, smaller inventory draws, and UKOil to average around $74/bbl in Q3 2026 before easing further in 2027.
Oil therefore remains finely balanced. Geopolitics can still drive sharp near-term rallies, but improving supply, softer demand concerns, and the risk of a return to surplus may limit sustained upside unless the Middle East situation deteriorates again or demand strengthens materially.
The USDOLLAR
Technical Analysis
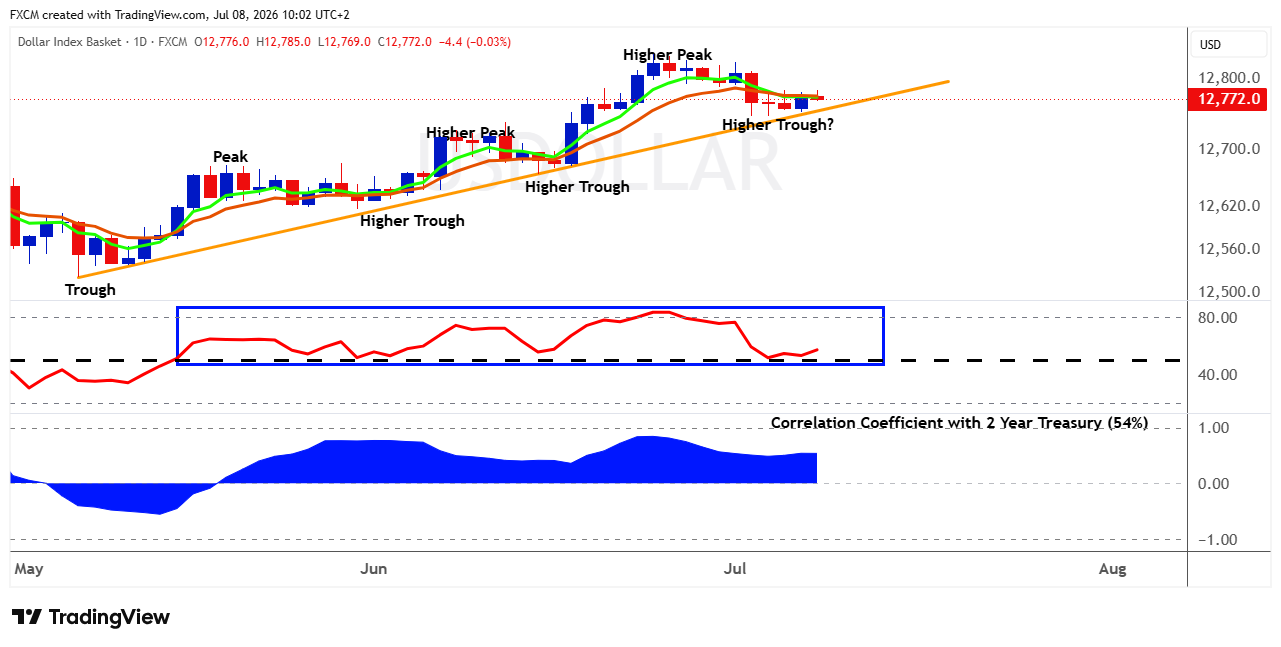
FXCM's USDOLLAR remains in a constructive short-term uptrend, with the chart still showing a sequence of higher troughs and higher peaks from the May low. The most recent pullback has not yet damaged that structure. Instead, price is consolidating just above the rising trendline and close to the moving averages, which makes this an important support test rather than a confirmed reversal.
The key area to watch is around 12,730–12,760. This zone contains the rising trendline, the recent higher-trough area and the short-term moving averages. As long as price holds above this region, the broader bullish structure remains intact. A break below it would weaken the pattern and raise the risk that the recent peak near 12,820–12,840 becomes a more meaningful short-term top.
Momentum has cooled, but it has not turned bearish. The RSI has pulled back sharply from overbought territory and is now hovering just above the 50 area. That suggests the market has worked off some excess without fully handing control back to sellers. If RSI holds above 50 and turns higher, it would support another attempt at the recent highs.
The correlation panel also matters. The USDOLLAR is showing a positive correlation with the 2-year Treasury yield, currently around 54%, which suggests short-dated US rate expectations are still an important driver. If 2-year yields continue to firm, that could support the dollar. If yields roll over, the dollar's support may weaken.
Overall, the USDOLLAR is consolidating within an uptrend. A hold above the rising trendline would keep the bullish bias alive, while a break below the latest higher trough would suggest the rally is losing momentum.
Fundamental Perspective
The USDOLLAR is being supported by firmer US rate expectations and renewed defensive demand. Markets have shifted towards a 25bp Fed hike in September, rather than later in the year, with an implied probability of around 50% ahead of tonight's June FOMC minutes.
The minutes matter because they should clarify whether the Fed's hawkish shift reflects persistent inflation pressure, the inflation risk from stronger oil, or confidence that the economy can absorb tighter policy. They may reinforce the hawkish message and keep the greenback supported, although aggressive further repricing could be limited after the softer jobs report.
For now, higher Treasury yields, stronger oil and pockets of equity weakness all give USDOLLAR a constructive backdrop, but a sustained breakout would likely need confirmation that policymakers are seriously considering another hike.
Forex Pairs To Keep An Eye On
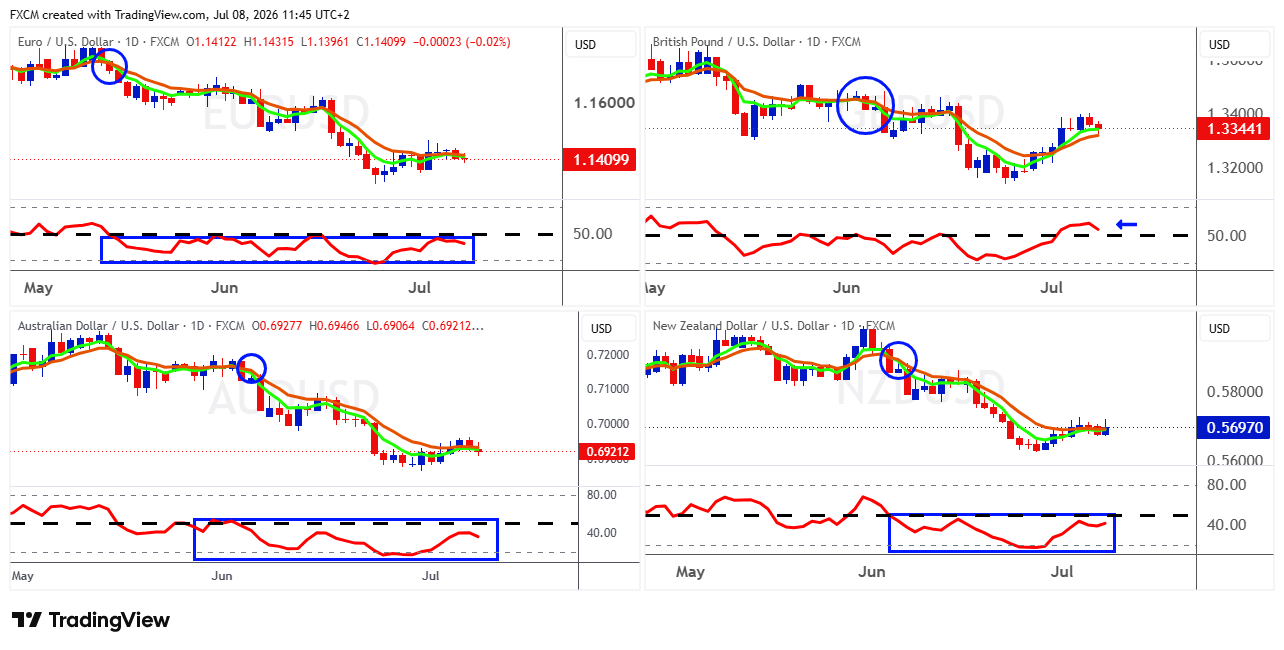
Technically, the major USD pairs still show the greenback with the upper hand. EURUSD, AUDUSD and NZDUSD remain capped near their short-term moving averages, while GBPUSD has held up better but is starting to lose momentum after its rebound. Across the group, RSI is mostly struggling around the 50 area, which suggests the foreign-currency rallies are still corrective rather than confirmed trend changes.
Fundamentally, the key driver remains the USDOLLAR uptrend and its positive correlation with the 2-year Treasury yield. If short-dated US yields rise on hawkish Fed expectations, especially after tonight's FOMC minutes, the dollar should remain supported and these pairs may struggle to break higher.
Stronger oil and renewed US-Iran tension add to the inflation and yield risk, although NZDUSD has some local support after the RBNZ's 25bp hike. The caveat is that the dollar has already pared some gains, so the bullish USD view still needs yields and Fed messaging to keep confirming it.
Gold
Technical Analysis
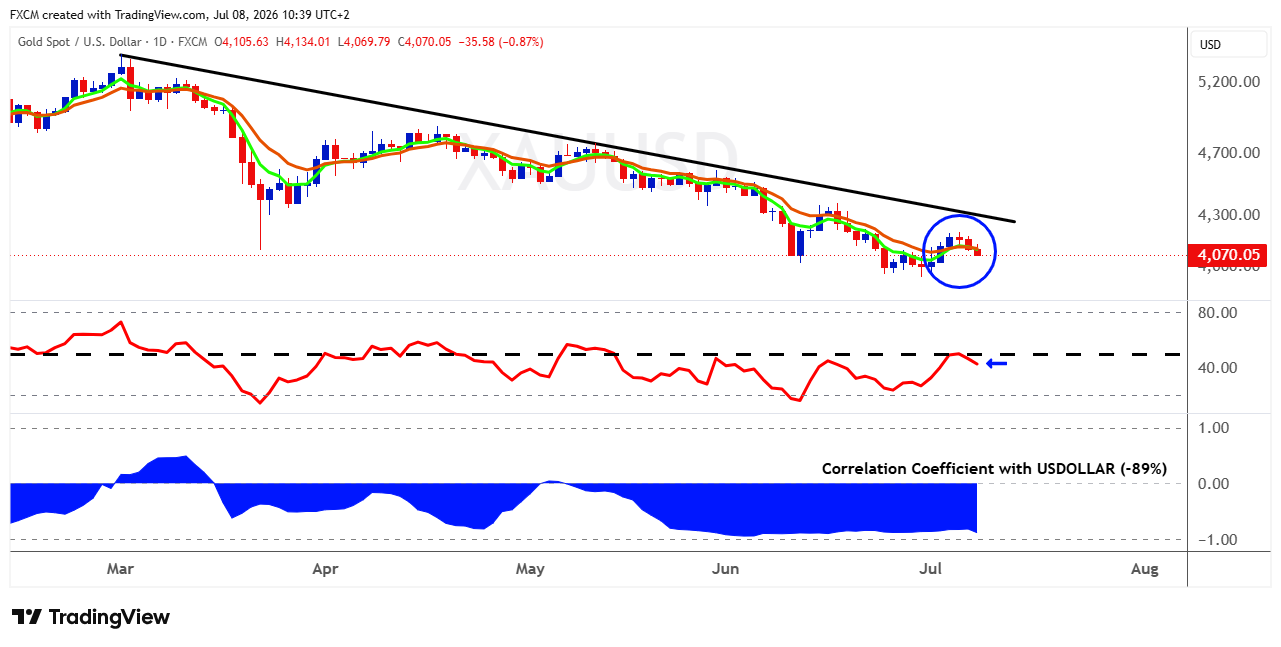
XAUUSD remains in a clear short-term downtrend, with price still trading below the descending trendline that has capped rallies since the March peak. The broader structure continues to show lower peaks and lower troughs, so the recent bounce has not yet changed the trend.
The key resistance area is around 4,200–4,300. This zone includes the descending trendline, the recent failed rebound area and the moving averages. Until price can break above that region, rallies are likely to be treated as corrective rather than the start of a new bullish phase.
The latest price action inside the blue circle is important. Gold tried to rebound, briefly pushed above the short-term moving averages, but then rolled over again. That suggests buyers returned near the lows, but not with enough strength to shift control away from sellers.
Momentum is also still weak. The RSI recovered from oversold territory but failed around the 50 line, which is usually a sign that bearish momentum remains in place. A sustained move above 50 would be needed to show that momentum is improving more convincingly.
The correlation panel is also significant. XAUUSD is showing a strong negative correlation with USDOLLAR, currently around -89%. That means dollar strength remains a major headwind for gold. If USDOLLAR continues to firm, gold may struggle to break higher. If the dollar weakens, it could help gold stabilise.
Overall, XAUUSD is attempting to base, but the downtrend remains intact. A break above the descending trendline would improve the technical picture, while failure below the recent rebound area keeps the risk of another move back towards the recent lows.
Fundamental Perspective
XAUUSD remains closely tied to USDOLLAR and US yields. With gold showing a strong negative correlation to USDOLLAR, and USDOLLAR positively correlated with the 2-year Treasury yield, higher short-dated US yields would likely support the dollar and weigh on gold.
That puts tonight's June FOMC minutes in focus. A hawkish tone could reinforce rate-hike expectations, lift yields and keep the greenback supported, while a softer message would ease that pressure.
Geopolitical tension may still offer gold some safe-haven support, but if Middle East risks push oil, inflation expectations, yields and the dollar higher together, the overall backdrop could remain challenging for gold.
Index in Focus: SPX500
Technical Analysis
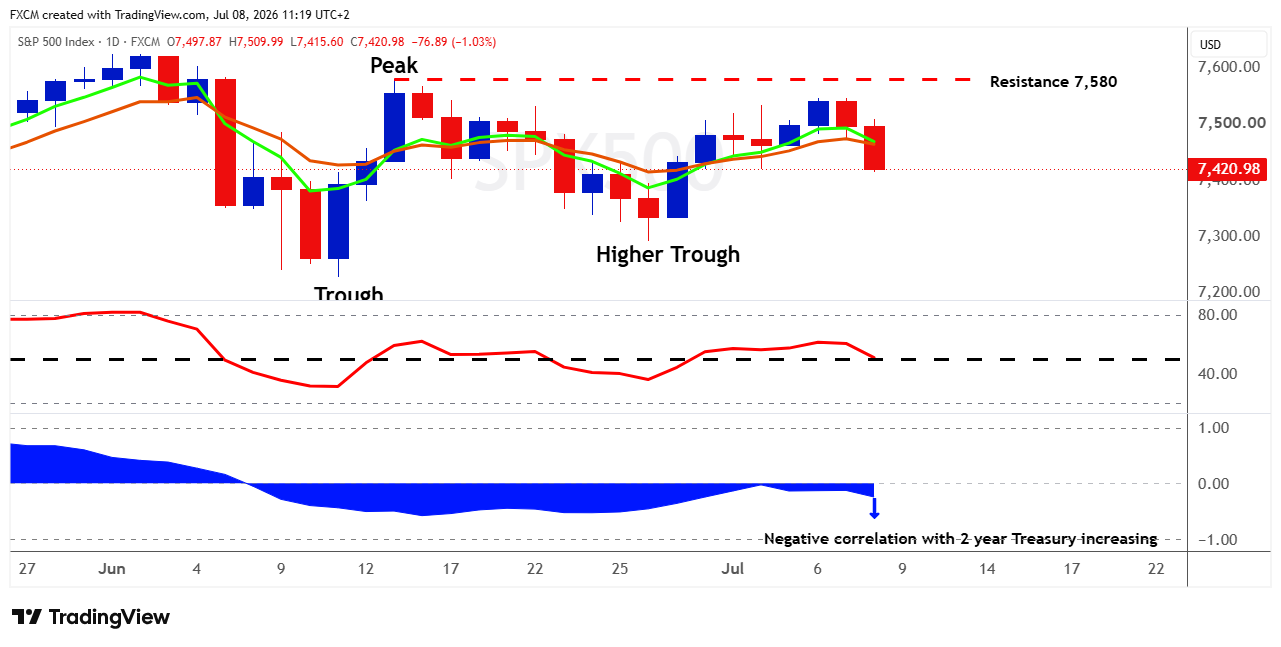
SPX500 is still holding a constructive short-term structure, but the latest rejection shows that upside momentum is struggling near resistance. The chart shows a recovery from the June trough, followed by a higher trough in late June, which means the broader rebound structure has not yet broken. However, the index has failed again below the 7,580 resistance area, and the latest red candle suggests sellers are becoming more active near the top of the range.
The key upside level remains 7,580. A clean break above this area would confirm a higher high and strengthen the bullish case. Until that happens, SPX500 is still trading inside a choppy consolidation range rather than a confirmed breakout.
Near-term support sits around 7,380-7,420, where the latest pullback is now testing the moving averages and the prior consolidation area. If this zone holds, the market could still build another attempt at resistance. A break below it would weaken the higher-trough structure and raise the risk of a move back towards the June low area near 7,250-7,300.
Momentum has softened. The RSI has rolled over from above the 50 line and is now testing that midpoint. This suggests the market has lost some upside strength, but it has not yet turned decisively bearish. A hold above 50 would support another rebound attempt, while a break below 50 would point to fading momentum.
The correlation panel is also important. The chart shows the negative correlation with the 2-year Treasury yield is increasing, which suggests SPX500 is becoming more sensitive to rising short-term yields. If 2-year yields continue to rise, that could become a headwind for equities. If yields ease, it may help stabilise the index.
Overall, SPX500 remains in a constructive but fragile setup. The higher trough keeps the recovery alive, but the failure below 7,580 means the market still needs a confirmed breakout. For now, this looks like a pullback within a range rather than a confirmed bearish reversal.
Fundamental Perspective
The SPX500 pullback reflects a more difficult mix of higher rate sensitivity, geopolitical risk and stretched earnings expectations. The chart shows the index's negative correlation with the 2-year Treasury yield is increasing, which matters because the 2-year yield is closely tied to Fed policy expectations.
With markets watching tonight's June FOMC minutes for clues on inflation, growth and future rate hikes, any hawkish tone could lift short-term yields and pressure equity multiples. Higher oil prices after renewed US-Iran tension add another complication, as they can revive inflation concerns and reinforce the rates headwind.
That said, the broader equity story has not disappeared: earnings season is approaching with high expectations, especially for technology, so the next major drivers are likely to be the FOMC tone, the 2-year yield, oil-driven inflation risk and whether AI-linked earnings can justify elevated valuations.

Russell Shor
Senior Market Strategist
Russell Shor is a Senior Market Strategist at FXCM, having been promoted to the role in 2025 in recognition of his depth of insight and consistent delivery of high-impact market analysis. He originally joined FXCM in October 2017 as a Senior Market Specialist.
Russell holds an Honours Degree in Economics from the University of South Africa, is a certified FMVA®, and a full member of the Society of Technical Analysts (UK). With over 20 years of experience in financial markets, his work is renowned for its clarity, precision, and strategic value across asset classes.

Any opinions, news, research, analyses, prices, other information, or links to third-party sites contained on this website are provided on an "as-is" basis, as general market commentary and do not constitute investment advice. The market commentary has not been prepared in accordance with legal requirements designed to promote the independence of investment research, and it is therefore not subject to any prohibition on dealing ahead of dissemination. Although this commentary is not produced by an independent source, FXCM takes all sufficient steps to eliminate or prevent any conflicts of interests arising out of the production and dissemination of this communication. The employees of FXCM commit to acting in the clients' best interests and represent their views without misleading, deceiving, or otherwise impairing the clients' ability to make informed investment decisions. For more information about the FXCM's internal organizational and administrative arrangements for the prevention of conflicts, please refer to the Firms' Managing Conflicts Policy. Please ensure that you read and understand our Full Disclaimer and Liability provision concerning the foregoing Information, which can be accessed here.