Market Threads – Oil is Slipping but Support Levels Are Key
.png)
Tracking important market threads across currencies, commodities, and indices
- Oil is facing a battle between fundamentals and momentum, and the outcome could define its next trend.
- The forces driving the USDOLLAR are shifting, and a new catalyst may be taking control.
- Gold has been a market favourite, but a powerful headwind is starting to emerge.
- The SPX500 rally has paused, could the recent pullback create the next opportunity?
Cross- Asset View
Markets rarely move in isolation, and the relationships between major asset classes are constantly evolving. Recently, important shifts have started to emerge across oil, the USDOLLAR, XAUUSD, and the SPX500 as investors reassess the forces driving global markets. Changing correlations, shifting interest-rate expectations, and renewed focus on yields are creating new opportunities and challenges across the board. Understanding how these markets are interacting may provide important clues about where momentum moves next.
Oil
Technical Analysis
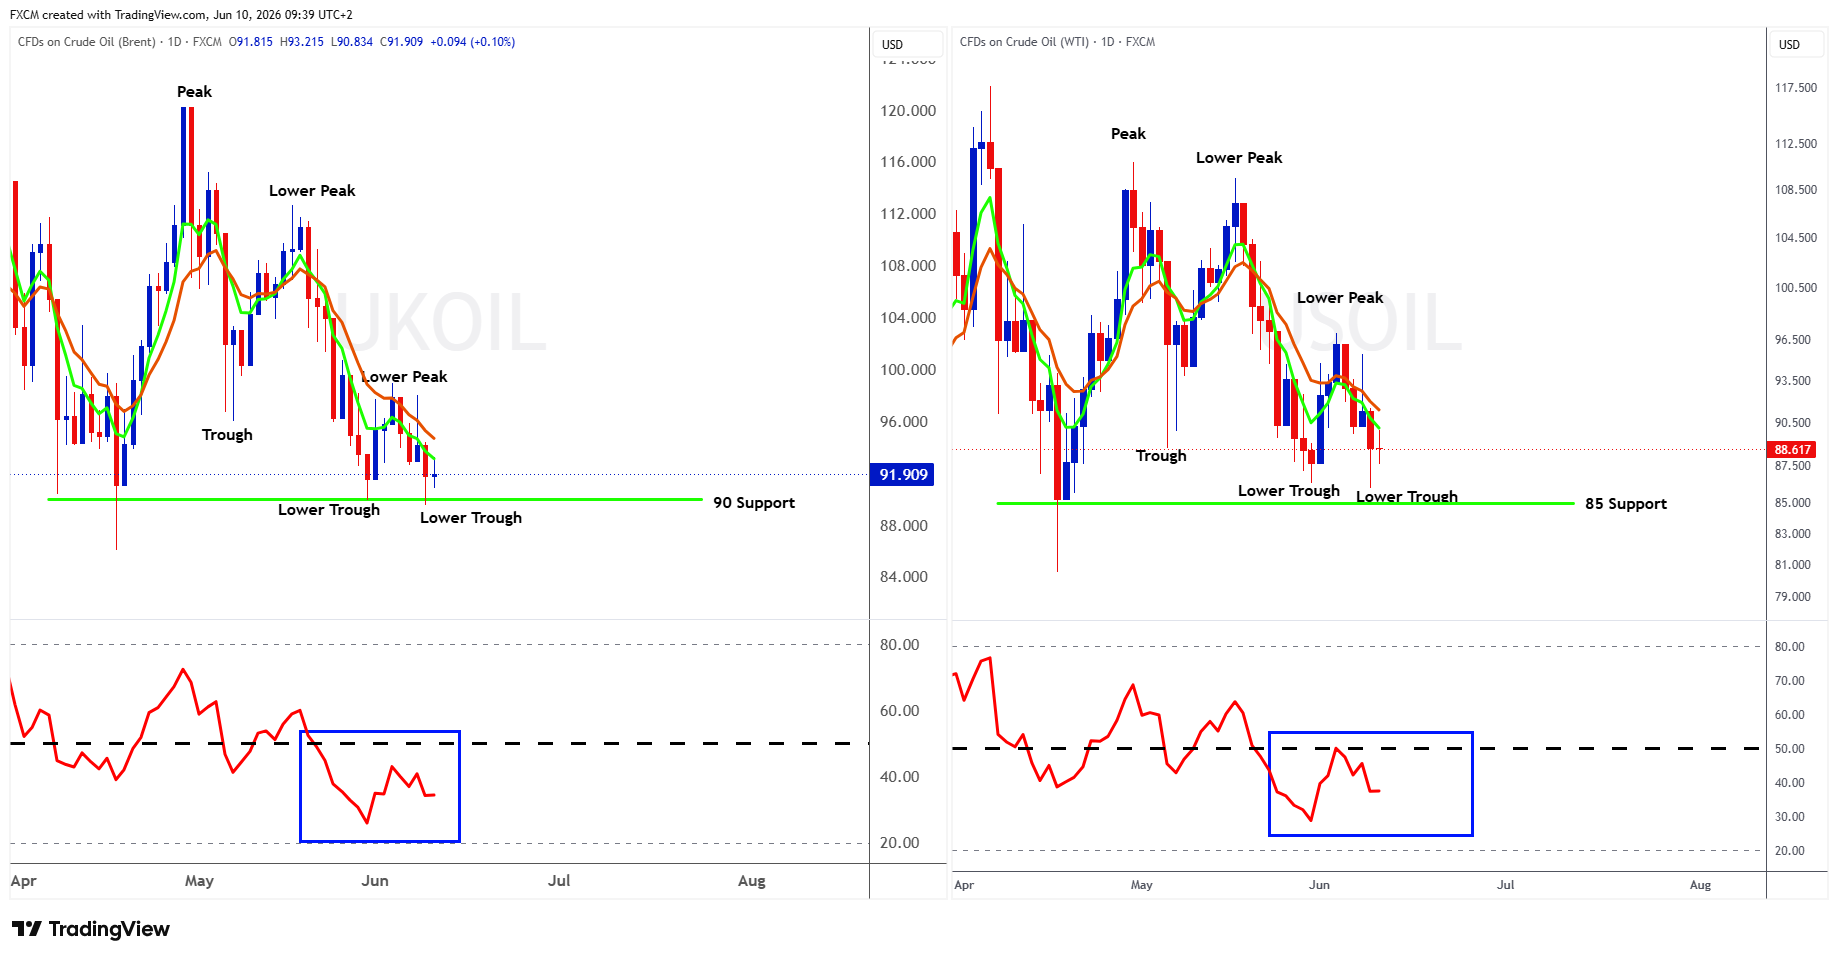
The UKOil chart is shown on the left and USOil on the right. Both charts display a lower peak followed by a lower trough, placing both instruments in a downtrend on their respective daily charts. Since last week, another lower peak has been confirmed, with both markets also registering a further lower trough in the sequence. In effect, the path of least resistance for oil appears to remain to the downside.
However, both instruments are approaching significant support areas. For UKOil, a break below the 90 level, and for USOil, a move beneath 85, would strengthen the respective downtrends. That said, breaking these levels may prove challenging.
To assess whether momentum can drive prices lower, we are closely monitoring the RSI indicators. Previously, the RSIs were oscillating around the neutral 50 level, but they now appear more inclined to remain below it. This shift suggests that underlying momentum has turned increasingly bearish. If the RSIs continue to hold below 50, the current support zones may eventually give way.
Ultimately, the underlying fundamentals of the oil market will likely determine whether this technical weakness continues or whether support levels hold.
Fundamental Perspective
The oil market remains finely balanced, reinforcing the importance of the current technical support levels.
Geopolitical uncertainty continues to provide a degree of support, with traders closely monitoring tensions in the Middle East and the risk that any escalation could threaten key energy infrastructure or disrupt important supply routes such as the Strait of Hormuz.
However, oil has struggled to build sustained upside momentum as concerns around future demand and uncertainty over the supply outlook weigh on sentiment. This has created a tug-of-war between supply risks, which could keep buyers defending key levels, and softer demand expectations, which favour the emerging technical downtrend.
Ultimately, a decisive move may depend on whether geopolitical risks tighten the market further or whether weaker demand expectations allow bearish momentum to accelerate.
The USDOLLAR
Technical Analysis
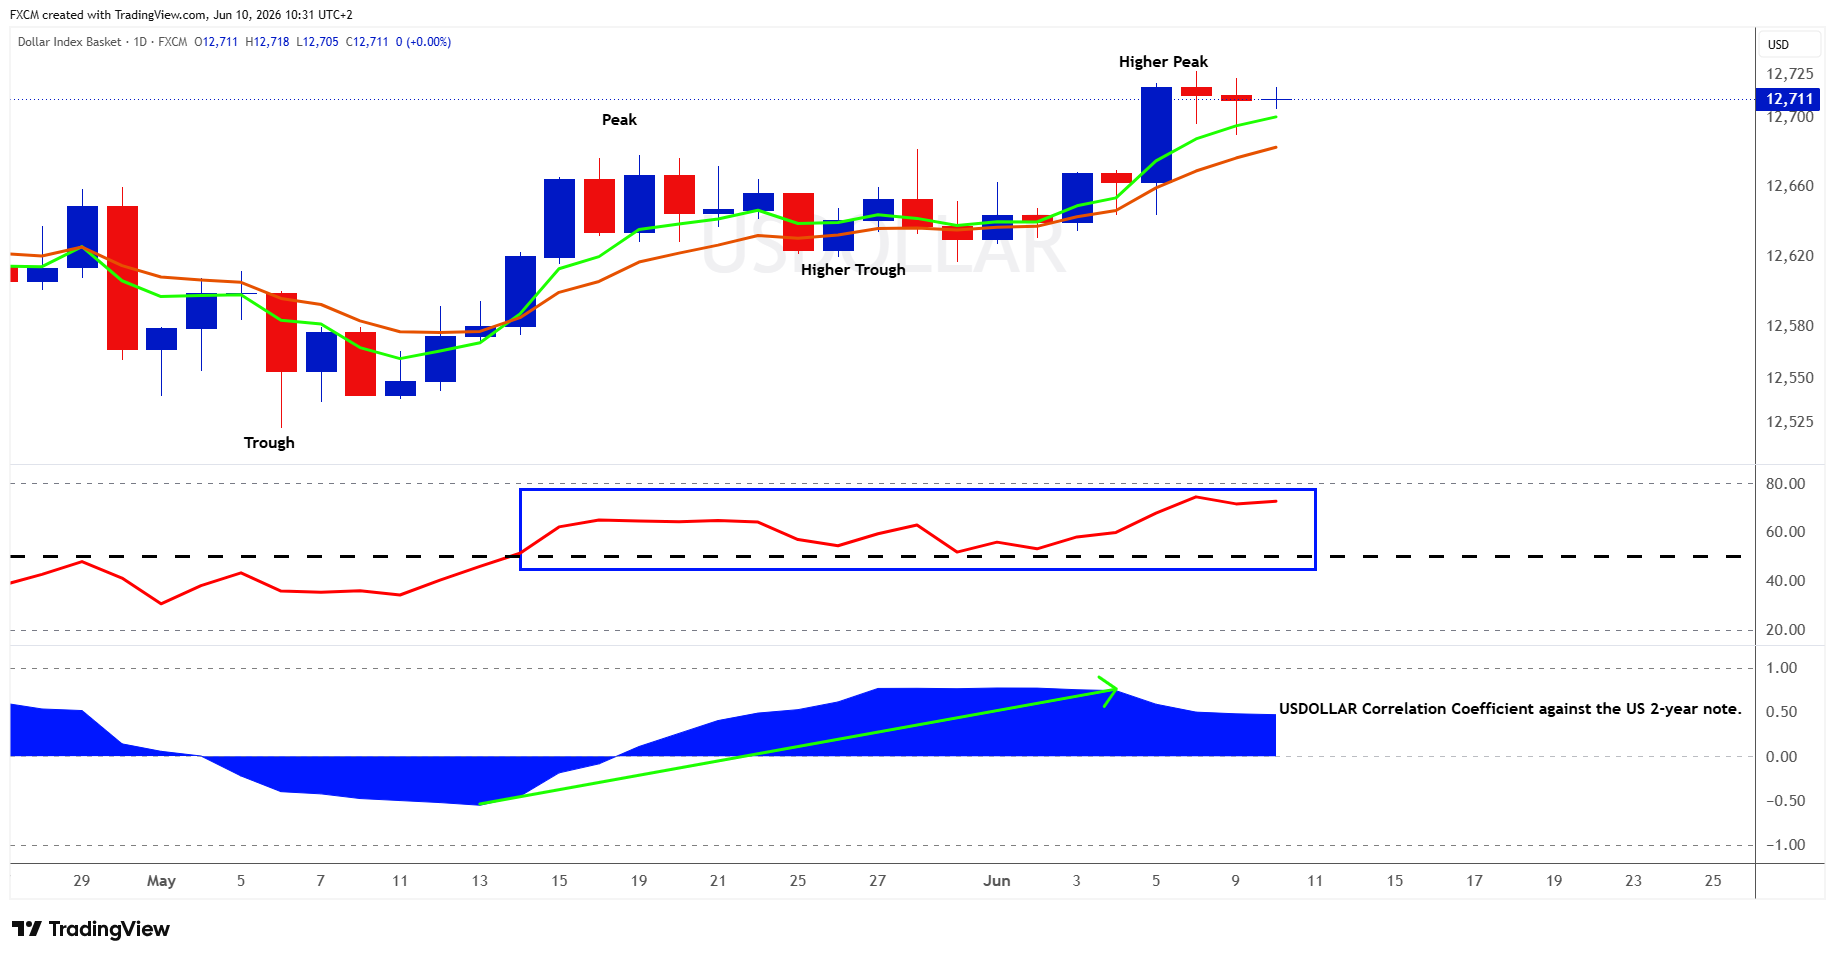
The USDOLLAR has charted a higher trough followed by a higher peak, placing the greenback in an uptrend on its daily chart. Additionally, its EMAs are in a bullish formation, displaying strong angle and separation, which reinforces the positive technical structure.
The chart's RSI also remains constructive, with the indicator holding consistently above the 50 level since mid-May. This suggests that underlying momentum for the dollar remains positive and continues to support price action.
The bottom indicator highlights that the dollar's correlation with the US 2-year note has increased significantly. Interestingly, the rise in the correlation coefficient coincided with the RSI crossing above its 50 level, marking the point where the greenback's momentum shifted into a more positive phase.
Fundamental Perspective
The USDOLLAR fundamental backdrop has become particularly interesting, with the forces driving the greenback continuing to shift. Earlier in the year, oil-market developments and geopolitical uncertainty were important influences, but correlations change, and a new driver has moved into focus, the outlook for Federal Reserve policy.
Sticky inflation, resilient economic data, and fading expectations for monetary easing have pushed US yields higher, with markets increasingly debating whether the Fed may need to maintain restrictive policy or even tighten further later this year. Higher yields tend to support the dollar by increasing the relative attractiveness of US assets.
This makes the greenback's strengthening correlation with the US 2-year note particularly significant, suggesting that interest-rate expectations have become an increasingly important force behind the dollar's improving momentum.
Gold
Technical Analysis
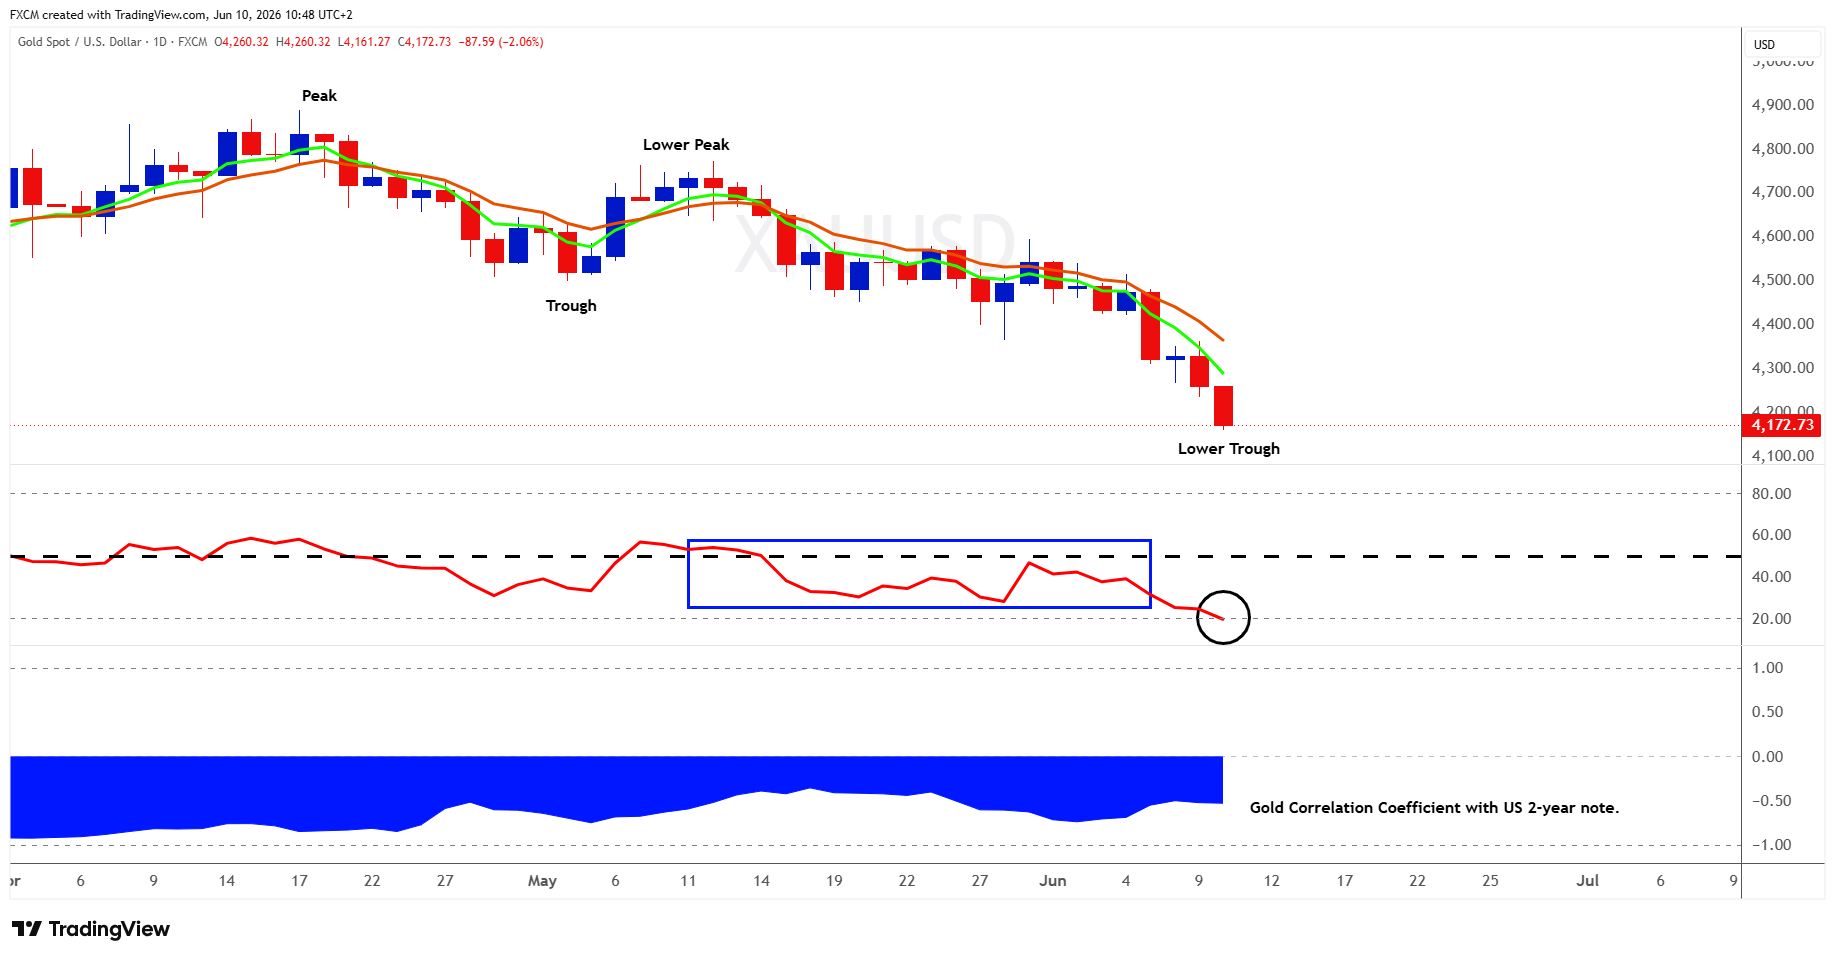
XAUUSD has charted a lower peak followed by a lower trough, placing gold in a downtrend on its daily chart. Additionally, its EMAs are in a bearish formation, displaying strong angle and separation, which reinforces the negative technical structure.
Gold's RSI continues to hold below the 50 level, indicating that underlying momentum remains bearish and supportive of further downside. However, we note that the RSI has moved below 20, a level typically associated with oversold conditions, suggesting that the precious metal may be approaching a near-term floor.
That said, any potential rebound will be important to monitor. If gold manages to bounce but the RSI remains below the 50 level, it may indicate that momentum has not meaningfully improved and could potentially set up the next leg lower.
The bottom indicator highlights XAUUSD's negative correlation with the US 2-year note. This suggests that as 2-year yields rise, gold may come under pressure, as higher yields increase the opportunity cost of holding the non-yielding precious metal.
Fundamental Perspective
The fundamental backdrop for XAUUSD has shifted as the precious metal becomes increasingly influenced by the US interest-rate outlook. While gold has historically benefited from uncertainty and geopolitical risk, recent strength in the USDOLLAR and elevated US yields have created meaningful headwinds.
Higher yields increase the opportunity cost of holding gold, as the precious metal generates no income, making interest-bearing assets relatively more attractive. This makes gold's negative correlation with the US 2-year note particularly important, as expectations for a more restrictive Federal Reserve have supported yields and weighed on bullion.
While geopolitical uncertainty may provide periods of support, sustained strength in the dollar and elevated yields remain the key obstacles for gold and continue to reinforce the current bearish technical structure.
Another Metal to Keep an Eye on: Copper
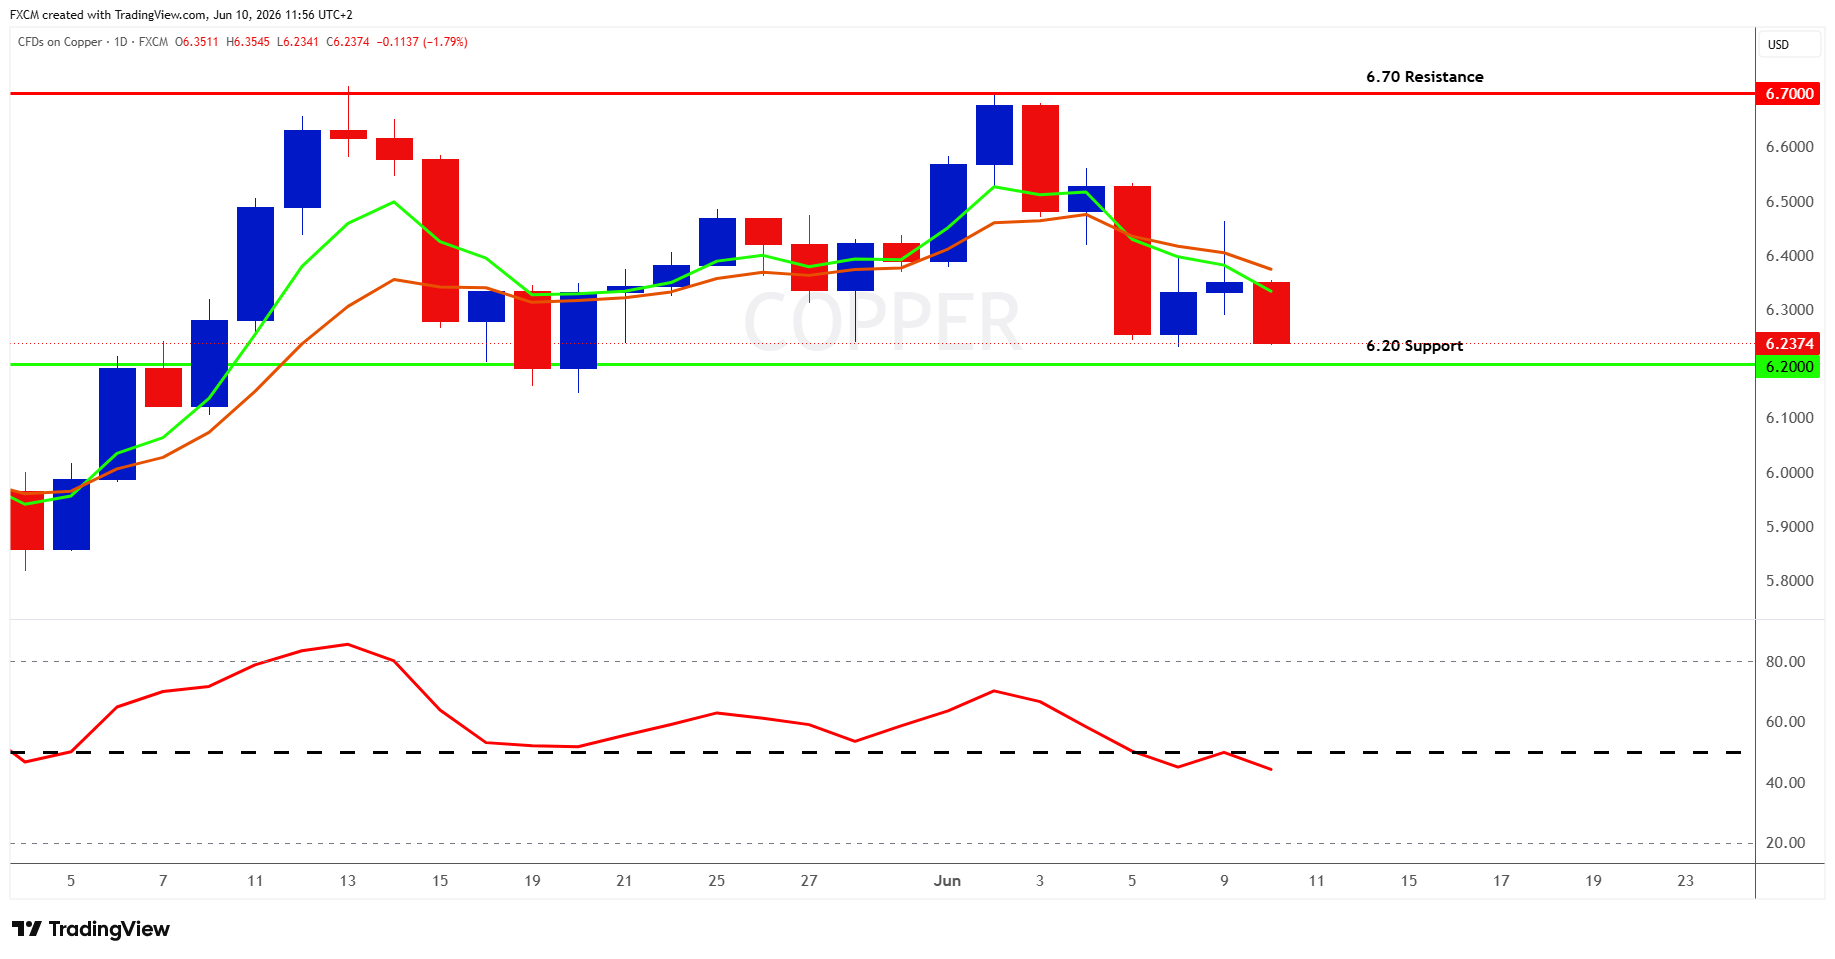
Last week, we highlighted that copper was facing resistance around the 6.70 level. This resistance held, resulting in the red metal pulling back and moving towards support near the 6.20 level.
Once again, we want to be guided by momentum. Currently, the RSI is trading below the 50 level, suggesting that short-term momentum remains under pressure. However, a move back above 50 could indicate that buyers are returning and that demand for copper is starting to improve.
Such a shift would be particularly important, as it may suggest investors are stepping back in to support the broader uptrend.
The fundamental backdrop for copper remains constructive, with the metal increasingly benefiting from its role in the artificial intelligence infrastructure buildout.
Traditionally driven by global industrial activity and Chinese demand, copper is gaining a new growth narrative as AI data centres, semiconductor expansion, power grids, and electrification create additional sources of demand. This has helped strengthen copper's relationship with technology-related assets, with investors increasingly viewing the metal as a critical component of the AI supply chain.
However, copper remains sensitive to broader macro conditions, including global growth expectations, the USDOLLAR, and interest rates. For now, resilient economic data, AI optimism, and longer-term supply constraints continue to support the copper story, suggesting that pullbacks may be viewed as opportunities as long as the structural demand outlook remains intact.
Index in Focus: SPX500
Technical Analysis
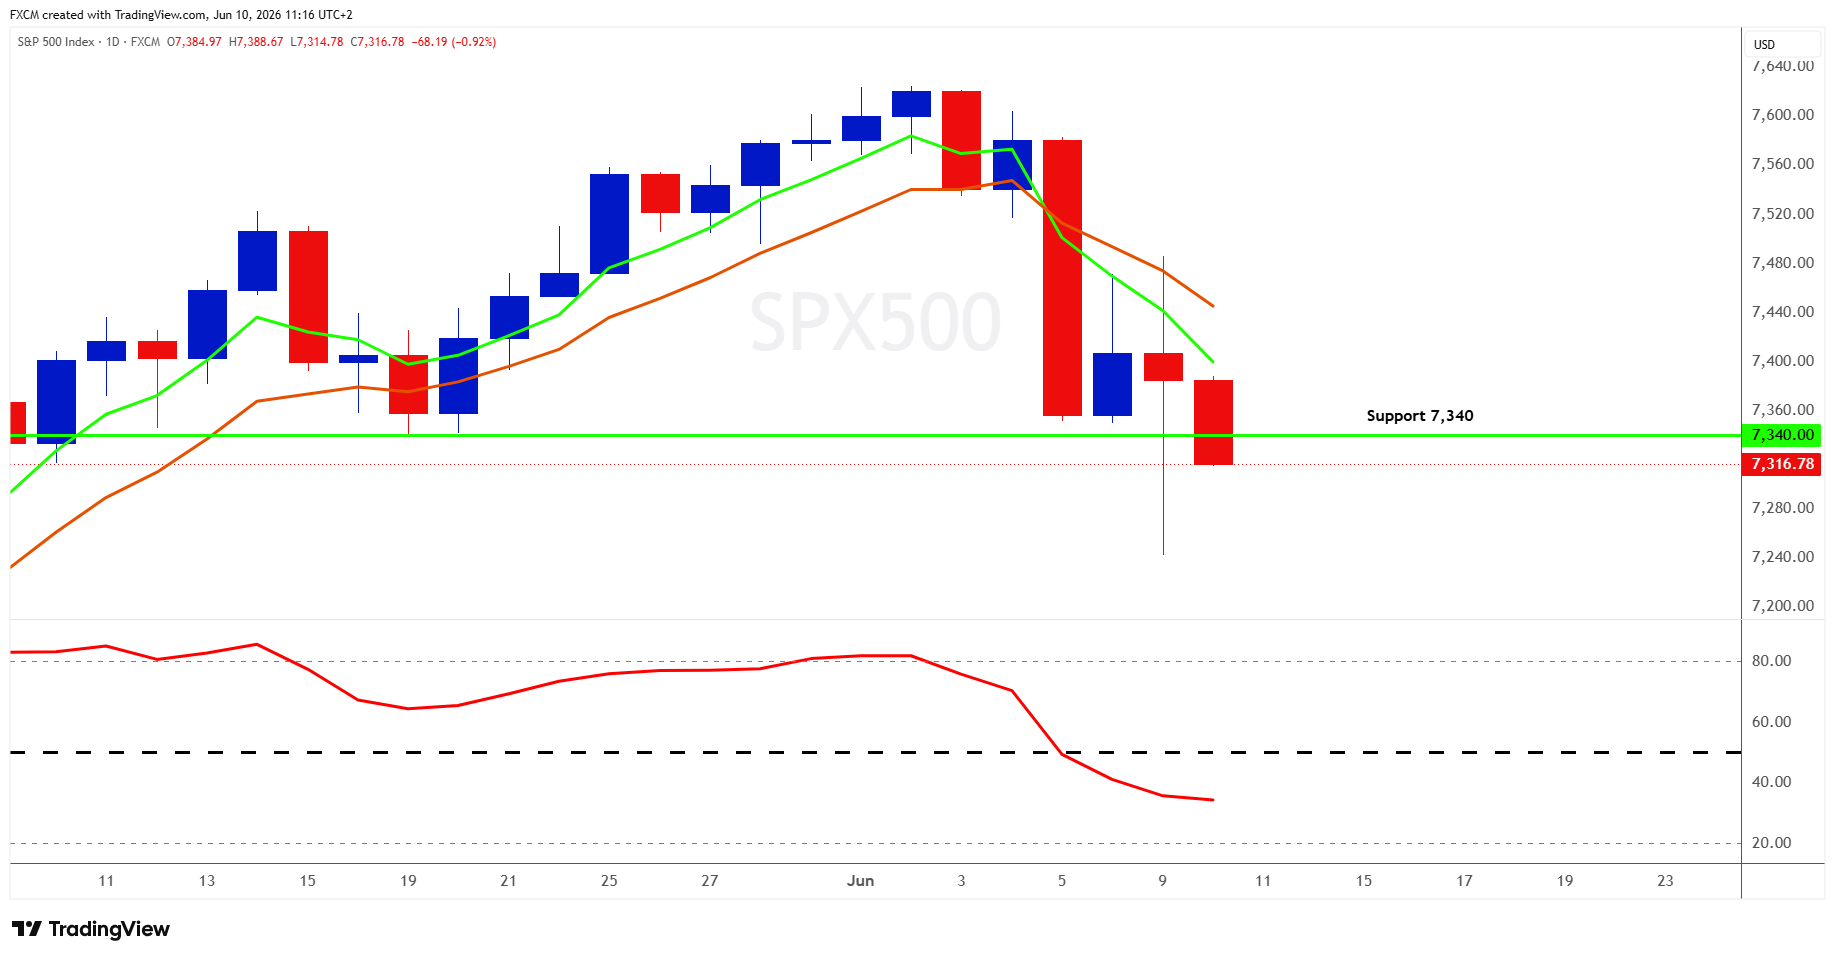
Last week, we suggested that the SPX500 was showing signs of being overbought. Since then, those conditions have eased, with the index pulling back from its recent highs. We note that the retracement has brought the SPX500 back towards the 7,340 support level, where it is currently being tested.
The RSI has moved below the 50 level, suggesting that short-term momentum has weakened. If the indicator remains below 50, this support area may come under increasing pressure.
Nevertheless, the primary trend of the SPX500 remains to the upside. As such, the RSI will be an important indicator to monitor. A move back above 50 may suggest that buyers are returning and that the recent weakness is attracting renewed demand.
In other words, if the broader uptrend remains intact, the current pullback may provide an opportunity for investors to enter the index at more attractive levels.
Fundamental Perspective
The fundamental backdrop for the SPX500 remains constructive, although the recent pullback highlights the market's sensitivity to interest-rate expectations.
Corporate America continues to perform well, with exceptional AI-related earnings and investment remaining one of the key drivers supporting the broader equity market. At the same time, easing oil prices and reduced geopolitical concerns have helped improve risk sentiment.
However, Friday's stronger jobs data triggered the recent weakness as Treasury yields moved higher, with investors reassessing whether the Federal Reserve may need to keep policy restrictive for longer.
This matters because if higher yields remain elevated, they can become a headwind for equities because companies pay more to borrow, consumers may spend less, and future earnings are discounted at higher rates, placing pressure on stock valuations.
For now, strong earnings remain supportive, but the battle between AI-driven growth and the direction of yields is likely to determine whether investors continue buying the dip.
Russell Shor
Senior Market Strategist
Russell Shor is a Senior Market Strategist at FXCM, having been promoted to the role in 2025 in recognition of his depth of insight and consistent delivery of high-impact market analysis. He originally joined FXCM in October 2017 as a Senior Market Specialist.
Russell holds an Honours Degree in Economics from the University of South Africa, is a certified FMVA®, and a full member of the Society of Technical Analysts (UK). With over 20 years of experience in financial markets, his work is renowned for its clarity, precision, and strategic value across asset classes.
Any opinions, news, research, analyses, prices, other information, or links to third-party sites contained on this website are provided on an "as-is" basis, as general market commentary and do not constitute investment advice. The market commentary has not been prepared in accordance with legal requirements designed to promote the independence of investment research, and it is therefore not subject to any prohibition on dealing ahead of dissemination. Although this commentary is not produced by an independent source, FXCM takes all sufficient steps to eliminate or prevent any conflicts of interests arising out of the production and dissemination of this communication. The employees of FXCM commit to acting in the clients' best interests and represent their views without misleading, deceiving, or otherwise impairing the clients' ability to make informed investment decisions. For more information about the FXCM's internal organizational and administrative arrangements for the prevention of conflicts, please refer to the Firms' Managing Conflicts Policy. Please ensure that you read and understand our Full Disclaimer and Liability provision concerning the foregoing Information, which can be accessed here.