Market Threads – Oil Prices Continue to Drop but Short Yields Are On The Rise
.png)
Tracking important market threads across currencies, commodities, and indices.
- Short-term rates are rising, long-term yields are falling, what is the Treasury market trying to tell investors?
- Oil's latest move could change the inflation conversation, but the story may not be that simple.
- The USDOLLAR's latest move is putting the spotlight back on the Federal Reserve and the path ahead for interest rates.
- SPX500 reaches an important turning point as rate expectations reshape the outlook.
Cross-Asset View
Markets are being driven by a repricing of Federal Reserve expectations, with the rise in the policy-sensitive US 2-year Treasury yield supporting the dollar while creating pressure across rate-sensitive assets. The bear flattening of the yield curve reflects expectations for tighter monetary policy while also signalling concerns that restrictive conditions could eventually weigh on growth. This environment has pressured gold through higher yields and dollar strength, created headwinds for the SPX500 through valuation and earnings concerns, while lower oil prices, if sustained, could ease headline inflation pressures and influence the future path of Fed policy.
Yield Curve: Bear Flattener
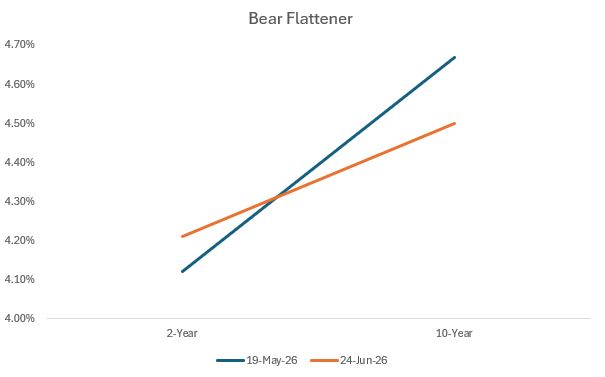
The US Treasury market has sent an interesting signal over the past month, with the yield curve flattening (blue curve to orange curve) as investors reassess the outlook for interest rates and growth. Since 19 May, the 2-year Treasury yield has edged higher from 4.12% to 4.21%, while the 10-year yield has declined from 4.67% to 4.50%, narrowing the spread between the two from roughly 55 basis points to 29 basis points.
The move highlights the tension currently facing markets. On the one hand, stubborn inflation pressures and resilient economic data have increased expectations that the Federal Reserve may need to maintain a tighter policy stance, with investors now considering the possibility of additional rate hikes later this year. Current market pricing suggests the potential for two 25 basis point increases, with one move around the September FOMC meeting and another by December.
On the other hand, the decline in longer-term yields suggests markets are also looking further ahead and questioning whether tighter policy could eventually cool economic momentum. The message from bonds is not necessarily that a downturn is imminent, but rather that the path to a soft landing may be becoming more complicated.
Oil
.png)
Technical Analysis
Technically, both UKOil (left) and USOil (right) remain under pressure, with the charts showing clear bearish trend structures despite recent geopolitical volatility.
UKOil (left chart)
Brent continues to trade within a well-defined downtrend, characterised by a sequence of lower peaks and lower troughs. After failing to regain momentum above the moving averages, price rolled over again, with both the short-term and longer-term moving averages now sloping lower. The latest move has pushed Brent towards the $76 area, where sellers remain in control.
Momentum indicators reinforce the weakness. The RSI has fallen into oversold territory, highlighting the strength of the recent decline. While this raises the possibility of a short-term relief bounce, there is currently limited evidence for a reversal. A break back above the moving averages and the most recent lower peak would be needed to suggest that bearish momentum is fading.
USOil (right chart)
WTI shows a similar technical picture, with a sustained pattern of lower highs and lower lows confirming downside pressure. The failed recovery attempt in early June created another lower peak before price accelerated lower, breaking beneath previous support areas and extending towards the low-$70 region.
The RSI is also approaching oversold conditions, suggesting that selling pressure may be stretched in the near term. However, oversold readings during strong trends can persist, and the broader structure remains bearish while price stays below declining moving averages.
Overall Technical View
The trend remains firmly negative across both Brent (UKOil) and WTI (USOil), with sellers maintaining control through a combination of falling moving averages, bearish price structure, and weak momentum. A short-term bounce cannot be ruled out due to oversold RSI conditions, but for now any recovery would likely be viewed as corrective unless oil can establish a higher low and break the sequence of lower peaks.
Fundamental Perspective
Oil prices have moved sharply lower as the geopolitical risk premium linked to Middle East supply disruption has eased, with markets reassessing the likelihood of a prolonged interruption to crude flows through the Strait of Hormuz.
Improved supply expectations have shifted attention back toward underlying fundamentals, including global demand trends and inventory levels. From a macro perspective, weaker crude prices are potentially disinflationary, as lower energy costs can reduce headline inflation through fuel, transportation, and input costs, easing some pressure on consumers and businesses.
However, central banks are likely to remain cautious, as the inflation benefit depends on whether lower energy prices are sustained and whether broader underlying inflation pressures can moderate.
The USDOLLAR
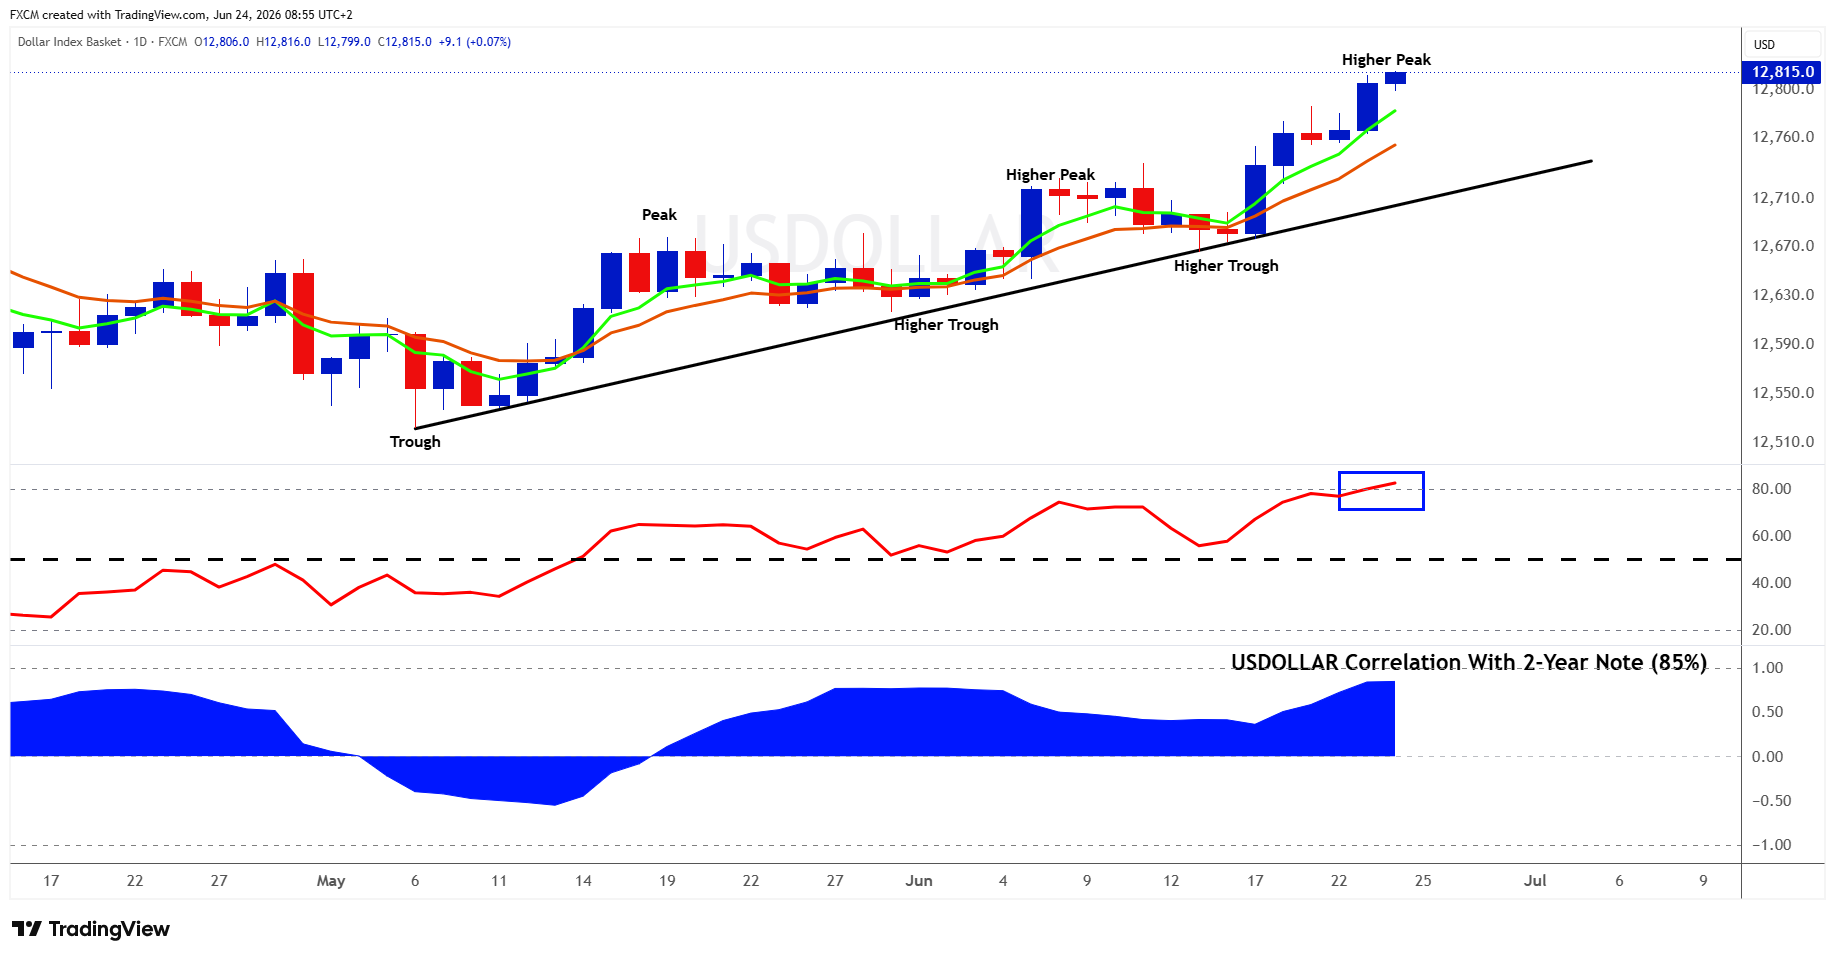
Technical Analysis
The USDOLLAR remains in a clear uptrend, with the chart showing a constructive bullish structure. After establishing a trough in early May, price has continued to form a sequence of higher troughs and higher peaks, confirming that buyers remain in control. The rising trendline remains intact, while price continues to trade above both the short-term and longer-term moving averages, which are now sloping higher and reinforcing the positive momentum.
The latest breakout has pushed the USDOLLAR towards the 12,800 area, creating another higher peak and extending the current rally. This suggests that demand for the dollar remains strong, with previous resistance areas now potentially acting as support should a pullback develop.
Momentum indicators support the bullish trend, although they also highlight some short-term caution. The RSI has moved into overbought territory, reflecting the strength of the recent move but also suggesting that upside momentum may be stretched. While this could lead to a period of consolidation or a short-term pullback, overbought conditions can persist during strong trending markets.
The correlation with the 2-year Treasury note remains strongly positive (around 85%), suggesting that the dollar continues to be heavily influenced by interest-rate expectations. As long as short-term yields remain supported and the technical structure of higher peaks and higher troughs stays intact, the broader trend remains favourable for the USDOLLAR. A break below the rising trendline and the most recent higher trough would be needed to indicate a potential shift in momentum.
Fundamental Perspective
The USDOLLAR has been supported by rising short-term interest-rate expectations, with the policy-sensitive 2-year Treasury yield moving towards the 4.2% region as investors reassess the Federal Reserve's policy path. Persistent inflation pressures and resilient economic data have increased expectations that the Fed may need to maintain a restrictive stance for longer, with markets pricing the possibility of additional 25 basis point rate increases around the September and December meetings.
This shift has contributed to a bear flattening of the Treasury yield curve, as shorter-term yields have risen relative to longer-term yields, reflecting tighter policy expectations while also signalling that investors are considering the potential impact of higher rates on future economic growth. For the dollar, elevated US yields remain supportive by improving relative rate differentials versus other major currencies.
Some Currencies to Keep an Eye on
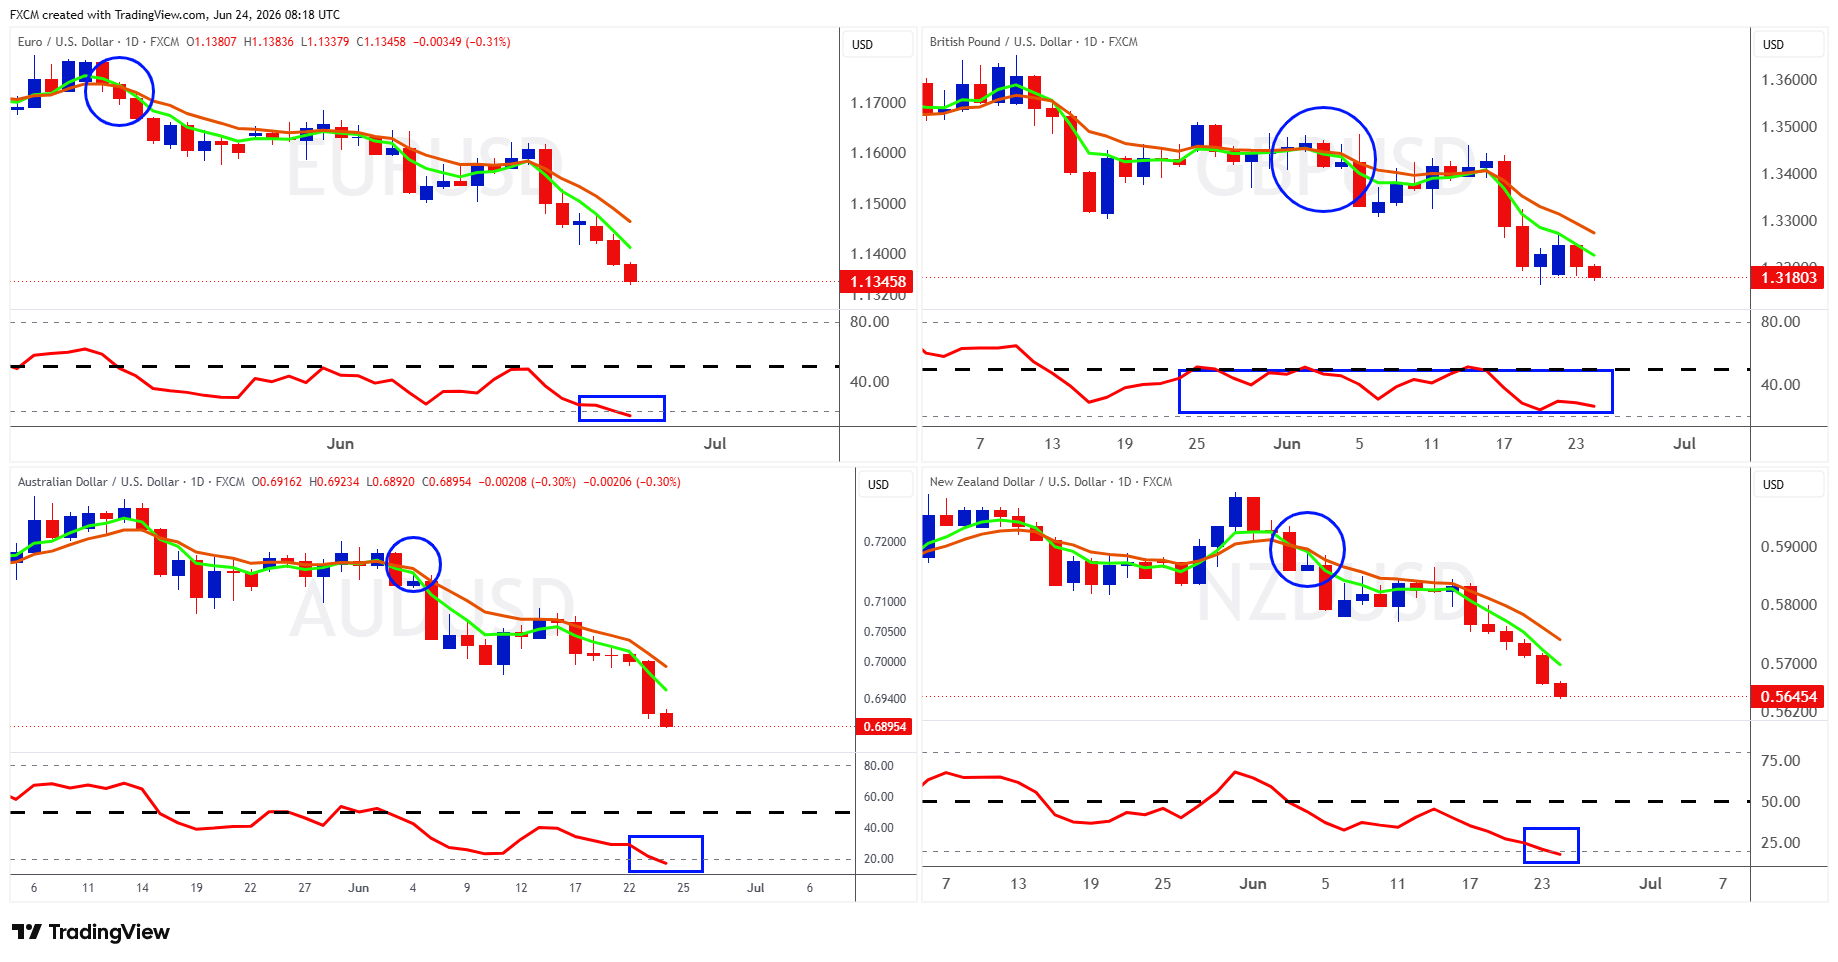
EURUSD, GBPUSD, AUDUSD and NZDUSD remain under pressure, with all four currency pairs showing a clear deterioration in technical structure. Prices continue to trade below declining short-term and longer-term moving averages, while failed recovery attempts have resulted in renewed selling pressure. The broader trend remains negative, with the crosses continuing to form bearish structures as sellers maintain control.
EURUSD has extended its decline towards the 1.1350 area, while GBPUSD has weakened towards the 1.3180 region. The commodity-linked AUDUSD and NZDUSD have experienced particularly sharp declines, reflecting both broader dollar strength and weaker risk appetite. Momentum indicators confirm the downside pressure, with RSI readings moving into or towards oversold territory across several pairs.
A major driver behind this weakness has been the continued strength of the US dollar, supported by rising US interest-rate expectations. The policy-sensitive US 2-year Treasury yield has moved towards the 4.2% region, as persistent inflation concerns and resilient economic data have led investors to reassess the Federal Reserve outlook. Markets are considering the possibility that monetary policy may need to remain restrictive for longer, including potential additional 25 basis point rate increases later this year around the September and December meetings.
Higher US yields have supported the dollar through improved relative interest-rate differentials, placing pressure on major currencies where policy expectations are comparatively less supportive. This has been evident in EURUSD, where diverging Fed and ECB expectations have weighed on the euro, while risk-sensitive currencies such as the Australian and New Zealand dollars have also struggled in an environment of tighter financial conditions.
Given the strength of the dollar rally and the USDOLLAR index reaching technically overbought conditions, it is not surprising to see several USD crosses moving into oversold territory. While this could increase the probability of short-term consolidation or corrective rebounds, the broader trend remains dollar supportive while US front-end yields stay elevated and expectations for tighter Federal Reserve policy remain in place.
Gold
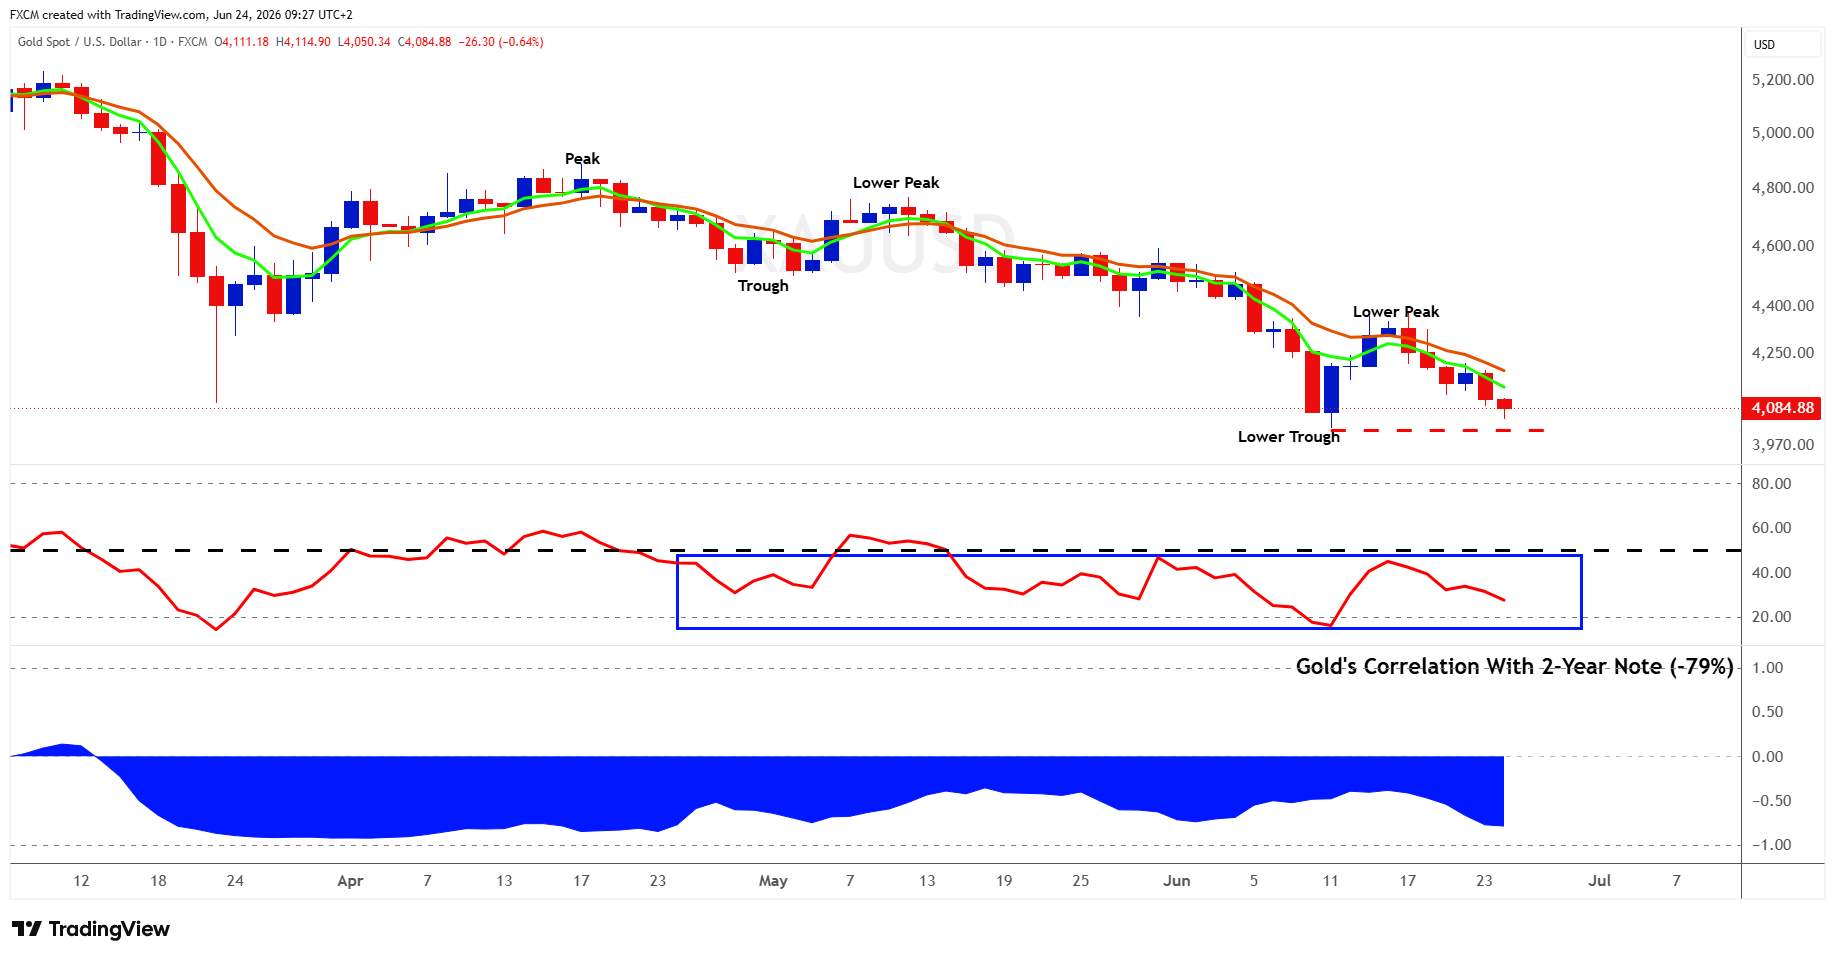
Technical Analysis
Gold remains under pressure, with the chart showing a clear bearish trend structure developing over recent months. After reaching a peak earlier in the period, price has consistently formed a sequence of lower peaks and lower troughs, confirming that sellers remain in control. Each recovery attempt has failed at lower levels, with the latest rebound unable to regain the moving averages before rolling over again.
XAUUSD is currently trading around the $4,080 area, close to its recent lower trough support zone near $4,000. A decisive break below this area would confirm a continuation of the downtrend and suggest that downside momentum remains dominant. Conversely, gold would need to reclaim the moving averages and break above the most recent lower peak to indicate that bearish pressure is beginning to ease.
Momentum indicators support the cautious outlook. The RSI has remained below the neutral 50 level for most of the recent decline, highlighting weaker momentum and a lack of sustained buying pressure. However, the RSI has not yet reached extreme oversold conditions, suggesting that sellers may still have room to maintain control before a stronger relief bounce develops.
The correlation with the US 2-year Treasury note remains strongly negative (around -79%), reinforcing gold's sensitivity to interest-rate expectations. Rising short-term yields increase the opportunity cost of holding non-yielding assets such as gold, creating a headwind for the metal. As long as 2-year yields remain elevated and gold continues to produce lower peaks and lower troughs, the technical outlook remains biased to the downside. A reversal would require a break in this structure and evidence that buyers are regaining control.
Fundamental Perspective
Gold has come under pressure as rising US interest-rate expectations have supported the dollar and increased the opportunity cost of holding a non-yielding asset. The policy-sensitive 2-year Treasury yield has moved towards the 4.2% region, reflecting a reassessment of the Federal Reserve outlook as persistent inflation pressures and resilient economic data have increased expectations that monetary policy may need to remain restrictive for longer.
Markets are now considering the possibility of additional 25 basis point rate increases later this year, including around the September and December meetings. This creates a further headwind for the yellow metal. While this environment remains challenging for gold, evidence that inflation pressures are easing could reduce rate expectations and potentially improve the outlook for the precious metal.
Index in Focus: SPX500
Technical Analysis
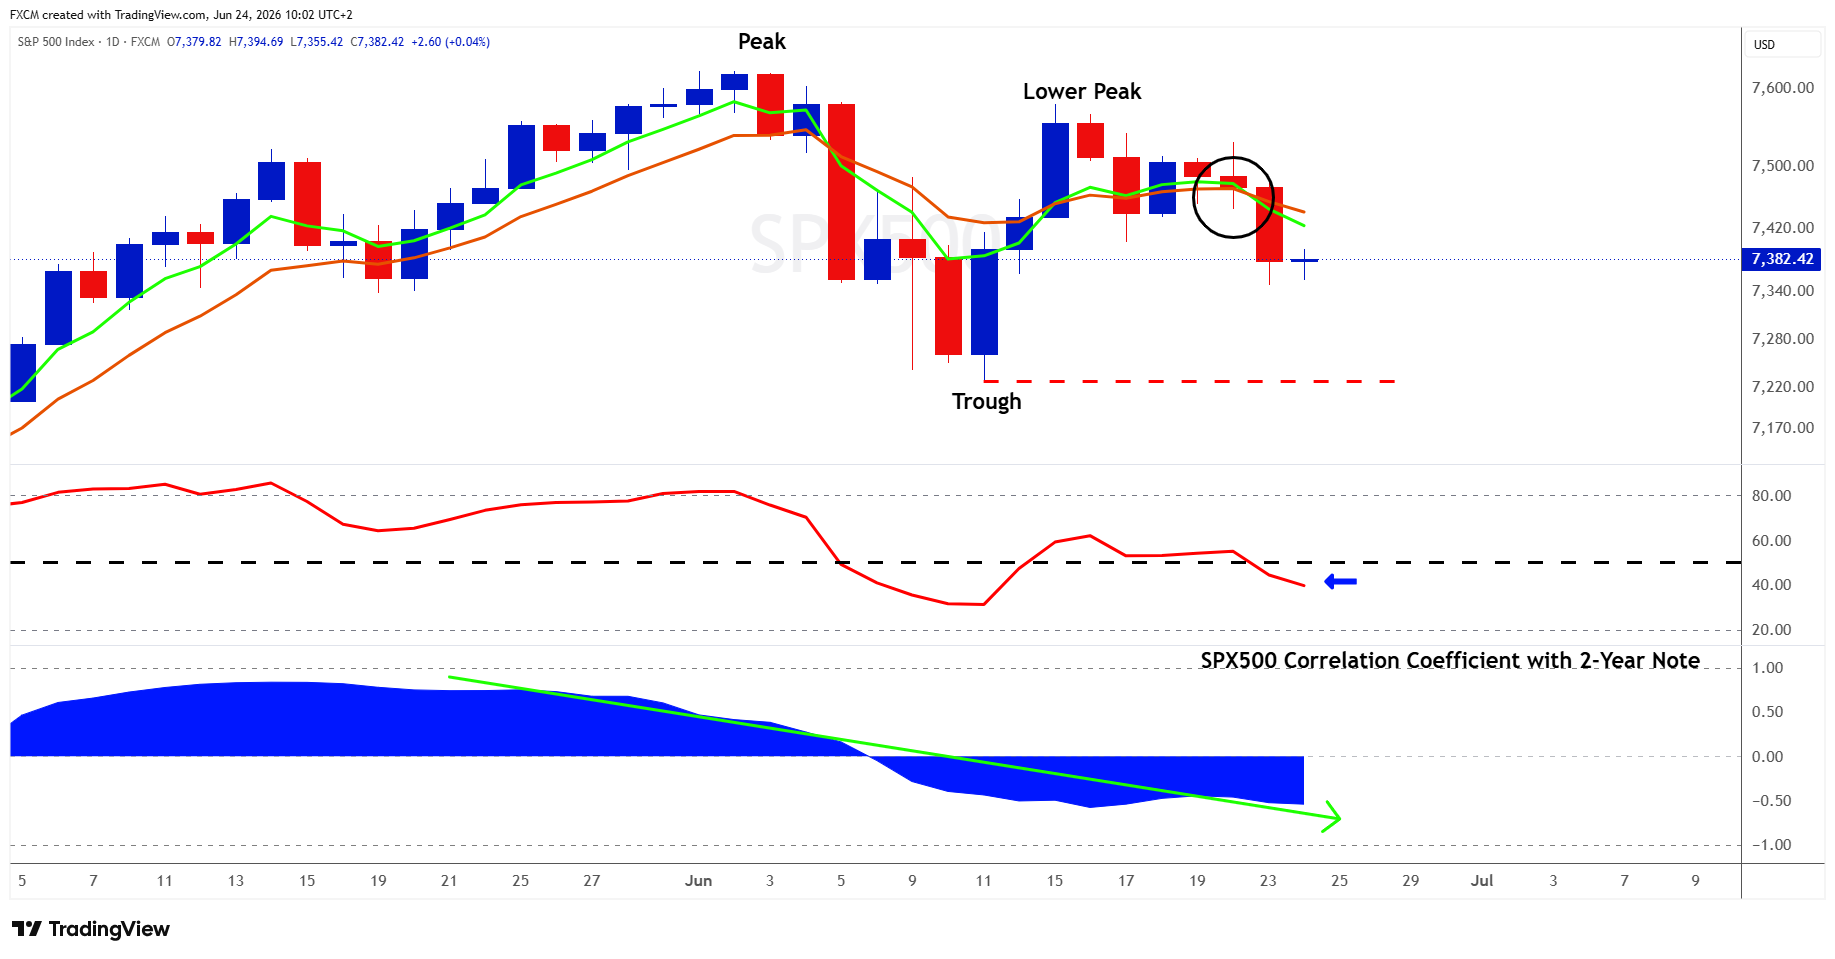
The SPX500 is showing signs of technical deterioration, with the previous bullish structure beginning to weaken. After establishing a peak in early June, price failed to extend the uptrend and has since formed a lower peak, suggesting that upside momentum has started to fade. The recent rejection around the moving averages and subsequent move lower indicate that sellers are becoming more active at lower levels.
Price has now slipped below both the short-term and longer-term moving averages, which are beginning to turn lower. This suggests a loss of positive momentum and raises the risk of a deeper pullback. However, the broader structure has not yet fully turned bearish, as the index remains above the previous major trough around the 7,200 area. A decisive break below this level would confirm a sequence of lower peaks and lower troughs, strengthening the bearish case.
Momentum indicators also reflect the weaker environment. The RSI has moved below the neutral 50 level, showing that buying pressure has faded and sellers currently have the short-term advantage. While the RSI is not yet oversold, the loss of momentum suggests investors have become more cautious following the recent rally.
The relationship with the US 2-year Treasury note has also shifted, with the correlation moving negative. This suggests that the SPX500 has become increasingly sensitive to changes in interest-rate expectations. Rising short-term yields and expectations of a more restrictive Federal Reserve stance have created a headwind for equities, as higher discount rates can pressure valuations, particularly after strong market gains.
Overall, the SPX500 is at an important technical point. The longer-term trend has not completely broken down, but the combination of a lower peak, weakening momentum, and pressure from elevated short-term yields suggests that the index may need to defend support around the previous trough to avoid confirming a broader bearish reversal.
Fundamental Perspective
The SPX500 has come under pressure as investors reassess the impact of a potentially more restrictive Federal Reserve policy path. The policy-sensitive US 2-year Treasury yield has moved towards the 4.2% region, reflecting expectations that persistent inflation pressures and resilient economic data may require interest rates to remain higher for longer, with markets considering the possibility of additional 25 basis point rate increases later this year, including around the September and December meetings.
For equities, higher rates can create several headwinds: companies with floating-rate debt or upcoming refinancing needs may face increased interest expenses, pressuring earnings; higher borrowing costs can weigh on consumer demand and potentially impact revenue growth; and higher discount rates reduce the present value of future cash flows used in valuation models, placing pressure on equity multiples.
The recent bear flattening of the Treasury yield curve, driven by shorter-term yields rising relative to longer-term yields, highlights that markets are pricing the risk of tighter Fed policy while also questioning whether restrictive conditions could eventually slow economic growth.
This combination of higher front-end yields, earnings uncertainty, and valuation pressure helps explain the recent weakness in the SPX500, particularly after a strong rally left risk assets more sensitive to changes in interest-rate expectations.
Russell Shor
Senior Market Strategist
Russell Shor is a Senior Market Strategist at FXCM, having been promoted to the role in 2025 in recognition of his depth of insight and consistent delivery of high-impact market analysis. He originally joined FXCM in October 2017 as a Senior Market Specialist.
Russell holds an Honours Degree in Economics from the University of South Africa, is a certified FMVA®, and a full member of the Society of Technical Analysts (UK). With over 20 years of experience in financial markets, his work is renowned for its clarity, precision, and strategic value across asset classes.
Any opinions, news, research, analyses, prices, other information, or links to third-party sites contained on this website are provided on an "as-is" basis, as general market commentary and do not constitute investment advice. The market commentary has not been prepared in accordance with legal requirements designed to promote the independence of investment research, and it is therefore not subject to any prohibition on dealing ahead of dissemination. Although this commentary is not produced by an independent source, FXCM takes all sufficient steps to eliminate or prevent any conflicts of interests arising out of the production and dissemination of this communication. The employees of FXCM commit to acting in the clients' best interests and represent their views without misleading, deceiving, or otherwise impairing the clients' ability to make informed investment decisions. For more information about the FXCM's internal organizational and administrative arrangements for the prevention of conflicts, please refer to the Firms' Managing Conflicts Policy. Please ensure that you read and understand our Full Disclaimer and Liability provision concerning the foregoing Information, which can be accessed here.