
AlphaTrack – SPX500 Closes in on Record Highs


Thoughtful insights and approachable analysis.
- AMD earnings could trigger the next big move, with a strong AI outlook opening the door to a breakout above $500 and a run towards $545.
- Has Disney's 13.5% sell-off this year created a value opportunity? Earnings could provide the answer, with a break above $100 opening the door to $104.
- US.BANKS is lining up for a potential breakout, powered by strong earnings, improving loan growth and generous capital returns.
Quick Market Overview
US stocks began August strongly, with the Dow reaching a record high as easing oil prices and renewed enthusiasm for the largest technology companies lifted sentiment. The Magnificent Seven added nearly $1.8 trillion in market value over three sessions, while Amazon crossed the $3 trillion mark. Better-than-expected earnings growth, rising investment and stronger revenue pipelines have supported the rally, with upcoming results from Disney, AMD and SpaceX set to test whether the momentum can continue.
General Equity Market Health (SPX500)
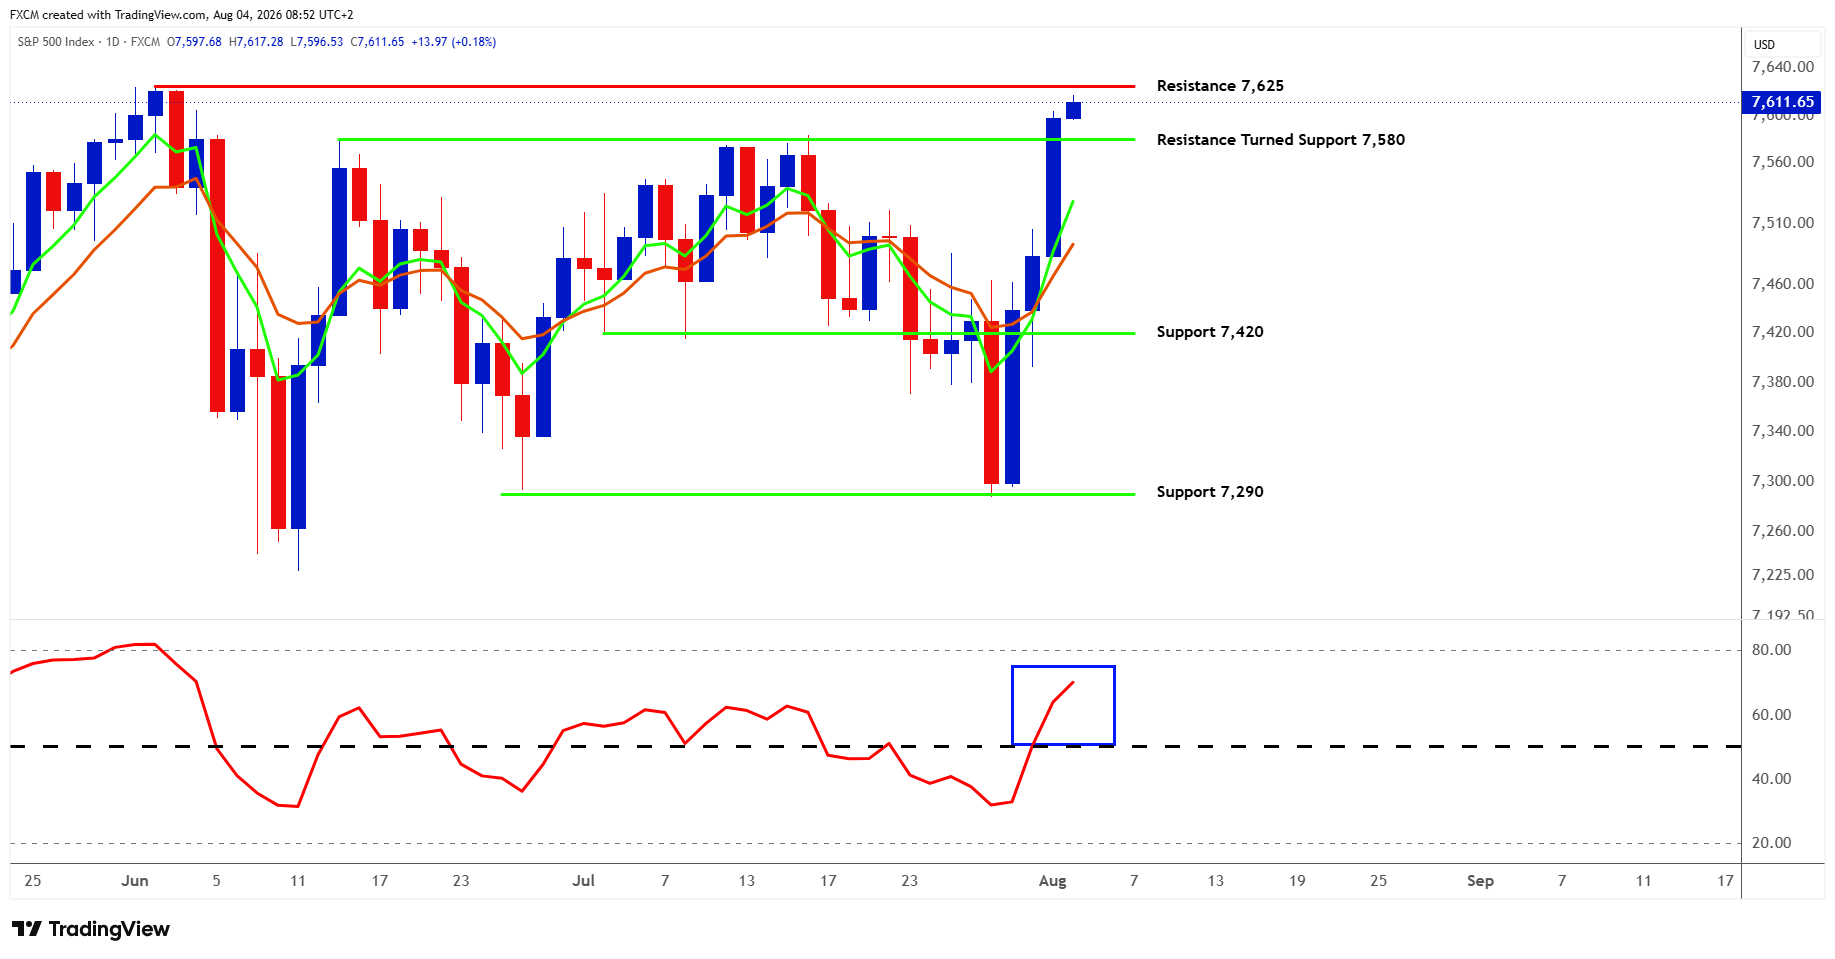
The S&P 500 has rebounded sharply from the 7,290 support area and broken above the former 7,580 resistance zone, with price now holding above both short-term moving averages as they turn higher. Momentum has strengthened noticeably, with the RSI rising above 50, although that rapid acceleration suggests the market may be becoming stretched in the near term. The next major test is 7,625, which marks the previous high: a confirmed daily close above it would complete the breakout and place the index in fresh-high territory. A rejection could bring a pullback towards 7,580, where a successful retest would strengthen the bullish case, while a close back below that level would weaken the breakout and increase the risk of a deeper decline towards 7,420.
A combination of oil-price relief and strong corporate earnings is supporting the market. FXCM's UKOil contract fell 5% yesterday after President Trump postponed further attacks on Iran and cited peace talks, pulling Treasury yields lower and helping the SPX500 rise 1.5%, with technology-related shares leading the advance, even though Tehran denied that negotiations were taking place.
Earnings are providing solid support, even if FactSet's headline Q2 growth rate of 47.4% is flattered by unusually large investment gains at Alphabet and Amazon. Excluding those two companies, earnings still grew by an impressive 28.8%. The July manufacturing PMI of 55.6, together with the first rise in factory employment in 33 months, also points to a resilient economy.
However, high input costs and growing expectations of a Fed rate increase remain a headwind for equity valuations. The move towards 7,625 therefore reflects strong profits and temporary relief from lower oil prices and bond yields, but with both now rebounding, the S&P 500 may need a more lasting easing of geopolitical and inflation pressures before a breakout can be trusted.
Potential Trade Setups
AMD, Disney and US.BANKS are approaching key technical and fundamental inflection points, with earnings, momentum and breakout levels all set to shape the next move. Each offers a different setup, but all three could become compelling if the market confirms the underlying story.
Advanced Micro Devices Inc. (AMD.us)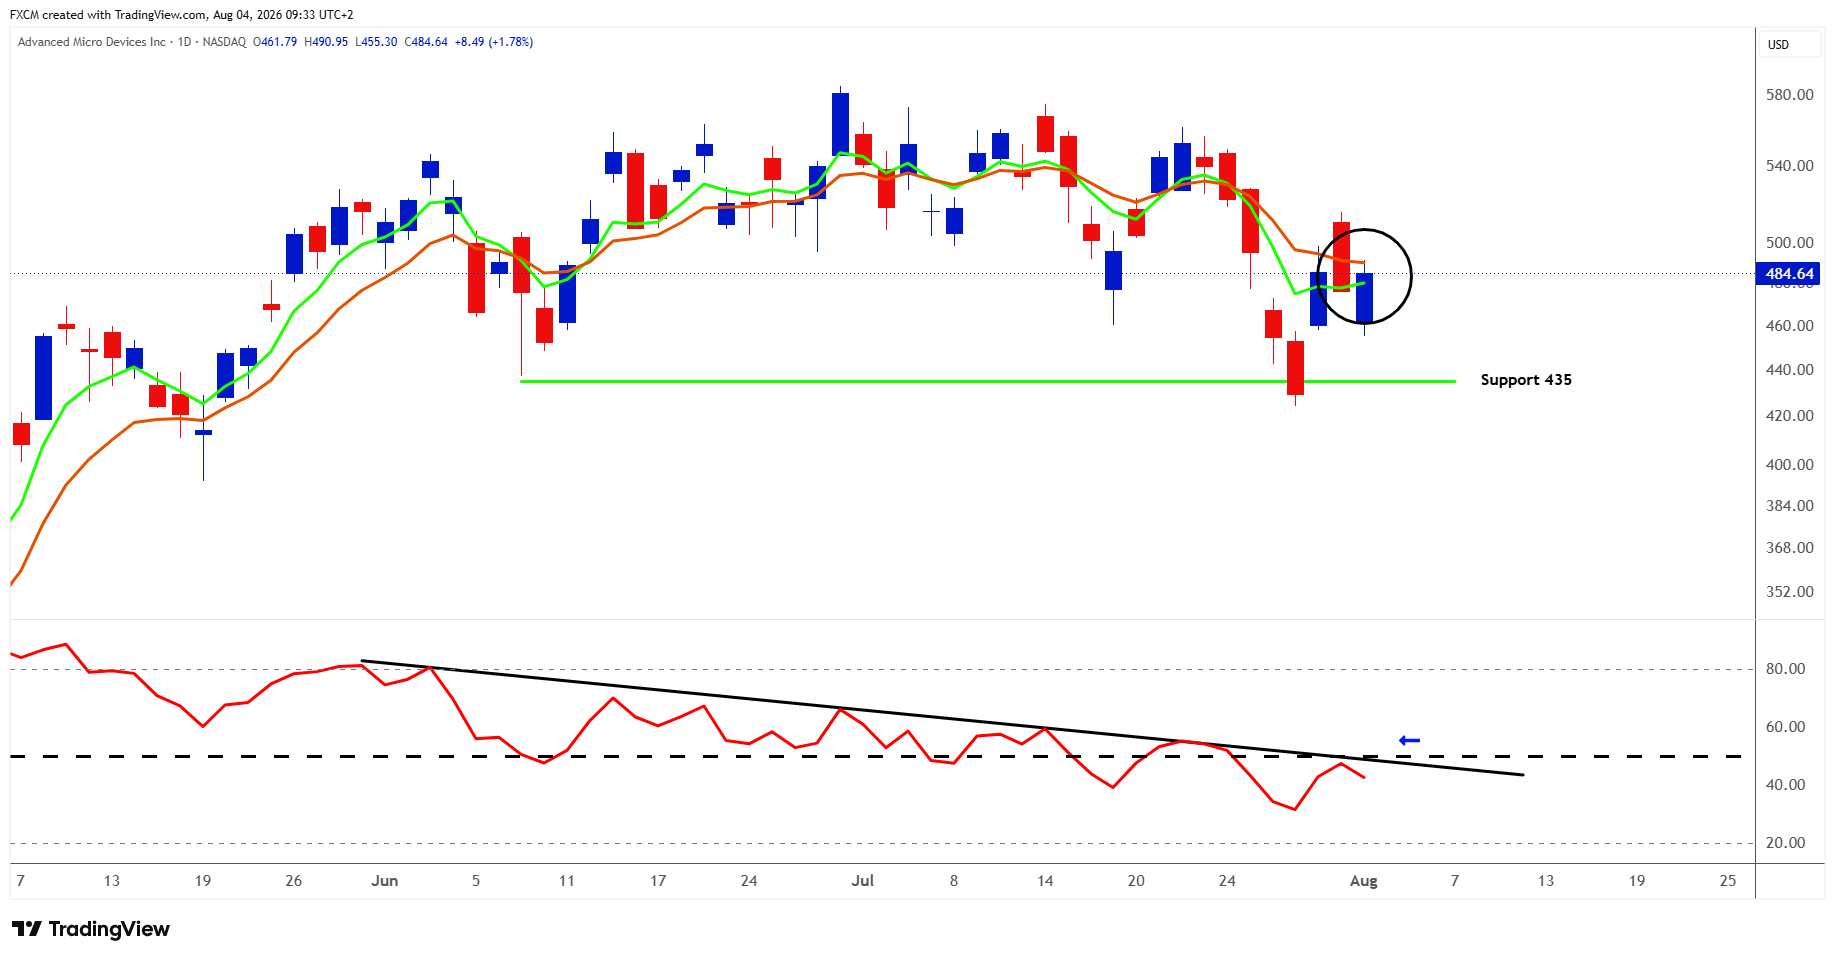
Technical Analysis
AMD has recovered after briefly breaking below the $435 support zone, but the chart has not yet turned convincingly bullish. Price has reclaimed the faster moving average, although it remains below the slower average and the psychologically important $500 level, while the RSI is still below 50 and beneath its descending trendline. To strengthen the outlook, AMD needs to hold above $435, close decisively above $500 and then clear the recent swing high near $515, ideally alongside an RSI break above 50 and its falling resistance line. A bullish crossover between the moving averages would provide further confirmation that momentum is improving. That combination could bring the $535-$545 region back into view, while another rejection between $500 and $515 would leave the move looking more like a relief rally than a genuine trend reversal.
Caveat
As long as the RSI remains below 50, negative momentum is likely to weigh on the share price and increase the risk of a break below $435 support.
Fundamental Perspective
AMD reports after today's close, with analysts looking for roughly $11.3 billion in revenue and adjusted earnings of about $1.61-$1.62 a share, compared with AMD's own guidance of $11.2 billion and a non-GAAP gross margin near 56%. The most important number is likely to be Data Centre revenue, with one widely cited estimate near $6.5 billion, as investors assess demand for both EPYC server processors and Instinct AI accelerators.
Attention will then shift quickly to third-quarter guidance, where analysts are looking for revenue of around $12.5 billion, and to management's confirmation that MI450 and Helios deployments remain on track: Meta-related shipments are scheduled to start during the second half of 2026, OpenAI expects to bring Helios online from the fourth quarter, and Anthropic's initial deployment is planned for the first half of 2027.
Gross margins will show how effectively AMD is turning rapid growth into profit, while higher memory costs, lower expected second-half PC shipments, a projected decline in gaming revenue, manufacturing capacity and competition in both CPUs and AI accelerators remain important risks. With AMD having more than doubled this year, the market will be demanding strong execution and an encouraging outlook rather than simply an earnings beat.
Disney (DIS.us)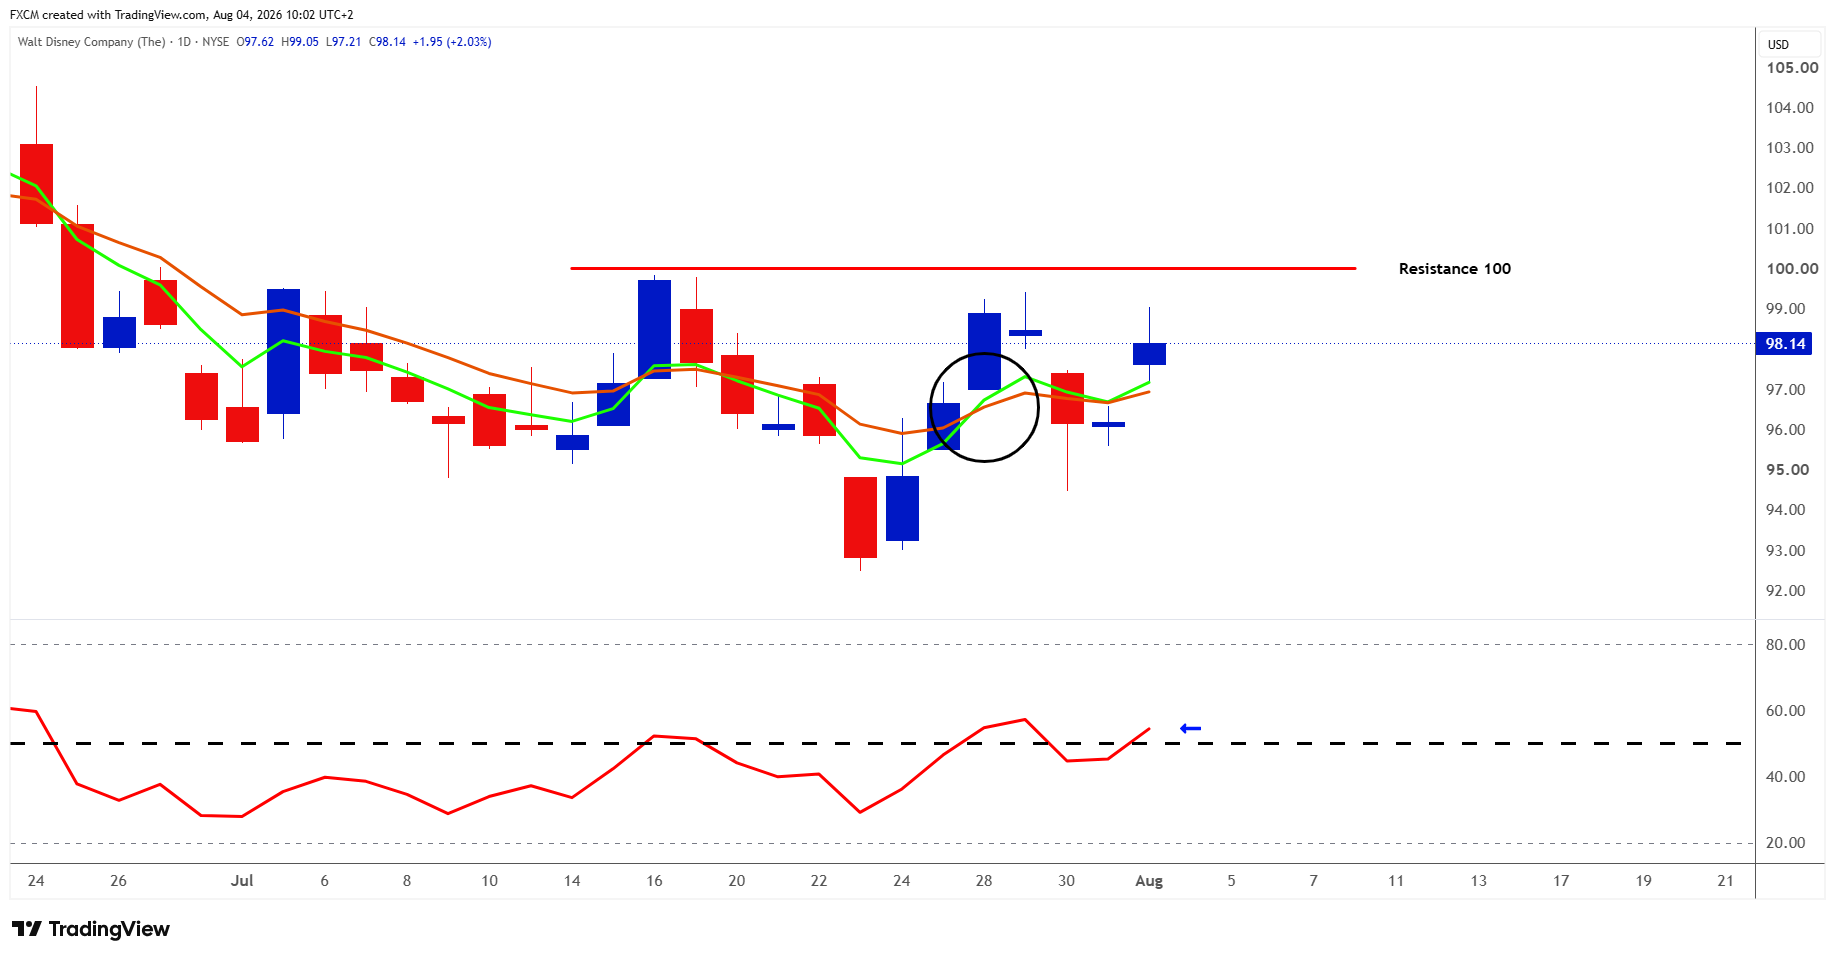
Technical Analysis
Disney's 13.5% year-to-date decline has left the shares attempting a technical recovery, but the chart is not yet convincingly bullish. Price has rebounded from the $93 area and is provisionally trading above both short-term moving averages, while the higher low near $96 and the RSI's move above 50 suggest that momentum is improving. The faster moving average has also crossed above the slower one. For the bullish case to strengthen, Disney must hold the $96-$97 region and close decisively above the repeated and psychological resistance around $100. That would confirm a stronger reversal structure and bring $101-$104 back into view; until then, the recovery remains promising but unproven, and the chart alone cannot confirm that the shares offer fundamental value.
Caveat
If the RSI falls back below 50 and remains there, weakening momentum could place further pressure on Disney's share price.
Fundamental Perspective
Disney reports before the US market opens tomorrow, with current estimates pointing to roughly $25.4 billion in revenue and adjusted earnings of around $1.86-$1.89 a share, depending on the data provider. Beyond the headline numbers, investors will compare total segment operating income with Disney's own guidance of approximately $5.3 billion. Streaming remains central, with attention on whether subscription revenue continues growing and margins remain consistent with Disney's target of at least 10% for the full financial year.
At the parks, the key question is whether domestic attendance improves from Q2's 1% decline while the 5% growth in guest spending holds up despite softer international visitation and competition in Orlando.
ESPN is the clearest earnings headwind. Disney expects Q3 Sports operating income to fall approximately 14% as programming expenses rise by a double-digit percentage, including NBA rights costs shifted into the quarter.
Maintaining guidance for approximately 12% adjusted EPS growth in 2026, excluding the extra week, and double-digit growth in 2027 would strengthen the argument that the sell-off has created value; weaker parks trends, softer streaming margins or a guidance reduction would suggest the recovery still has more to prove.
FXCM US.BANKS Stock Basket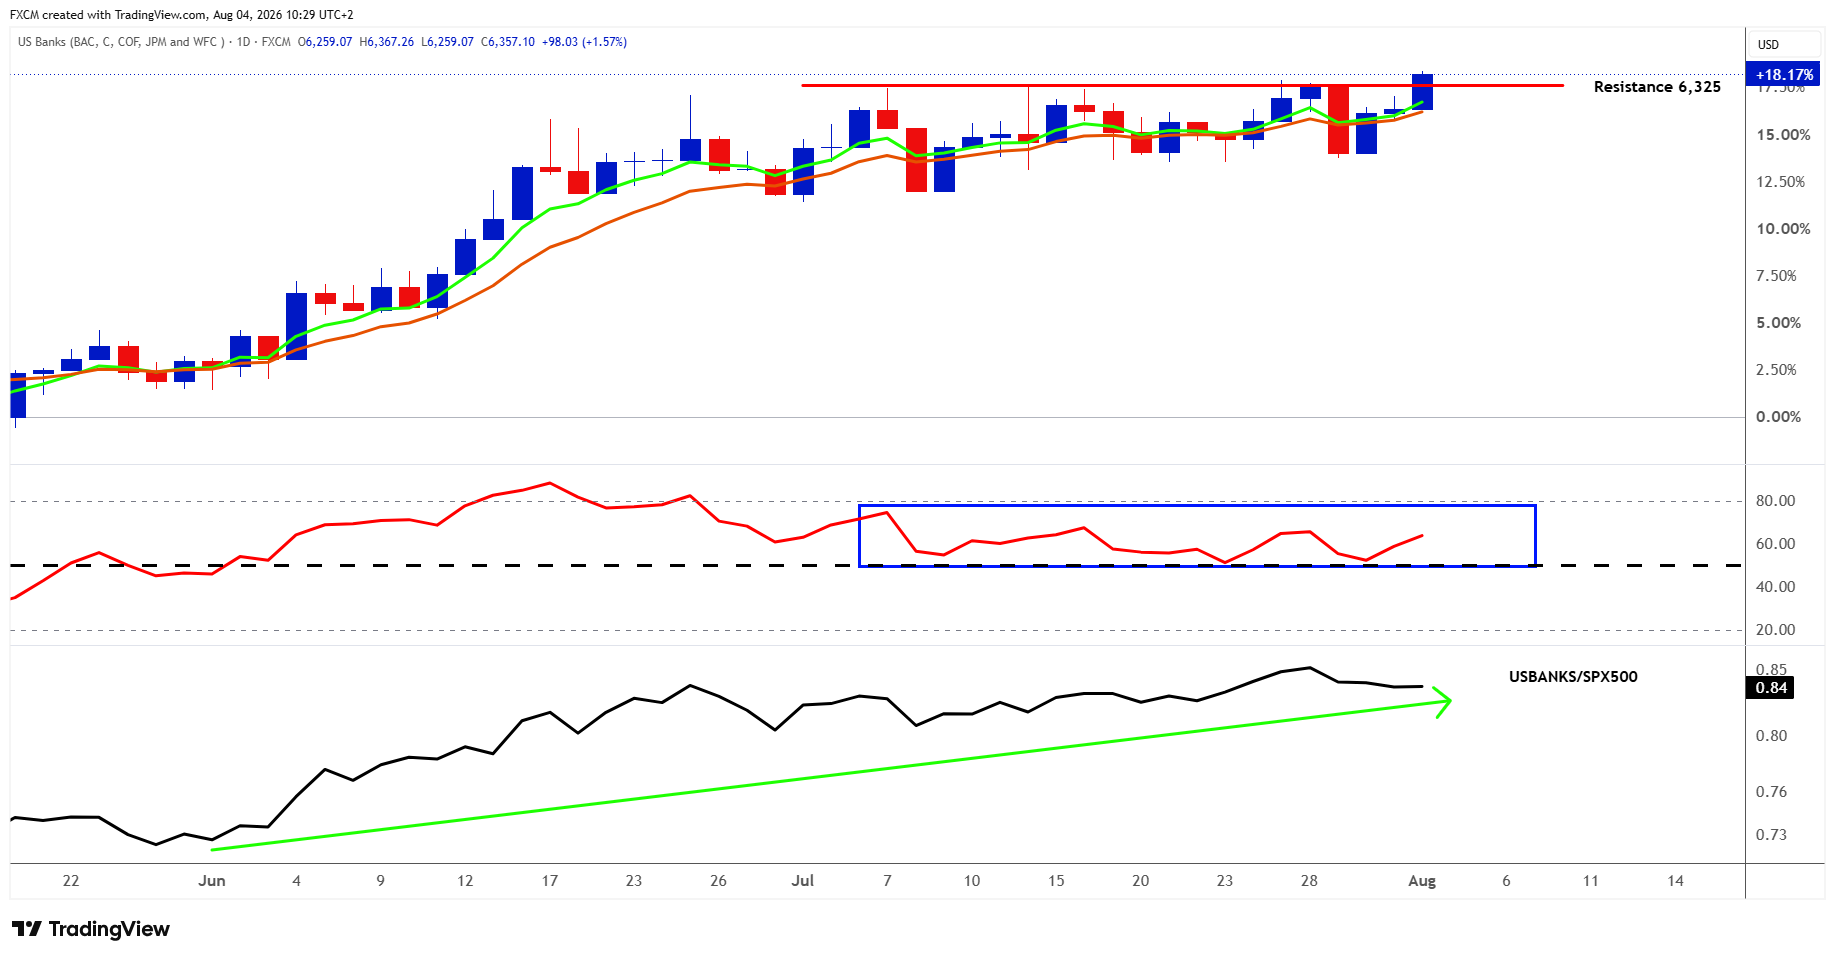
Technical Analysis
USBANKS remain in a well-established uptrend and are now attempting to break above the 6,325 resistance area after several weeks of consolidation. Price is trading above both rising short-term moving averages, with the faster average still above the slower one, while the RSI has climbed into the low-to-mid 60s without becoming overbought, evidence that momentum is strengthening without yet looking excessive. USBANKS has also outperformed the SPX500 since early June, although the relative-strength line has recently levelled off. A confirmed daily close above 6,325, followed by that level holding as support, would strengthen the breakout and point to another leg higher.
Caveat
Failure to hold above 6,325 would raise the risk of a retreat towards the rising moving averages and the lower end of the recent consolidation range.
Fundamental Perspective
US banks have outperformed the SPX500 as investors have rotated away from concentrated technology trades towards financials and other areas perceived as less expensive, while an exceptionally strong second-quarter earnings season has strengthened confidence in the sector.
Trading and investment-banking fees surged, loan balances grew and resilient consumer spending helped support net interest income, with credit quality remaining broadly manageable despite continuing pressure on lower-income borrowers. The steeper yield curve may provide an additional earnings tailwind if asset yields remain firm and deposit costs ease, although the benefit is not automatic and must be weighed against the risk that high long-term rates weaken borrowing, reduce securities values or eventually raise credit losses.
Investors are therefore watching net interest income, loan demand, charge-offs and capital-markets activity, alongside banks' ability to return excess capital. The Fed's stress tests reinforced the sector's resilience. All 32 banks stayed above minimum capital requirements under a severe hypothetical recession, and several lenders subsequently announced higher dividends or buybacks. The fundamental excitement is due to a combination of strong fee income, improving loan growth, manageable credit costs and substantial capital returns.
Hot News, Cold Logic
SpaceX faces a crucial first earnings report as a public company after its shares fell sharply from their debut price. Investors will focus on expected quarterly revenue of about $6.8 billion, Starlink subscriber growth, losses at xAI and the company's rapidly rising spending and debt. Attention will also centre on Starship development and an upcoming lock-up expiry that could release a large number of insider shares, potentially adding further pressure to the stock.
Final Thought
The most striking feature of this market is its continuing willingness to look beyond substantial risks. Strong earnings, firmer US manufacturing data and periodic relief from lower oil prices have carried equities back towards record highs despite elevated bond yields and unresolved geopolitical tension. That resilience suggests the broader advance remains intact, but with expectations still demanding and AI-related companies driving much of the profit growth, further gains will increasingly depend on earnings strength broadening and inflation pressures remaining contained.

Russell Shor
Senior Market Strategist
Russell Shor is a Senior Market Strategist at FXCM, having been promoted to the role in 2025 in recognition of his depth of insight and consistent delivery of high-impact market analysis. He originally joined FXCM in October 2017 as a Senior Market Specialist.
Russell holds an Honours Degree in Economics from the University of South Africa, is a certified FMVA®, and a full member of the Society of Technical Analysts (UK). With over 20 years of experience in financial markets, his work is renowned for its clarity, precision, and strategic value across asset classes.

Any opinions, news, research, analyses, prices, other information, or links to third-party sites contained on this website are provided on an "as-is" basis, as general market commentary and do not constitute investment advice. The market commentary has not been prepared in accordance with legal requirements designed to promote the independence of investment research, and it is therefore not subject to any prohibition on dealing ahead of dissemination. Although this commentary is not produced by an independent source, FXCM takes all sufficient steps to eliminate or prevent any conflicts of interests arising out of the production and dissemination of this communication. The employees of FXCM commit to acting in the clients' best interests and represent their views without misleading, deceiving, or otherwise impairing the clients' ability to make informed investment decisions. For more information about the FXCM's internal organizational and administrative arrangements for the prevention of conflicts, please refer to the Firms' Managing Conflicts Policy. Please ensure that you read and understand our Full Disclaimer and Liability provision concerning the foregoing Information, which can be accessed here.