
AlphaTrack – SPX500 Stuck at 7,700 as Bulls and Bears Wait for Inflation to Break the Deadlock


Thoughtful insights and approachable analysis.
- Oracle heads into earnings with bullish momentum building, but the real catalyst will be whether its huge AI backlog can deliver the growth investors are paying for.
- Adobe heads into earnings on a knife edge, with weakening technicals and investors demanding proof that AI can reignite recurring-revenue growth.
- Micron has reclaimed $1,000, with bullish momentum and surging AI memory demand putting a bigger breakout firmly in play.
Quick Market Overview
Oil prices have climbed to six-week highs as renewed US-Iran strikes and attacks on Saudi energy infrastructure revive fears that disruption in the Strait of Hormuz could persist. UKOil is approaching $100 a barrel while US fuel prices are also rising, reinforcing concerns that the Middle East conflict could keep global energy costs elevated. Despite the escalation, broader markets remain relatively resilient, although investors are watching closely for signs that the geopolitical shock is starting to spill over more forcefully into inflation and risk assets.
General Equity Market Health (SPX500)
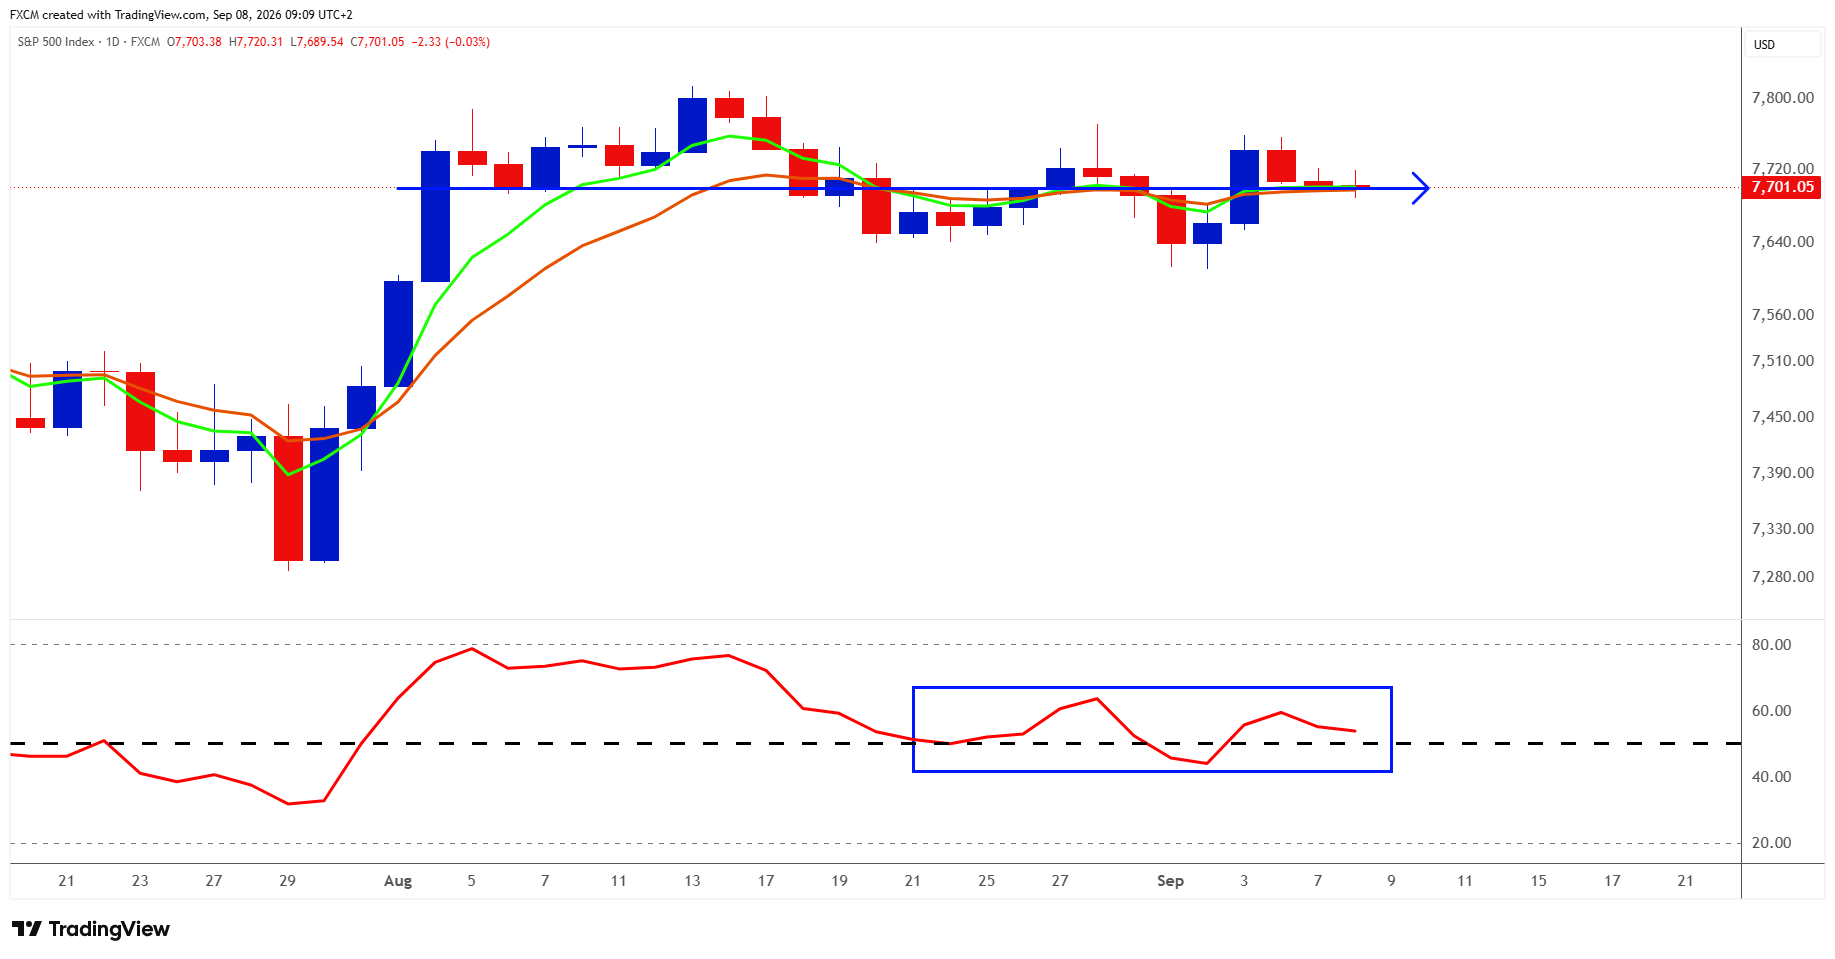
Since mid-August, the SPX500 has been caught in a sideways consolidation, with price repeatedly gravitating back towards the 7,700 area and the short-term moving averages flattening and converging - a clear sign that directional momentum has faded. The RSI reinforces that picture, oscillating around the neutral 50 level rather than establishing either bullish or bearish momentum. That makes the next sustained move in the RSI potentially important: a push towards and above 60 would strengthen the case for an upside breakout and renewed challenge of the August highs, while a slide below 40 would suggest sellers are gaining control and increase the risk of a break beneath the recent range. For now, the market remains finely balanced, with 7,700 acting as the battleground and momentum offering few clues as to which side will ultimately prevail.
The bull case remains strong enough to discourage a sustained sell-off, but the macro backdrop is uncomfortable enough to frustrate a breakout. August payrolls surged by 162,000, almost three times expectations, while unemployment held at 4.1%, easing concerns about recent labour-market weakness. Yet that resilience is a double-edged sword, with markets now pricing a 58.4% probability of a 25-basis-point Fed hike this month. At the same time, renewed US-Iran hostilities and continued disruption around the Strait of Hormuz have driven Brent back towards $100 a barrel, keeping inflation risks elevated. Investors are therefore caught between resilient economic growth and the prospect of tighter monetary policy, while renewed energy-driven inflation adds another layer of uncertainty. It is a fundamental stalemate that fits neatly with the RSI oscillating around neutral territory. With PPI due on Thursday and CPI on Friday, the balance may not remain intact for long. Softer inflation could provide the catalyst for another assault on the highs, while a hotter print would strengthen the case for a Fed hike and give the bears an opening.
Potential Trade Setups
Three very different technical stories are starting to emerge across Adobe, Oracle and Micron, each with a major catalyst capable of changing the picture quickly. Adobe is testing whether a recent loss of momentum is simply a pullback or the start of something more serious, Oracle is trying to build on a strengthening short-term trend ahead of a crucial earnings test, while Micron has reclaimed a key psychological level with momentum and AI-driven demand working in its favour. With all three approaching important decision points, the next few sessions could offer some of the clearest trade setups in large-cap technology.
Oracle Corporation (ORCL.us)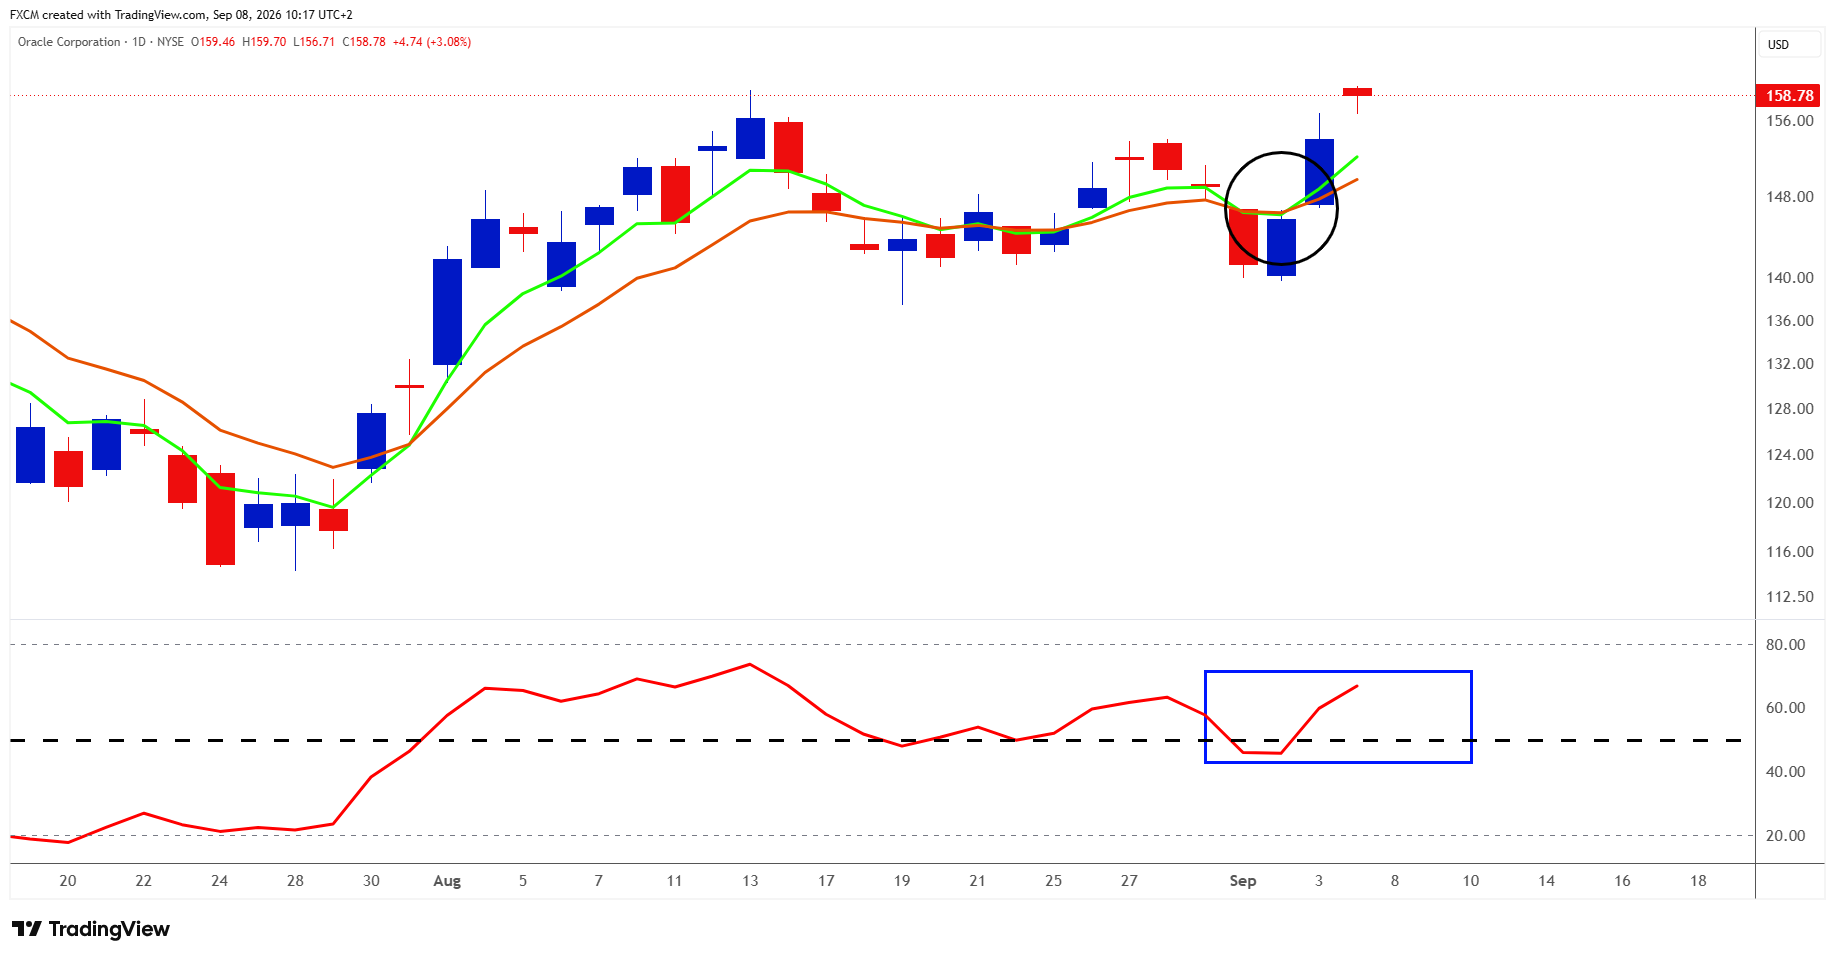
Technical Analysis
Oracle's technical picture has strengthened noticeably after the sharp early-September pullback was quickly rejected around the $140 to $142 area. Buyers responded aggressively, driving the shares back above both short-term exponential moving averages, while the faster EMA has now crossed above the slower EMA, producing a bullish signal and suggesting that the short-term trend is turning higher. Momentum is confirming the move, with the RSI rebounding from the 40s to comfortably above the neutral 50 level, signalling that buyers have regained control without momentum yet becoming excessively stretched. Attention now turns to the $159 to $160 area, where Oracle is testing its recent highs. A convincing break above this zone would strengthen the case for a fresh leg higher, while failure to clear it could see the shares pause after their rapid rebound.
Caveat
A RSI move back below 50 would signal fading momentum and could put downward pressure on the shares, while a sustained break below 50 would turn the near-term technical outlook more negative.
Fundamental Perspective
Oracle's fiscal first-quarter results on Thursday will test whether its record $638 billion contracted backlog, boosted heavily by large-scale AI deals, can translate into revenue and attractive economic returns. Wall Street expects roughly $19.1 billion of revenue and $1.74 of adjusted EPS, broadly in line with Oracle's guidance for revenue growth of 27% to 29% and EPS of $1.72 to $1.76. Yet the headline numbers may not determine the share-price reaction.
Investors will be watching total cloud revenue growth against Oracle's 58% to 64% guidance, the pace of Oracle Cloud Infrastructure (OCI) expansion, how quickly the $638 billion RPO (Remaining Performance Obligations) is converting into recognised revenue, and whether management reaffirms its $90 billion FY2027 revenue target.
OCI grew 93% in the previous quarter and total cloud revenue rose 47% but delivering that growth is enormously capital intensive. Oracle generated negative $23.7 billion of free cash flow in fiscal 2026 and expects around $70 billion of net cash capital expenditure this year, leaving investors highly sensitive to margins, financing requirements and returns on that investment.
A simple earnings beat may therefore not be enough. What could really move the shares is evidence that Oracle is turning extraordinary AI demand into revenue at a pace and profitability that justify the extraordinary cost of building the infrastructure to serve it.
Adobe Inc. (ADBE.us)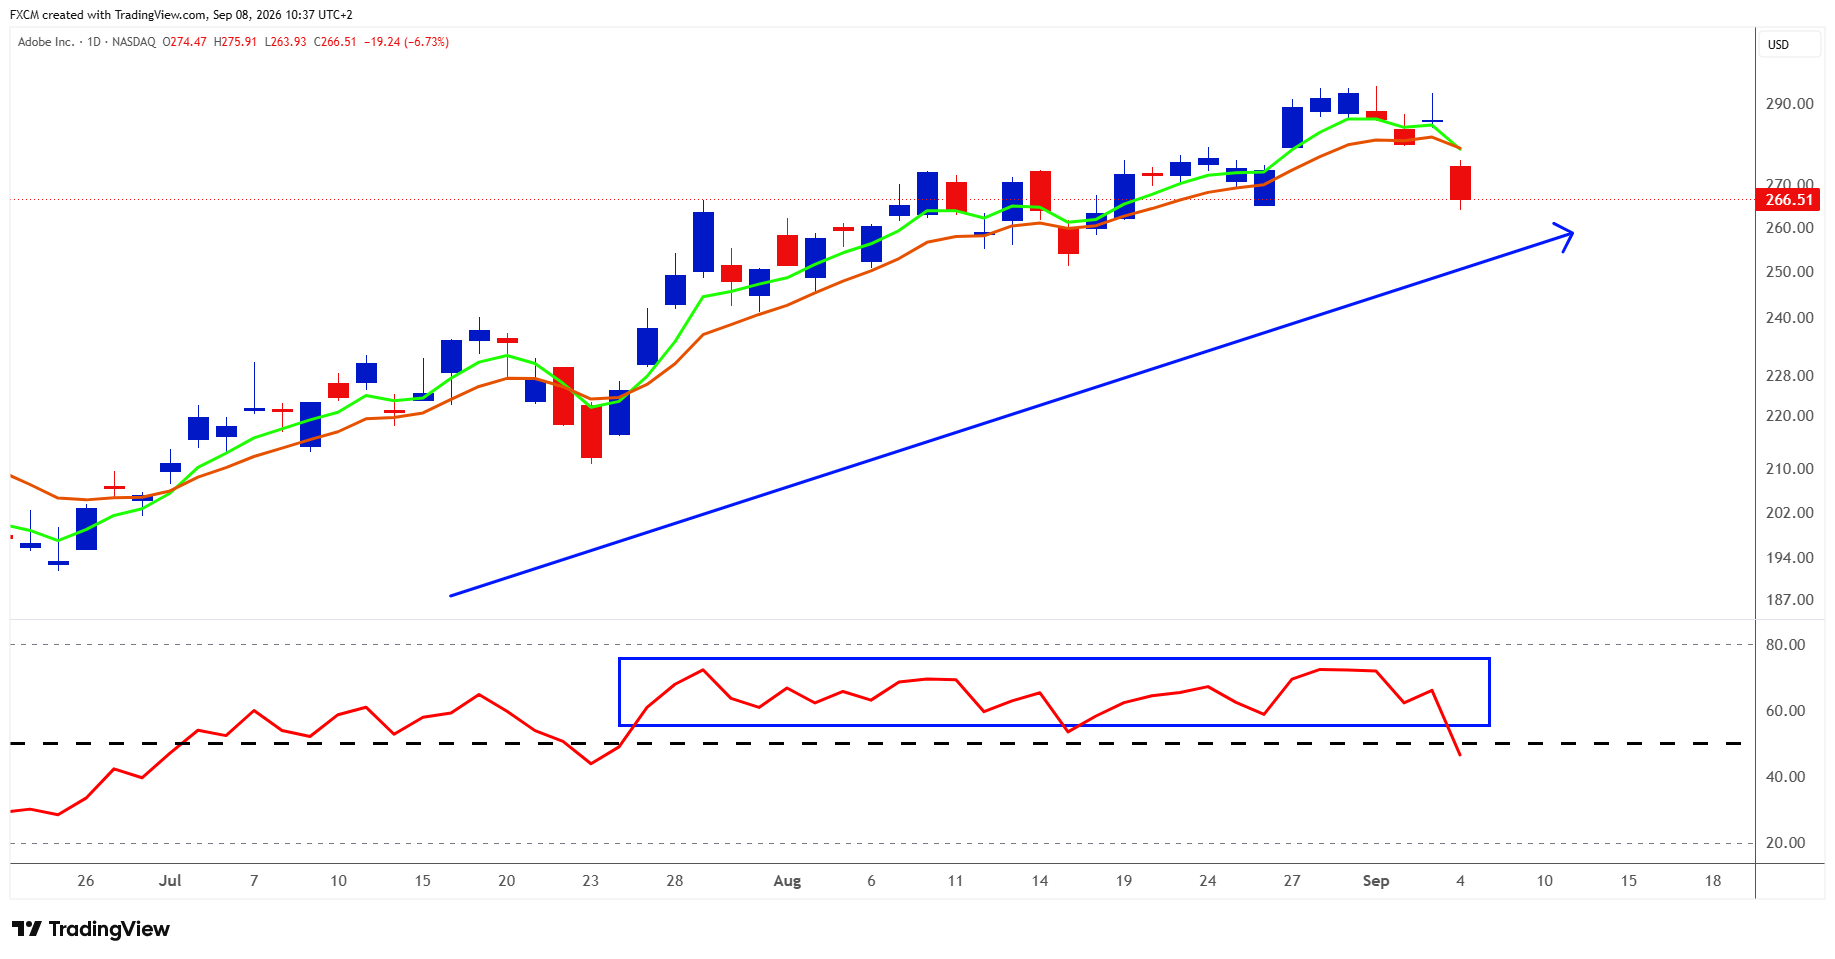
Technical Analysis
Adobe's broader uptrend is still intact, but the chart is flashing its clearest warning signal in several weeks. The shares have fallen sharply from the recent highs near $290, broken below both short-term EMAs, and the faster EMA is now crossing beneath the slower EMA, signalling that near-term momentum has turned bearish. The RSI tells the same story, dropping decisively below 50 after spending much of August in bullish territory above that level. The crucial test is now the $260 to $265 area. If buyers defend this zone and the RSI quickly recovers above 50, the current weakness could prove to be a healthy pullback within the larger uptrend.
Caveat
A decisive break below support, particularly if the RSI remains below 50 and the bearish EMA crossover deepens, would be more significant and could expose the $250 area while raising the possibility that Adobe's summer rally has moved from consolidation into a genuine correction.
Fundamental Perspective
Adobe's fiscal third-quarter results on Thursday will be less about whether it can beat the headline numbers and more about whether it can convince investors that AI is strengthening rather than eroding its competitive position. Wall Street expects roughly $6.69 billion of revenue and $6.08 of adjusted EPS, broadly in line with Adobe's guidance of $6.67 billion to $6.72 billion and $6.05 to $6.10 respectively. The real focus will be on ARR growth (Annualised Recurring Revenue), Firefly monetisation, Creative Cloud demand and whether Adobe can convert its rapidly expanding freemium audience into paying customers.
Adobe exited Q2 with total ARR of $27.1 billion, AI-first ARR above $500 million and Firefly ARR approaching $300 million, but management has deliberately accepted some near-term ARR pressure in exchange for faster user acquisition. That trade-off is now central to the investment case as competition from lower-cost and AI-enabled creative tools intensifies and Anil Chakravarthy prepares to take over as CEO in December.
A routine earnings beat may therefore not be enough. What could really move the shares is evidence that AI adoption is translating into durable paid growth, that Creative Cloud pricing and retention remain resilient, and that Adobe can reaffirm its 10.2% FY2026 ARR growth target while giving investors greater confidence that recurring-revenue growth can accelerate again.
Micron Technology Inc. (MU.us)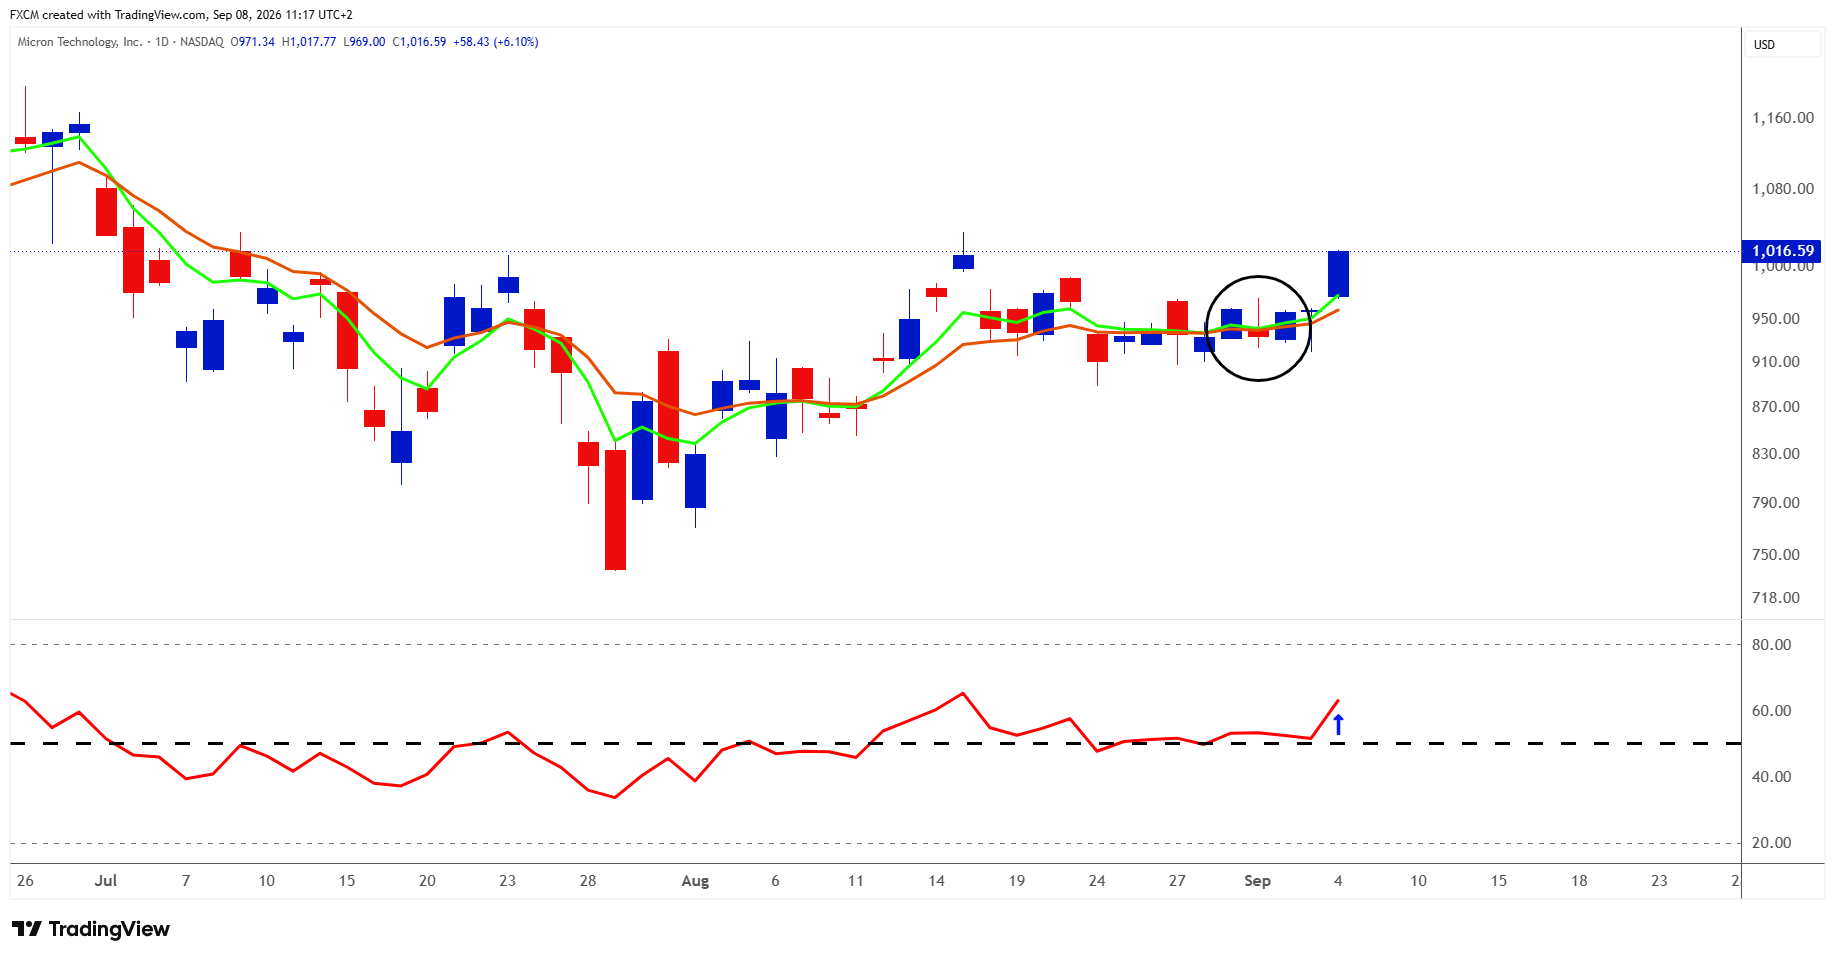
Technical Analysis
Micron's technical picture has turned decisively more bullish after several weeks of consolidation. The faster EMA has crossed above the slower EMA, while price has accelerated above both averages, confirming that short-term trend momentum is improving. The RSI adds further conviction, pushing cleanly above 50 into the low-60s, showing strengthening buying pressure without yet reaching overbought territory. Importantly, the shares have also broken back above the psychologically significant $1,000 level, with the powerful latest candle carrying Micron towards the $1,015 to $1,020 area, which coincides with the August high and now represents the next technical hurdle. A sustained break above this zone would complete a more meaningful breakout and could open the way towards the $1,040 area and beyond. The bullish case would remain intact while price holds above the recent breakout zone and the RSI stays north of 50, although a move back below $1,000 would be the first sign that the breakout is losing conviction.
Caveat
A key caveat is the RSI. A move back below 50 would be a negative development, signalling that bullish momentum is fading and increasing the risk that the recent breakout starts to unwind.
Fundamental Perspective
Micron's break above $1,000 is backed by an unusually powerful fundamental story, with AI infrastructure investment driving exceptional demand for HBM (High Bandwidth Memory) and server DRAM. Micron's calendar 2026 HBM supply is already sold out, HBM4 is shipping at high volume for its lead customer's platform, and tight industry supply is supporting formidable pricing power and margins. Micron has already set an exceptionally high bar for the September quarter, guiding for roughly $50 billion of revenue, $31 of adjusted EPS and an extraordinary 86% gross margin.
The backdrop is also being reinforced across the wider memory industry, where strength among major producers points to growing confidence in the sector-wide cycle. The real question is therefore no longer whether demand is strong, but how long the shortage and pricing cycle can last. If Micron's results and, crucially, its forward guidance show that AI demand, supply tightness and exceptional profitability can extend into fiscal 2027, the fundamentals could provide the ammunition needed to turn the move above $1,000 into something much more durable.
Hot News, Cold Logic
US stocks ended the week little changed as a surprisingly strong August jobs report increased expectations of a Federal Reserve rate hike. The labour market appears more resilient than feared, but that strength puts greater pressure on this week's inflation data, where a hotter reading could make further tightening more likely. With earnings season largely finished and signs of strain still visible among consumers, markets are increasingly dependent on inflation and Fed policy for direction.
Final Thought
Markets are being asked to absorb a difficult combination of a stronger US labour market, higher oil prices and renewed upward pressure on bond yields. The bull case remains intact while earnings hold up, but with upcoming inflation data potentially proving decisive for whether the Fed raises rates this month and geopolitical risk pushing energy costs higher, further gains will have to be earned rather than assumed. In this environment, resilience is encouraging, but the next leg higher will depend increasingly on profits being strong enough to overcome a less forgiving macro backdrop.

Russell Shor
Senior Market Strategist
Russell Shor is a Senior Market Strategist at FXCM, having been promoted to the role in 2025 in recognition of his depth of insight and consistent delivery of high-impact market analysis. He originally joined FXCM in October 2017 as a Senior Market Specialist.
Russell holds an Honours Degree in Economics from the University of South Africa, is a certified FMVA®, and a full member of the Society of Technical Analysts (UK). With over 20 years of experience in financial markets, his work is renowned for its clarity, precision, and strategic value across asset classes.

Any opinions, news, research, analyses, prices, other information, or links to third-party sites contained on this website are provided on an "as-is" basis, as general market commentary and do not constitute investment advice. The market commentary has not been prepared in accordance with legal requirements designed to promote the independence of investment research, and it is therefore not subject to any prohibition on dealing ahead of dissemination. Although this commentary is not produced by an independent source, FXCM takes all sufficient steps to eliminate or prevent any conflicts of interests arising out of the production and dissemination of this communication. The employees of FXCM commit to acting in the clients' best interests and represent their views without misleading, deceiving, or otherwise impairing the clients' ability to make informed investment decisions. For more information about the FXCM's internal organizational and administrative arrangements for the prevention of conflicts, please refer to the Firms' Managing Conflicts Policy. Please ensure that you read and understand our Full Disclaimer and Liability provision concerning the foregoing Information, which can be accessed here.