
Market Threads | Oil Weakens, the Dollar Breaks Higher and Stocks Face a Test


- UKOil and USOil Bearish charts meet rising US inventories and surplus concerns, while Middle East shipping risks keep a floor under prices.
- USDOLLAR A decisive push above 12,835 strengthens the uptrend, though an overheated RSI raises the chance of a pause.
- XAUUSD Gold's rising channel breakdown and a firm dollar reinforce the downside, while oversold momentum leaves room for a sharp rebound.
- SPX500 Price has slipped below 7,500 as the trend weakens. Nvidia's upbeat outlook offers support, but the chart needs to recover key resistance.
Cross Asset View
The charts below show a forceful dollar advance alongside weakness in gold, oil and the S&P 500. That combination fits a market weighing the prospect of higher US interest rates. Firmer yields and a stronger dollar can pressure gold and equity valuations, while oil faces the additional drag of rising inventory estimates and oversupply concerns. Nvidia's better-than-expected outlook has helped revive some optimism around AI, but it has not erased the S&P 500's technical deterioration. Oil's geopolitical risk premium remains a counterweight to its bearish chart.
Oil
Technical Analysis
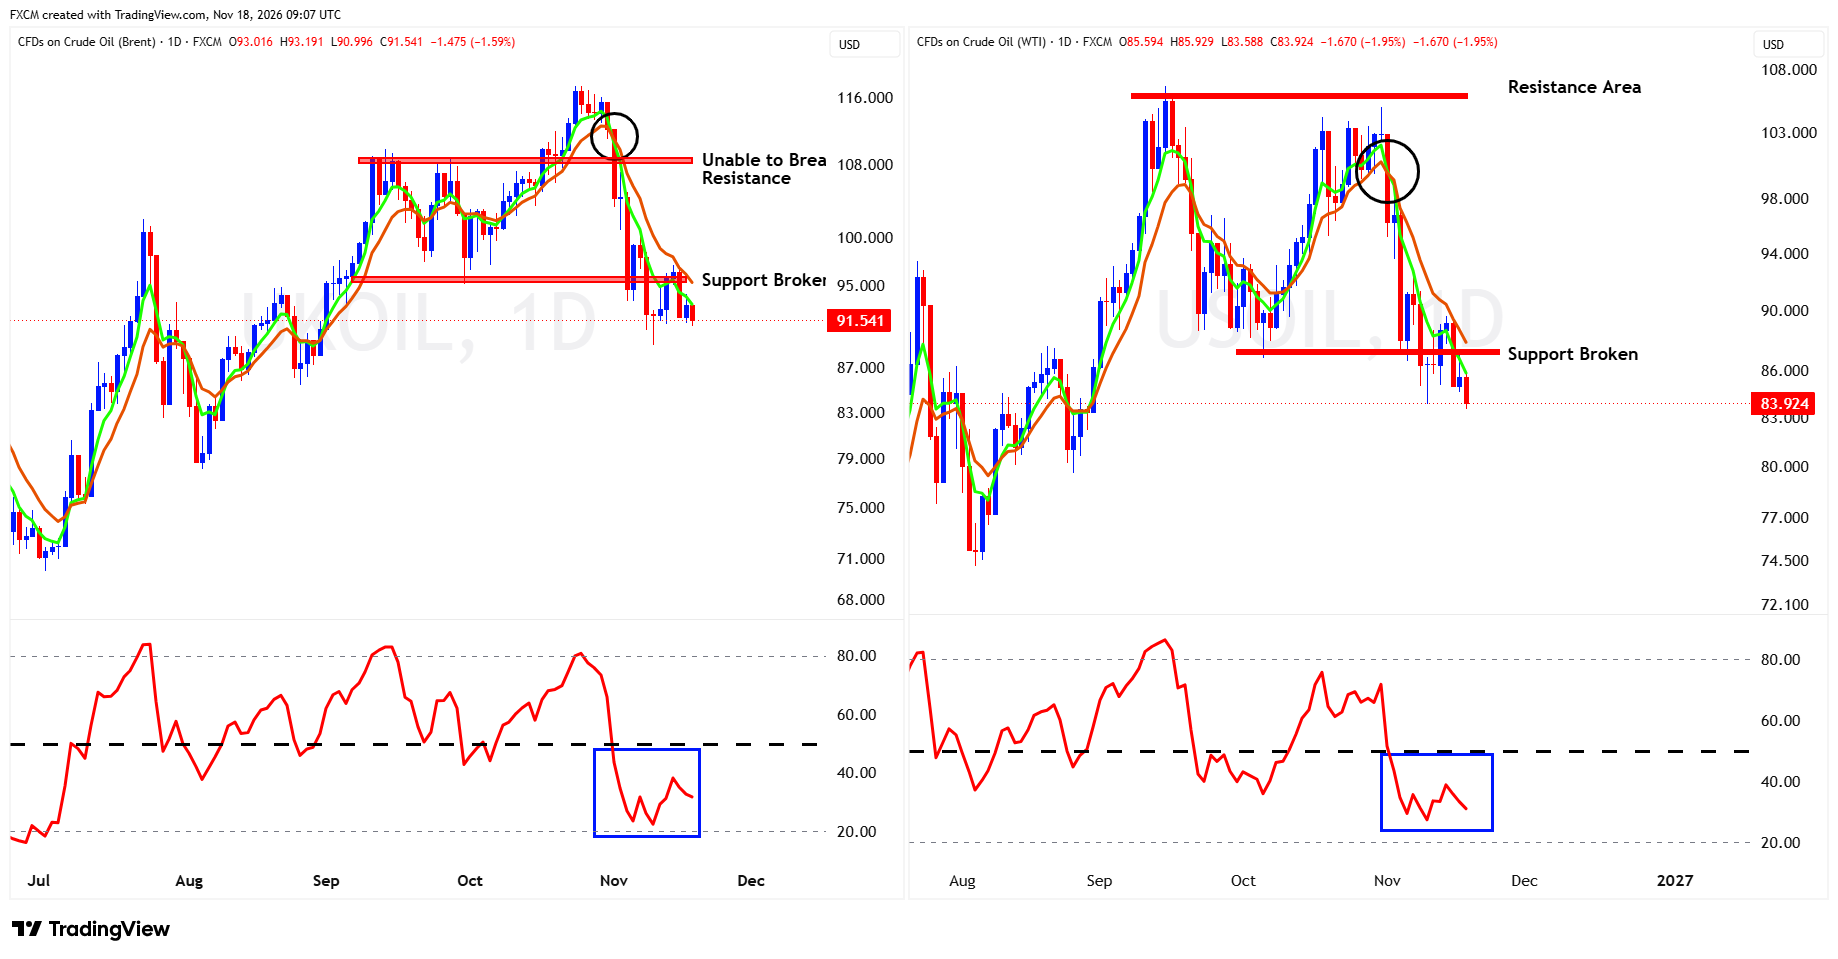
UKOil was around $91.54 after falling below the $95 support area, which now appears to be resistance. The short-term moving averages have turned lower, and RSI is below 50, consistent with weakening momentum. The chart's recent low near $91.00 is the immediate level to watch. A break below it would add to downside pressure, while a sustained move back above $95 would improve the near-term picture.
USOil was around $83.92, below the broken $87 support zone, which now appears to be resistance. The moving averages are sloping lower, and RSI is well below 50, keeping the near-term bias bearish. The chart's session low near $83.59 is the immediate reference. A clear break below it would extend the decline, while a recovery above $87 would be an early sign that selling pressure is easing.
Fundamental Perspective
Oil prices came under pressure after market sources reported an API estimate showing that US crude inventories had risen by 5.28 million barrels in the week ended 13 November. Gasoline inventories were also higher. The estimate is based on API data, not an official EIA release. The IEA has also forecast a fourth-quarter oil surplus as Middle East exports recover faster than demand. However, ongoing conflict and shipping disruption around the Strait of Hormuz are limiting the decline and remain a source of upside risk.
USDOLLAR
Technical Analysis
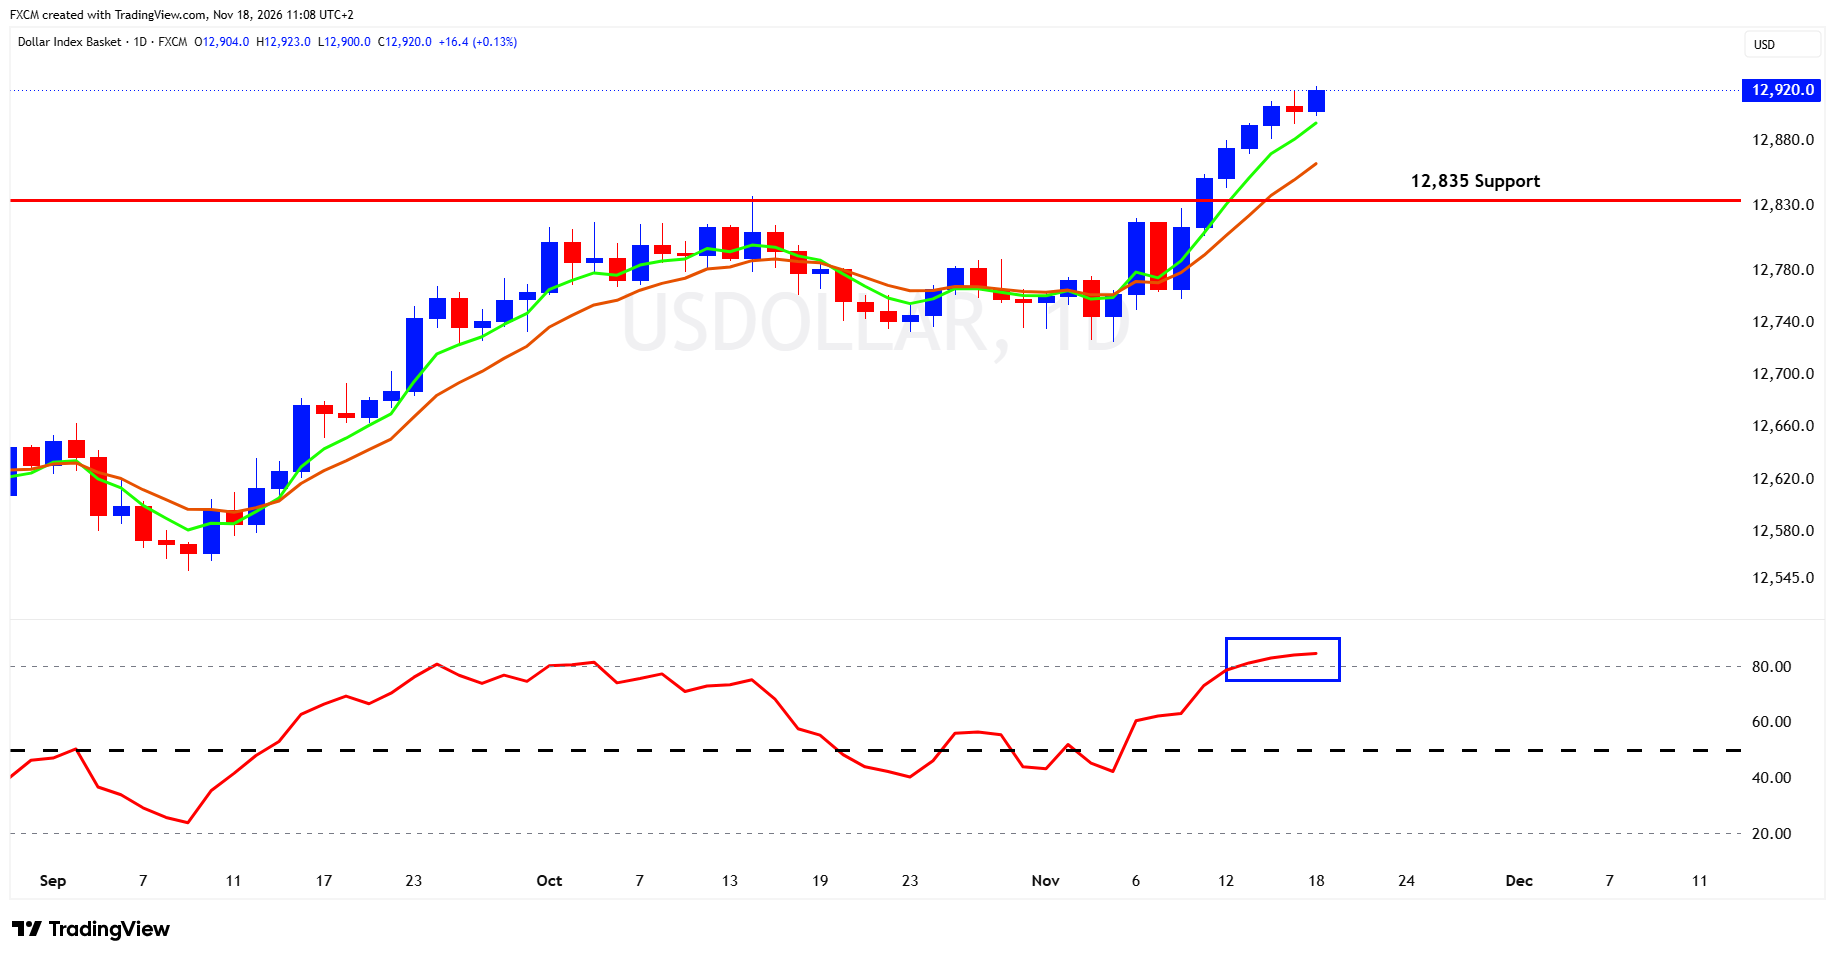
FXCM's USDOLLAR basket was at 12,920, above the marked 12,835 resistance level, which now becomes the first support area to watch. Price is above rising short-term moving averages, confirming strong upside momentum. RSI is above 80, so the move is stretched and vulnerable to a pullback. That alone does not confirm a reversal. Holding above 12,835 would keep the breakout constructive, while a move back below it would put the breakout in question.
Fundamental Perspective
The dollar has drawn support from expectations of tighter US monetary policy. October retail sales rose 0.2%, while import prices increased 1.1%, above expectations. Fed officials also signalled concern about inflation. Markets were pricing in a high probability of a 25-basis-point rate increase in December, although market probabilities can change. The Federal Reserve minutes are a potential catalyst for the dollar and Treasury yields, with their release due later today.
Gold
Technical Analysis
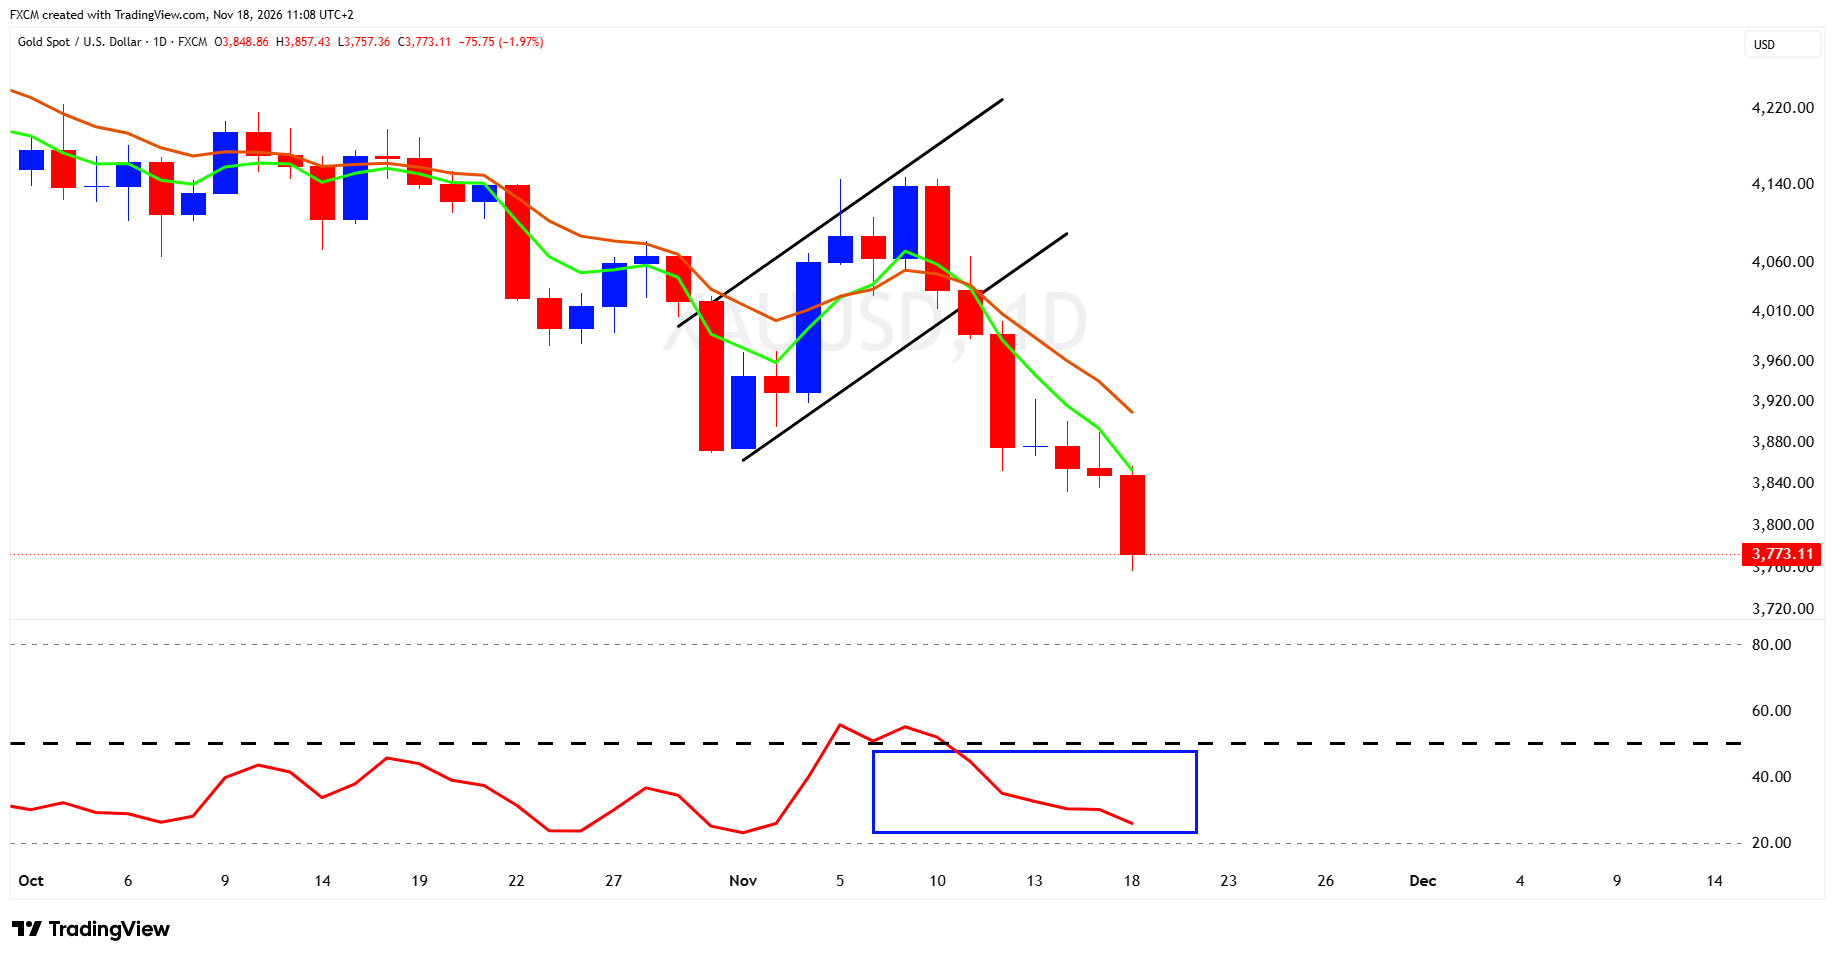
XAUUSD was around $3,773, down about 2% on the chart. Price has broken below the rising channel drawn across the November rebound and is trading beneath falling short-term moving averages. RSI is near the oversold end of its range, showing intense selling but not confirming a bottom. The session low near $3,757 is the immediate reference. A recovery above the broken channel and moving averages would be needed to improve the technical picture.
Fundamental Perspective
Gold's technical weakness is matched by pressure from the dollar and the interest-rate outlook. Gold fell nearly 2%, reaching its lowest level in over a year as the dollar strengthened and expectations of higher US rates increased. Higher yields raise the opportunity cost of holding non-yielding gold, while a stronger dollar makes bullion more expensive for overseas buyers. The Federal Reserve minutes are due later today and could shift rate expectations.
Index In Focus: SPX500
Technical Analysis
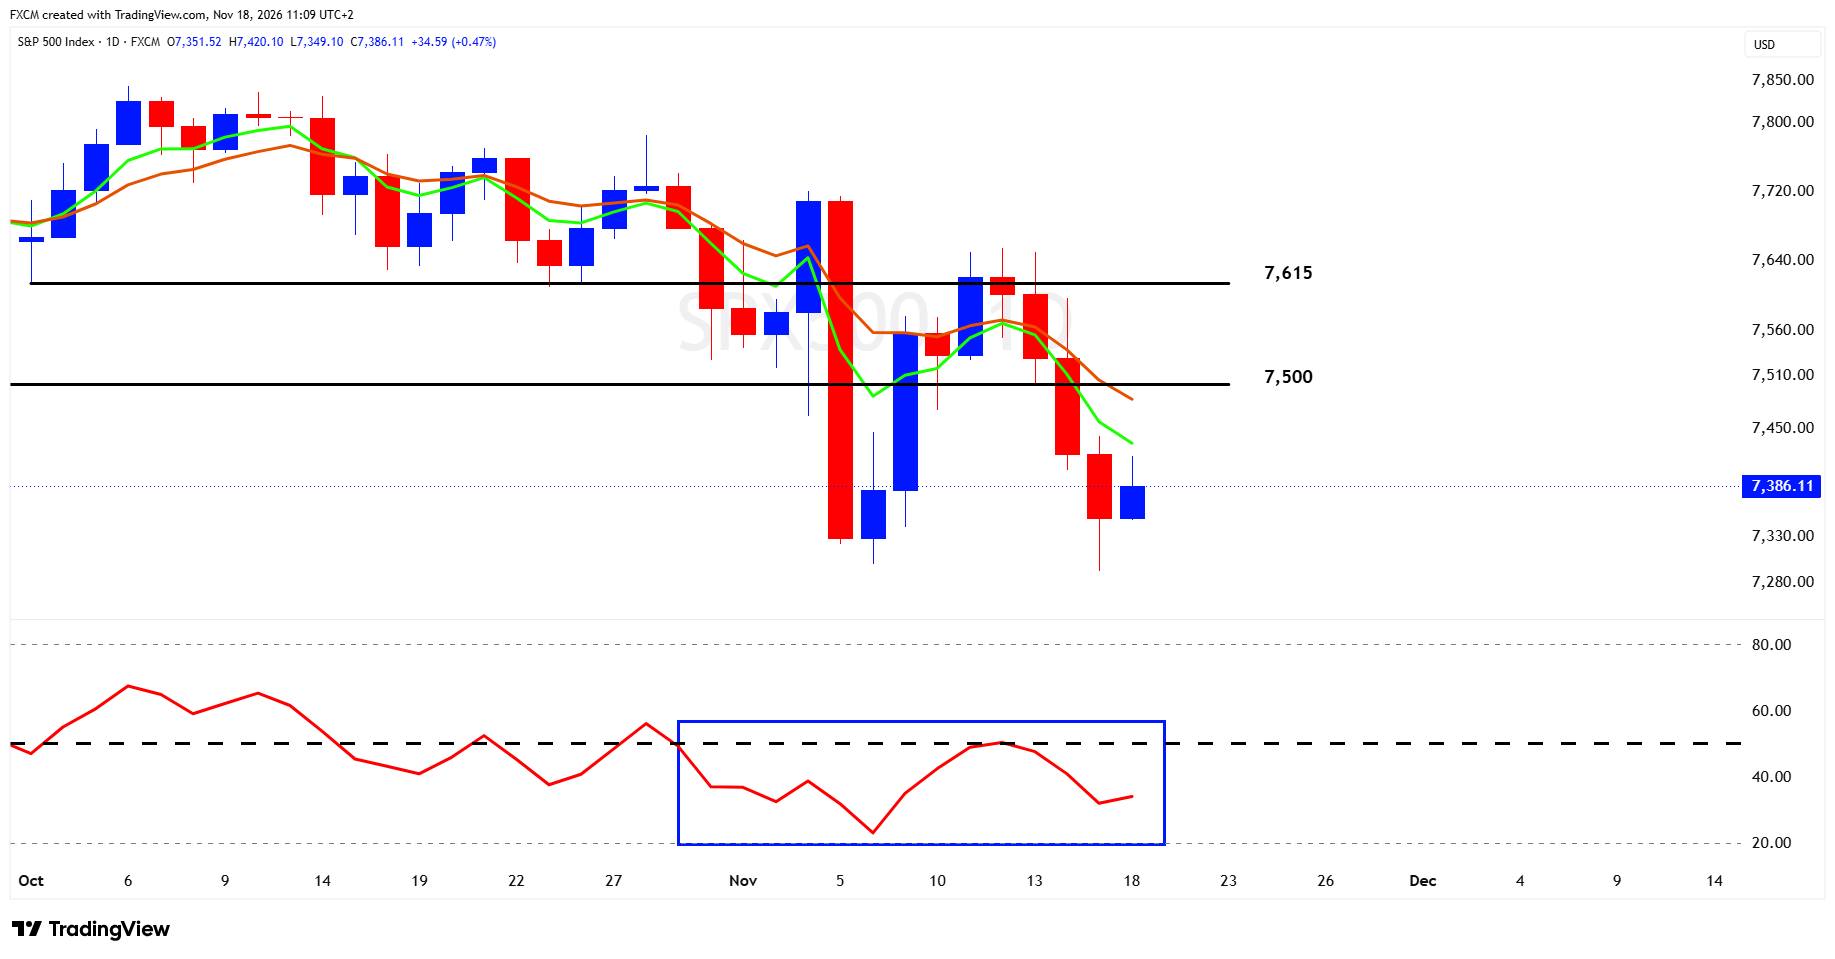
SPX500 was at 7,386, below the marked 7,500 and 7,615 resistance levels, with short-term moving averages pointing lower. RSI appears to be in the mid-30s and remains below 50, reflecting weak momentum. The chart shows recent lows around 7,300 to 7,350. These are reference points to watch, not confirmed support. The current candle is higher, but a single positive session does not change the broader pattern. A recovery above 7,500 would be an initial improvement, while a move above 7,615 would provide stronger evidence of a rebound.
Fundamental Perspective
The near-term outlook is mixed. The S&P 500 fell about 1% yesterday as investors questioned the sustainability of the AI trade. Nvidia then reported third-quarter revenue of $115.8 billion, up 103% year over year, and forecast fourth-quarter revenue of $130 billion, plus or minus 3%. That stronger outlook helped lift market sentiment, but it does not establish that technology-sector selling is over. Higher-rate expectations remain a headwind, and the chart still needs to reclaim resistance.

Russell Shor
Senior Market Strategist
Russell Shor is a Senior Market Strategist at FXCM, having been promoted to the role in 2025 in recognition of his depth of insight and consistent delivery of high-impact market analysis. He originally joined FXCM in October 2017 as a Senior Market Specialist.
Russell holds an Honours Degree in Economics from the University of South Africa, is a certified FMVA®, and a full member of the Society of Technical Analysts (UK). With over 20 years of experience in financial markets, his work is renowned for its clarity, precision, and strategic value across asset classes.

Any opinions, news, research, analyses, prices, other information, or links to third-party sites contained on this website are provided on an "as-is" basis, as general market commentary and do not constitute investment advice. The market commentary has not been prepared in accordance with legal requirements designed to promote the independence of investment research, and it is therefore not subject to any prohibition on dealing ahead of dissemination. Although this commentary is not produced by an independent source, FXCM takes all sufficient steps to eliminate or prevent any conflicts of interests arising out of the production and dissemination of this communication. The employees of FXCM commit to acting in the clients' best interests and represent their views without misleading, deceiving, or otherwise impairing the clients' ability to make informed investment decisions. For more information about the FXCM's internal organizational and administrative arrangements for the prevention of conflicts, please refer to the Firms' Managing Conflicts Policy. Please ensure that you read and understand our Full Disclaimer and Liability provision concerning the foregoing Information, which can be accessed here.