
Market Threads – Markets Pull in Different Directions as Uncertainty Builds


Tracking important market threads across currencies, commodities, and indices.
- Oil bulls take charge! UKOil breaks higher as USOil rebounds, but can Middle East supply fears keep the rally alive?
- USDOLLAR loses momentum as bearish signals flash! Is the greenback heading for a deeper correction or gearing up for another rally?
- Gold under pressure! Will the bulls defend the crucial $4,100 support, or are further losses on the horizon?
- SPX500 bulls regain momentum! Can upbeat earnings fuel a fresh rally, or will market uncertainty derail the recovery?
Earnings Season Puts Wall Street to the Test
With Wall Street attempting to regain its footing, the third-quarter earnings season could prove crucial in determining whether the recovery has staying power. Investors are looking for more than companies simply beating expectations. They want evidence that earnings growth can withstand higher borrowing costs, persistent inflation and growing questions about the returns on artificial intelligence investment. Netflix offered a timely reminder of how demanding investors have become. The streaming giant reported an 11.8% increase in third-quarter revenue to $12.87 billion yesterday, with earnings exceeding forecasts. However, its shares fell in after-hours trading after disappointing fourth-quarter guidance and a reduction in its advertising revenue outlook overshadowed the stronger profit figures. It was a clear illustration of a familiar market lesson. Good results matter, but what companies say about the months ahead can matter even more.
Attention now turns to Meta Platforms and Tesla, both due to report after today's closing bell. Meta faces growing pressure to demonstrate that its substantial AI investments can translate into sustainable revenue and profit growth, while Tesla will need to reassure investors about automotive margins, profitability and progress in autonomous driving and robotics. Beyond these technology heavyweights, the broader market needs earnings strength across more sectors to build confidence in a lasting recovery. The early figures offer some encouragement. According to FactSet, 84% of S&P 500 companies reporting by 16 October exceeded earnings expectations, although the average size of those positive surprises remained below historical norms. That leaves little room for complacency. Strong forward guidance, resilient margins and evidence of broader earnings growth could help the SPX500 build on its tentative recovery. Without these, investors may struggle to find sufficient reason to push equities meaningfully higher.
Cross-Asset View
Financial markets are sending mixed signals as investors weigh geopolitical tensions, shifting interest rate expectations and the latest corporate earnings. Oil prices are pushing higher amid renewed Middle East supply concerns, while USDOLLAR is losing momentum as traders reassess the Federal Reserve's next move. Gold, meanwhile, remains under pressure as expectations of tighter monetary policy weigh on the precious metal, despite lingering geopolitical uncertainty. On Wall Street, the SPX500 is showing early signs of recovery, supported by encouraging earnings and improving market sentiment. With inflation risks still elevated and the Fed's next steps far from certain, the question is whether the recent shifts across asset classes mark the beginning of more sustained trends or simply another pause in an unsettled market.
Oil
Technical Analysis
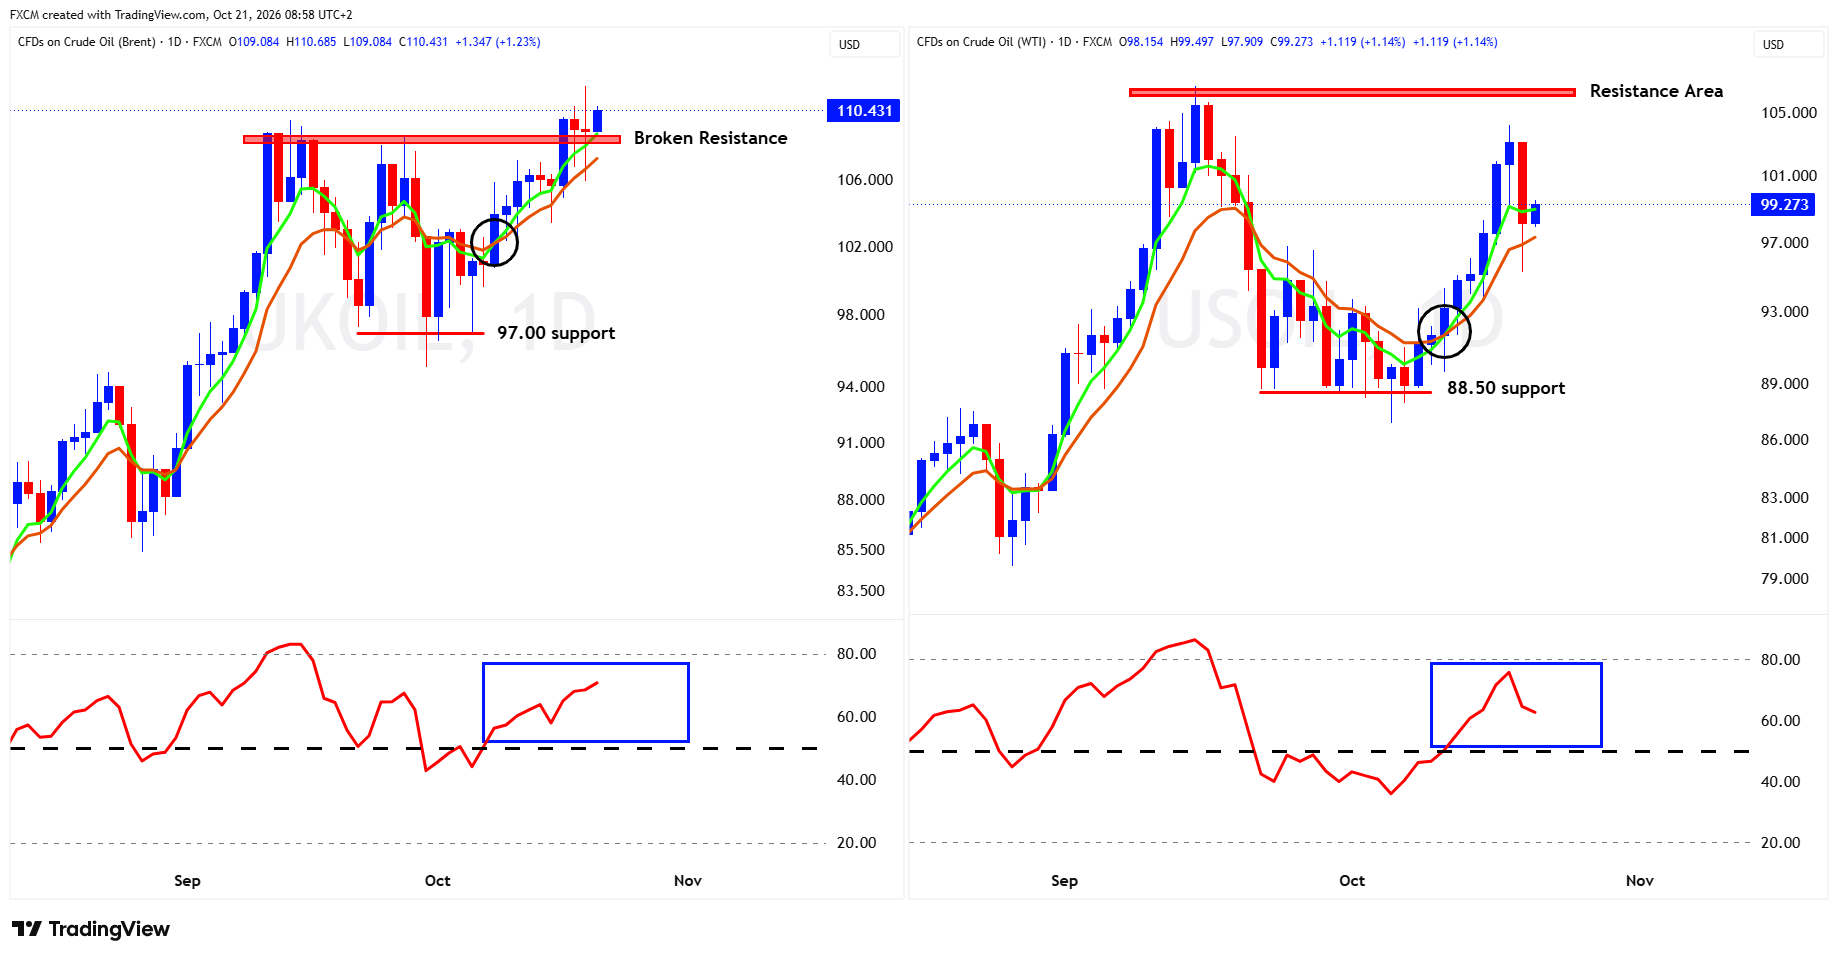
UKOil maintains a bullish technical outlook, with prices trading around $110 after breaking above the important $108 resistance area. This former resistance now becomes an initial support zone, reinforcing the positive price structure. Both moving averages are trending higher, while the RSI has climbed towards 70, indicating strengthening buying momentum without yet reaching overbought territory. The recent breakout opens the door for further gains towards $112 and potentially $115, provided buyers can defend the $108 area. However, a sustained move back below this level would weaken the bullish outlook and raise the possibility of a deeper pullback towards $105.
USOil is showing signs of renewed bullish momentum, although its recovery is less convincing than UKOil's. Prices are trading around $99 following a strong rebound from the $88.50 support area, with both moving averages beginning to turn higher. The RSI has recovered above 50, suggesting that buyers are regaining control, although its recent retreat highlights some hesitation. Immediate resistance sits around $102, followed by the more significant $106 area, where previous selling pressure emerged. A sustained break above these levels would strengthen the bullish case, while failure to maintain the recovery could expose initial support around $97, followed by $93 and ultimately $88.50.
Fundamental Perspective
Oil prices remain supported by mounting supply concerns in the Middle East, where renewed attacks on shipping and threats to Saudi energy infrastructure have unsettled an already fragile market. Adding to the positive sentiment, preliminary American Petroleum Institute data showed US crude inventories falling by 4.9 million barrels last week, pointing to further tightening in available supplies. However, the demand outlook remains a concern. The International Energy Agency expects global oil consumption to decline by 2.6 million barrels per day as elevated fuel prices and weaker economic conditions take their toll. Even so, depleted inventories and ongoing supply disruptions are expected to keep the market in deficit through year-end. For now, supply risks appear to be outweighing demand concerns, lending support to the bullish technical picture for UKOil and USOil. Much will depend on developments in the Middle East, where any credible diplomatic breakthrough could quickly ease supply fears and put renewed pressure on prices.
USDOLLAR
Technical Analysis
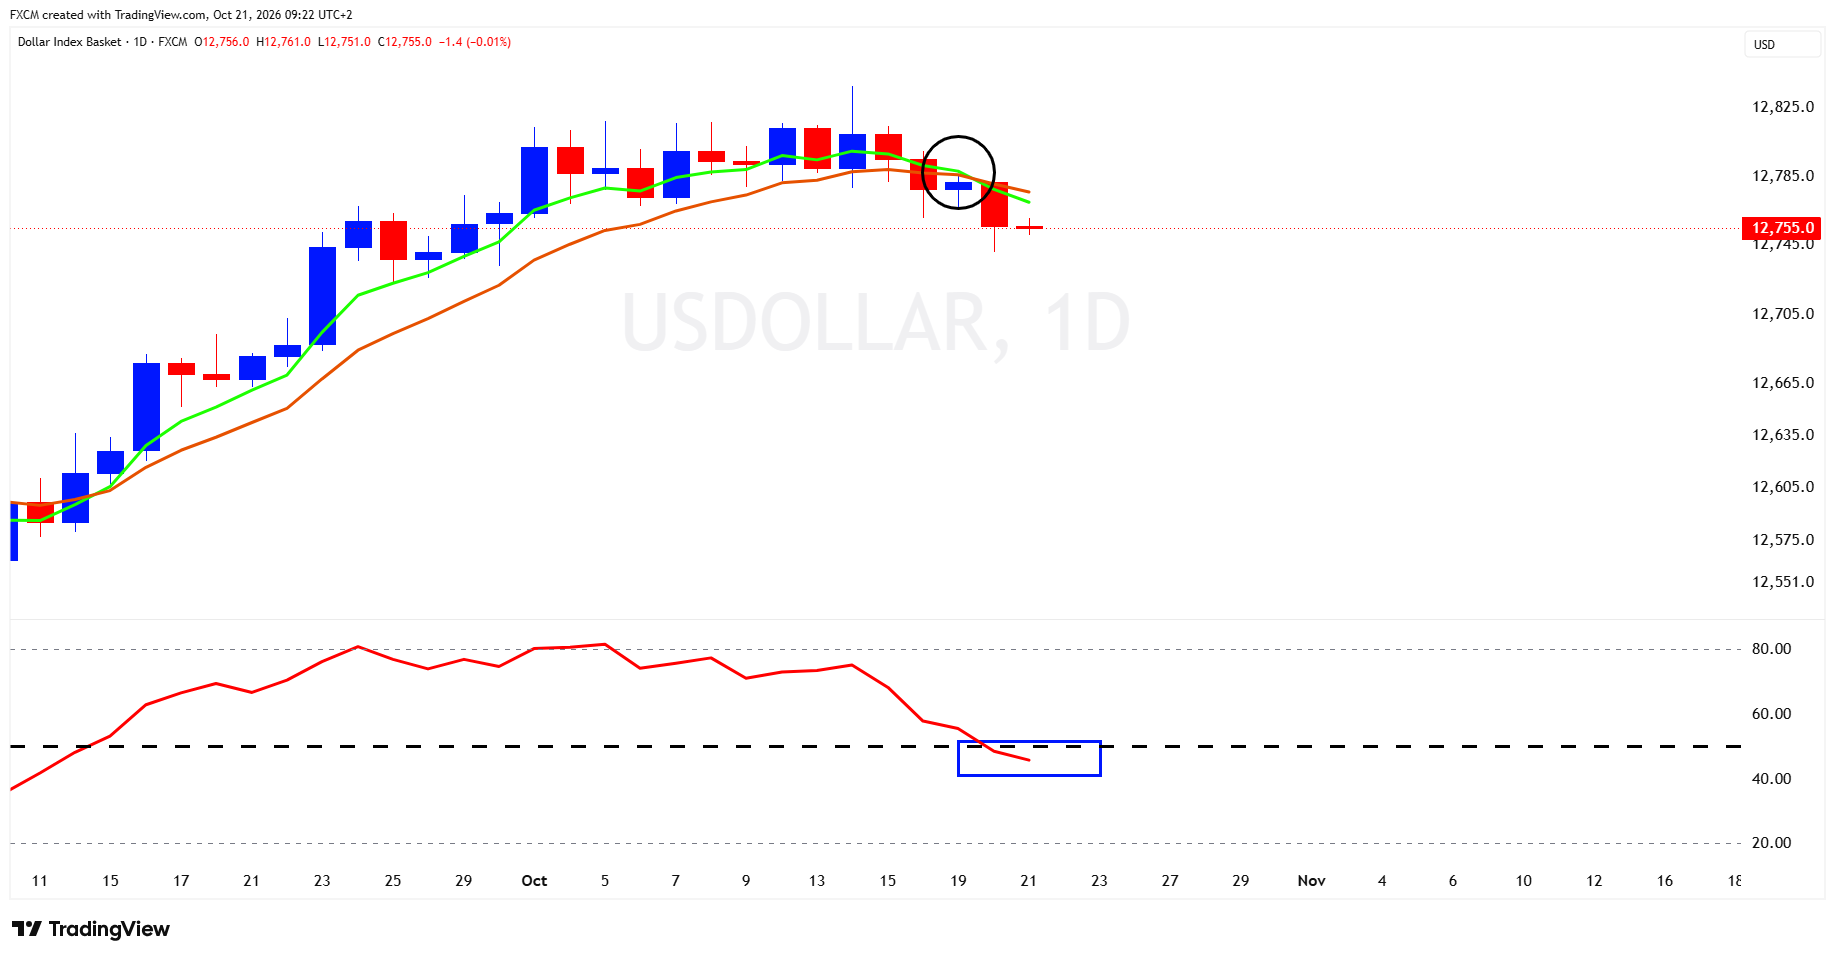
USDOLLAR is showing signs of weakening momentum following its recent rally, with prices slipping below both exponential moving averages (EMAs) as the shorter-term EMA crosses beneath its longer-term counterpart. This bearish crossover suggests that sellers are gaining control, while the RSI's move below the neutral 50 level reinforces the deteriorating technical picture. The longer the RSI remains below 50, the greater the risk of sustained selling pressure, potentially exposing support around 12,745, followed by 12,705. However, the broader uptrend is not necessarily over. A recovery above the moving averages, accompanied by the RSI reclaiming 50, would suggest that the recent weakness is merely a corrective pullback, potentially setting the stage for another advance towards 12,785 and 12,815.
Fundamental Perspective
The US dollar has lost some momentum as investors reassess the outlook for Federal Reserve interest rates. September's hotter-than-expected inflation figures initially pushed the greenback to an 18-month high, but more cautious comments from Fed officials and a subsequent retreat in Treasury yields have taken some of the shine off the rally. Markets now largely expect the Fed to leave rates unchanged at its October meeting, although further tightening remains a possibility later in the year. Meanwhile, concerns surrounding heavily indebted AI investments have added to market uncertainty. Nevertheless, the dollar is not without support. Elevated oil prices and persistent Middle East tensions continue to fuel inflation concerns, while geopolitical uncertainty could revive safe-haven demand. For now, softer yields and reduced expectations of an immediate rate hike lend weight to USDOLLAR's technical pullback. However, persistent inflation or a renewed rise in Treasury yields could provide the catalyst for another move higher.
Gold
Technical Analysis
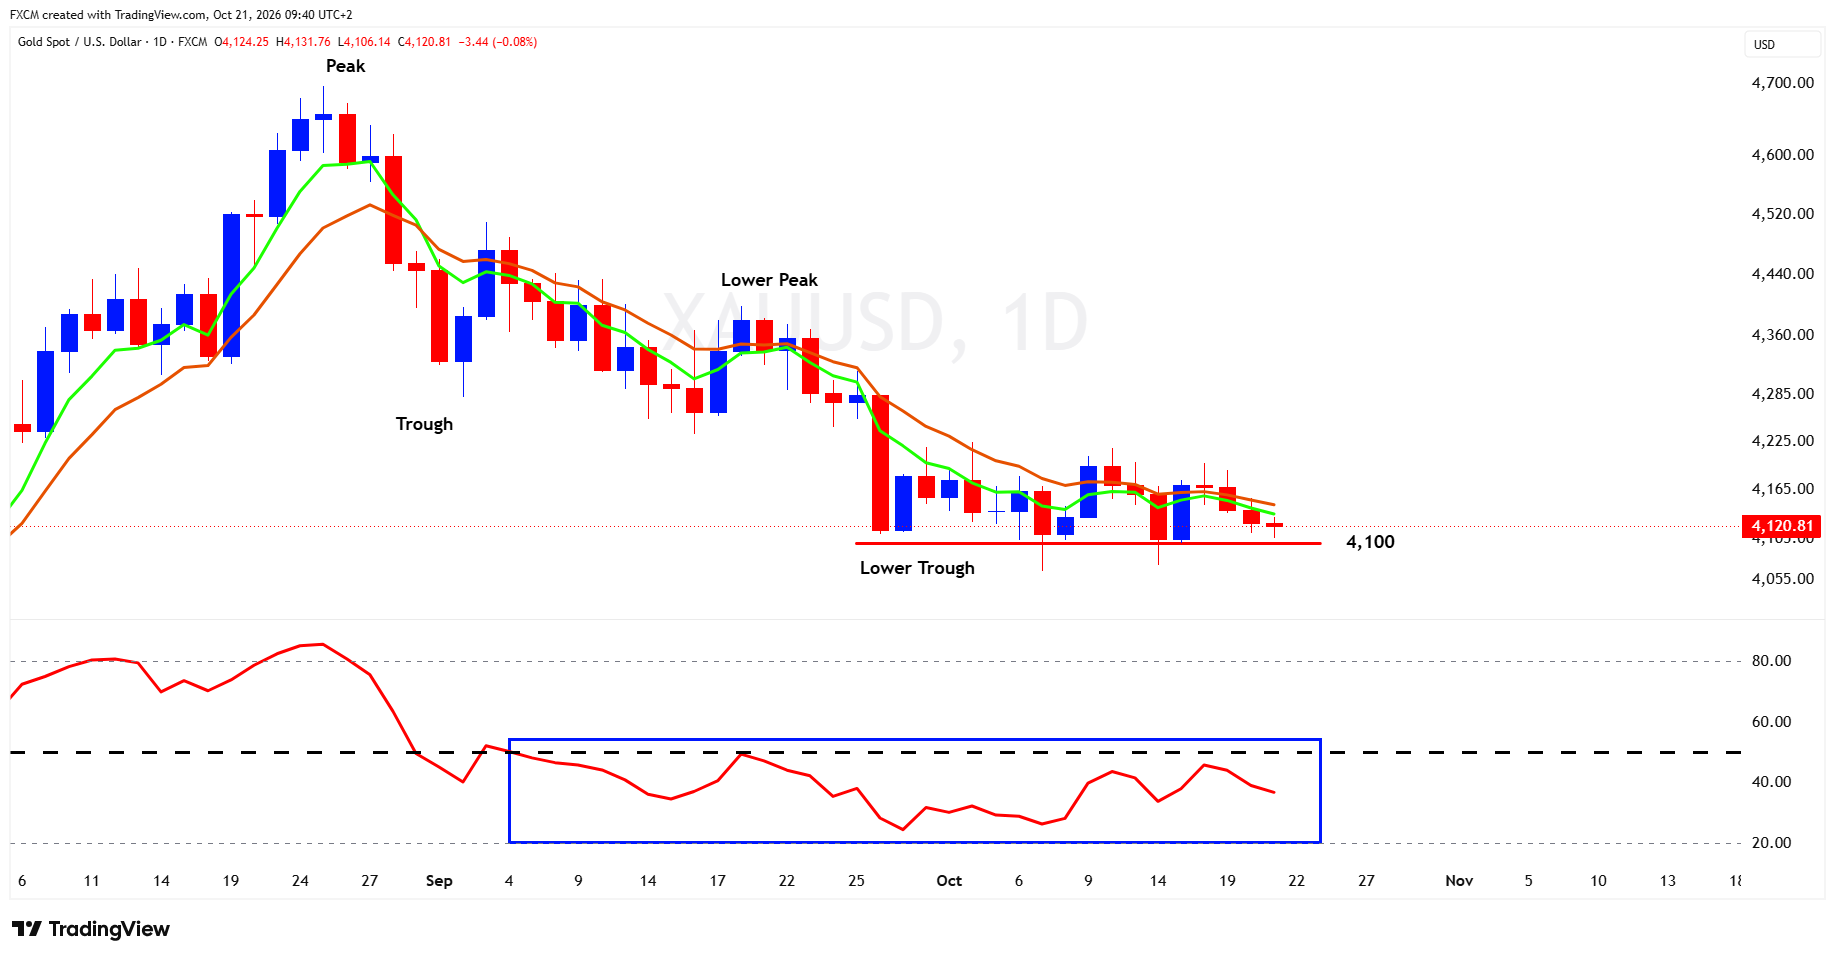
Gold remains under selling pressure, with prices trading around $4,120 as the broader bearish structure continues to dominate. The formation of successive lower peaks and troughs points to a sustained downtrend, while both exponential moving averages (EMAs) are sloping lower, reinforcing the negative outlook. The RSI has remained below the neutral 50 level since early September, suggesting that sellers continue to hold the upper hand. The longer it stays below this threshold, the greater the risk of further downside pressure. Immediate attention is on the important $4,100 support area, which has been tested repeatedly in recent sessions. A sustained break below this level could open the door towards $4,055 and potentially $4,000. However, if buyers successfully defend $4,100 and the RSI reclaims 50, gold could stage a recovery towards $4,165, followed by $4,225. Until then, the technical outlook remains bearish.
Fundamental Perspective
Gold remains under pressure as persistent inflation concerns strengthen expectations of further US interest rate increases. Rising oil prices, driven by renewed Middle East supply fears, have added to the inflationary outlook and complicated the Federal Reserve's policy decisions. Although investors largely expect the Fed to leave rates unchanged at its October meeting, a December increase remains firmly on the table, weighing on the appeal of non-yielding gold. A stabilising US dollar has added another obstacle for buyers. Nevertheless, the precious metal continues to benefit from longer-term support, particularly central bank demand and investment flows. The World Gold Council reported record global gold ETF holdings of 4,256 tonnes at the end of September, highlighting continued investor interest despite the recent price weakness. For now, inflation worries and expectations of tighter monetary policy reinforce gold's bearish technical outlook. However, a sustained decline in Treasury yields or a shift in Fed expectations could encourage buyers to return.
Index in Focus: SPX500
Technical Analysis
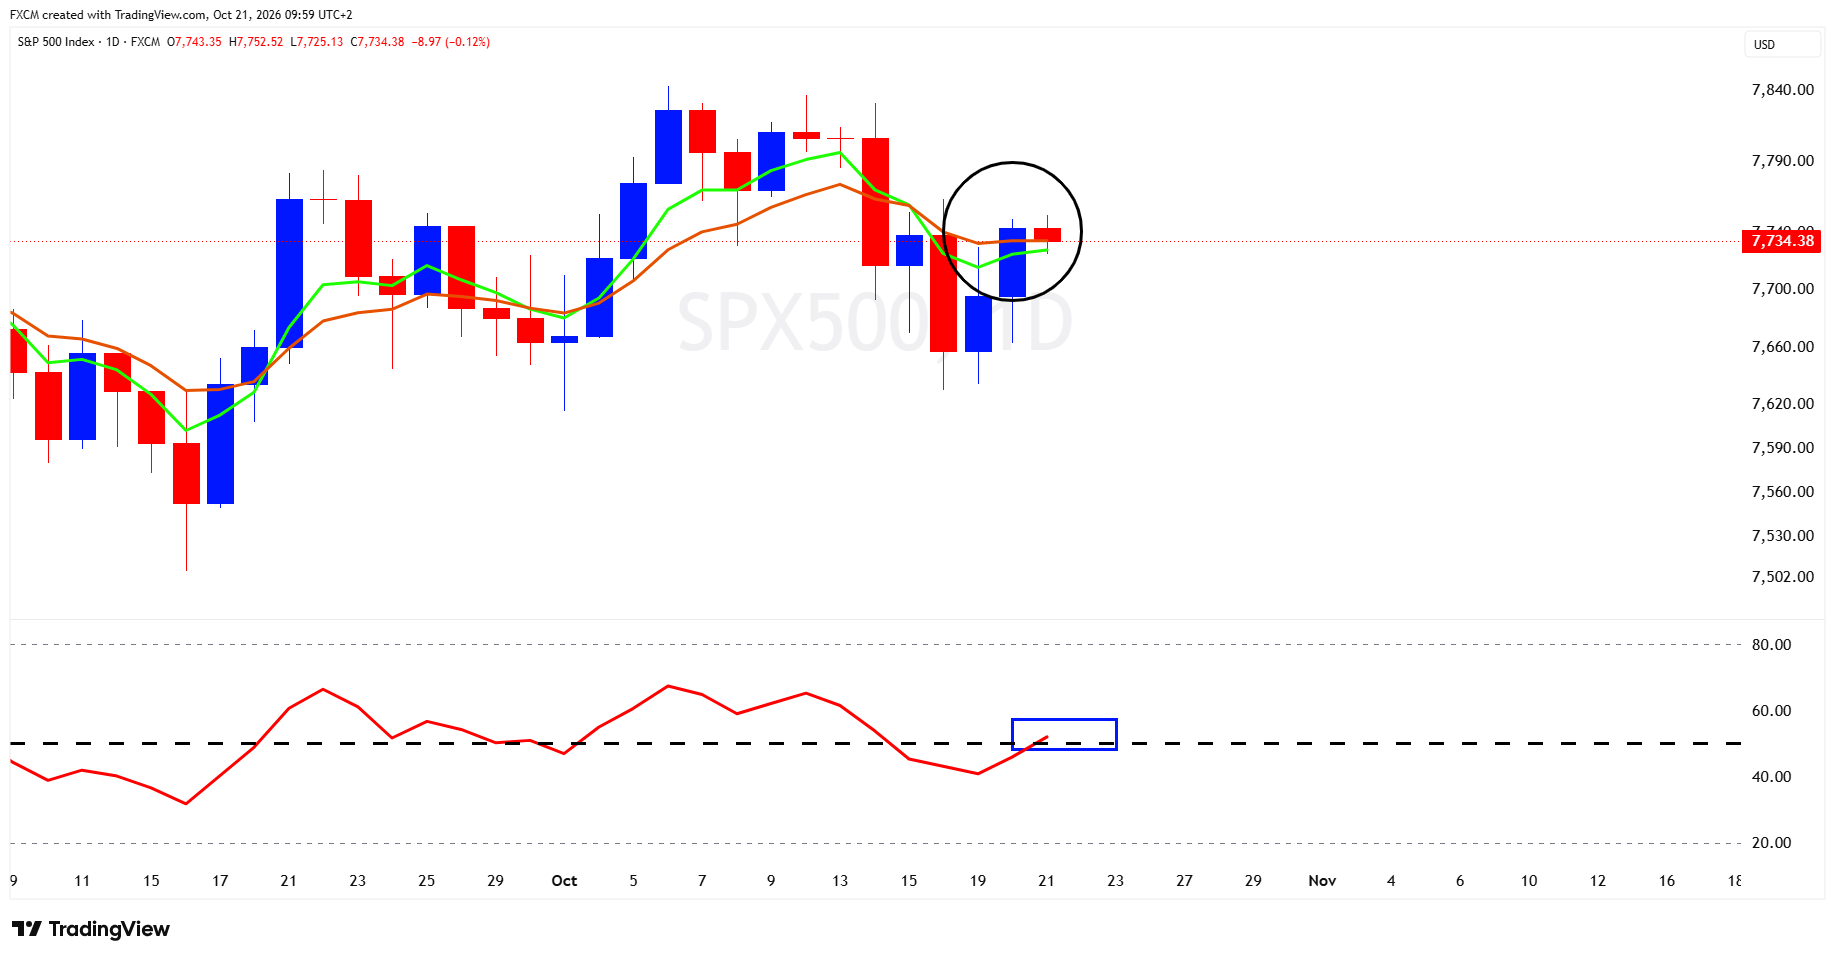
SPX500 is showing signs of recovery following its recent pullback, with prices trading around 7,734 as buyers attempt to regain control. Encouragingly, the RSI has climbed back above the neutral 50 level, suggesting that bullish momentum is beginning to return. If the indicator can remain above this threshold, it would strengthen the recovery case and increase the likelihood of the shorter-term exponential moving average (EMA) crossing above its longer-term counterpart, providing further bullish confirmation. However, the crossover has yet to materialise, leaving the recovery vulnerable to renewed selling pressure. A sustained move above 7,760 could open the door towards 7,790 and potentially the recent highs around 7,825. Conversely, failure to maintain the improving momentum could see prices retreat towards 7,700, followed by 7,660. For now, the outlook is cautiously optimistic, although confirmation of a sustained recovery is still needed.
Fundamental Perspective
The SPX500's tentative recovery is finding some support from corporate earnings and improving sentiment beyond the technology sector. US equities ended yesterday's session mostly higher, with healthcare stocks leading the gains and financials also performing strongly. A retreat in oil prices and longer-dated Treasury yields offered some relief, although concerns about inflation and borrowing costs have not disappeared. Meanwhile, investors largely expect the Federal Reserve to leave interest rates unchanged at its October meeting, but the prospect of another increase in December remains a potential obstacle. Questions surrounding the cost of artificial intelligence investment and elevated technology valuations are also keeping investors cautious. With the third-quarter earnings season gathering pace, company results and forward guidance will be important in determining whether the recovery has staying power. For now, encouraging earnings and broader participation across sectors lend support to the SPX500's improving technical picture, although another rise in oil prices or Treasury yields could quickly undermine confidence.

Russell Shor
Senior Market Strategist
Russell Shor is a Senior Market Strategist at FXCM, having been promoted to the role in 2025 in recognition of his depth of insight and consistent delivery of high-impact market analysis. He originally joined FXCM in October 2017 as a Senior Market Specialist.
Russell holds an Honours Degree in Economics from the University of South Africa, is a certified FMVA®, and a full member of the Society of Technical Analysts (UK). With over 20 years of experience in financial markets, his work is renowned for its clarity, precision, and strategic value across asset classes.

Any opinions, news, research, analyses, prices, other information, or links to third-party sites contained on this website are provided on an "as-is" basis, as general market commentary and do not constitute investment advice. The market commentary has not been prepared in accordance with legal requirements designed to promote the independence of investment research, and it is therefore not subject to any prohibition on dealing ahead of dissemination. Although this commentary is not produced by an independent source, FXCM takes all sufficient steps to eliminate or prevent any conflicts of interests arising out of the production and dissemination of this communication. The employees of FXCM commit to acting in the clients' best interests and represent their views without misleading, deceiving, or otherwise impairing the clients' ability to make informed investment decisions. For more information about the FXCM's internal organizational and administrative arrangements for the prevention of conflicts, please refer to the Firms' Managing Conflicts Policy. Please ensure that you read and understand our Full Disclaimer and Liability provision concerning the foregoing Information, which can be accessed here.