
Market Threads – Markets on Edge as New Catalysts Emerge

.png)
Tracking important market threads across currencies, commodities, and indices.
- UKOil and USOil push higher as Middle East tensions intensify. Can bullish momentum overcome key resistance levels?
- USDOLLAR pauses after its recent rally. Will cooling momentum or US inflation data decide its next move?
- Gold struggles to recover as Middle East tensions clash with Fed rate hike fears. Can the crucial $4,100 support level hold?
- The SPX500 holds its bullish momentum as earnings optimism fuels Wall Street. Can a break above 7,844 unlock the next rally?
The Bond Market's Inflation Dilemma
The bond market is facing an uncomfortable possibility. Inflation might be starting to ease, but that does not necessarily mean borrowing costs will follow. US Treasury yields have edged lower ahead of today's inflation figures, with the benchmark 10-year yield hovering around 5.20%. Headline inflation is expected to reach 3.6% in September, partly driven by higher energy prices, while core inflation is forecast at a more modest 2.5%. That gap could matter for the Federal Reserve as it weighs the case for another interest-rate increase. But inflation is not the only influence on bond yields. Heavy government borrowing, a resilient US economy and the extra compensation investors want for holding longer-dated debt are all part of the equation. For financial markets, that creates something of a dilemma. Equities would benefit from lower borrowing costs, while the dollar and gold remain sensitive to shifts in interest-rate expectations. Even if the inflation report brings some welcome relief, it may not be enough to push long-term yields substantially lower. Investors could therefore find themselves in a rather awkward position, with inflation gradually cooling but the cost of capital proving much harder to bring down.
Cross-Asset View
Financial markets are navigating a delicate balance between geopolitical uncertainty, shifting interest-rate expectations and the prospect of another round of corporate earnings growth. Oil is drawing renewed attention as tensions in the Middle East intensify, while the dollar and gold are showing signs of hesitation after their recent moves. Meanwhile, Wall Street continues to display resilience, although the next leg higher may prove harder to secure. With US inflation figures out today, the technical picture across these markets offers some interesting clues about where prices could be heading next.
Oil
Technical Analysis
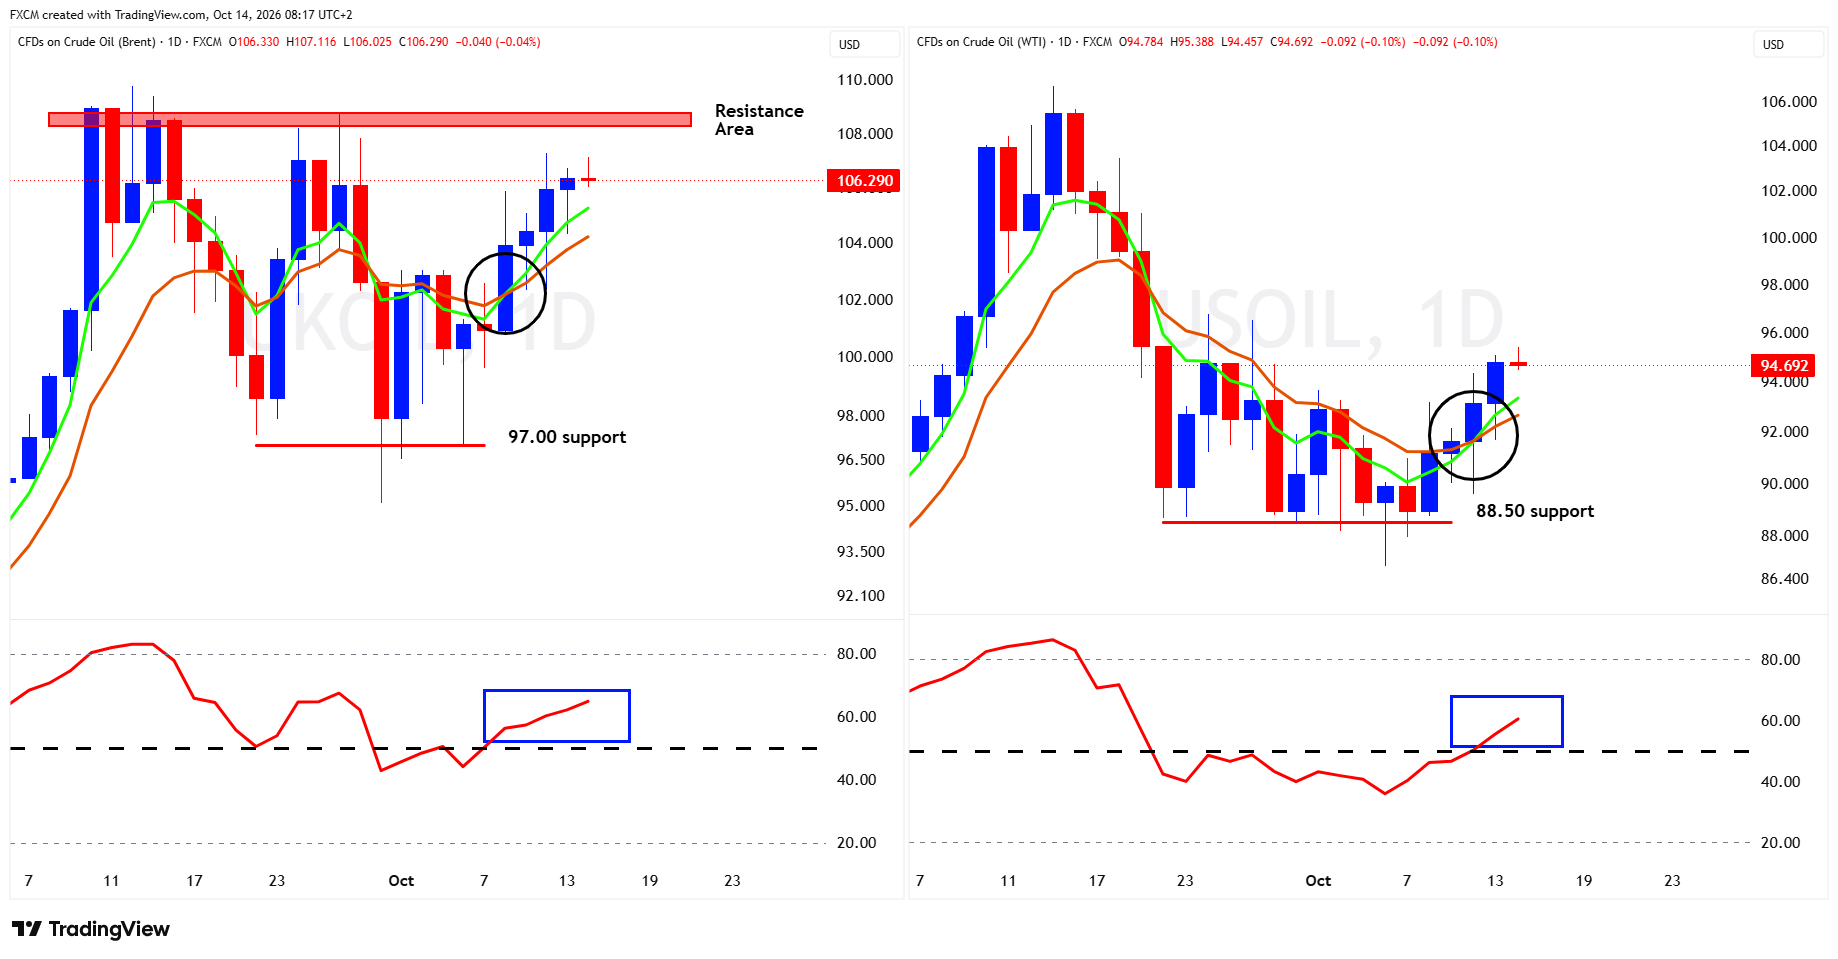
UKOil is showing signs of strengthening bullish momentum following its recovery from the $97.00 support region. Prices have moved back above both the short- and longer-term moving averages, with the shorter average turning higher and reinforcing the improving technical outlook. The Relative Strength Index (RSI) has also moved decisively above the neutral 50 level, suggesting that buying momentum is gathering pace without yet reaching overbought territory. However, the recovery faces an important test at the $108.50–$109.00 resistance zone, where previous advances have encountered selling pressure. A sustained break above this area would strengthen the bullish outlook and potentially open the way towards $110.00. Conversely, failure to overcome resistance could encourage profit-taking, with initial support around $104.00–$105.00, followed by the more significant $97.00 level.
USOil is also displaying improving technical conditions, although its recovery remains less convincing than UKOil's. After finding support around $88.50, prices have established a sequence of higher lows and recovered above both moving averages, suggesting that the recent downward pressure is easing. The shorter-term average is beginning to turn higher, while the RSI has climbed above 50 and towards 60, signalling a positive shift in momentum. Nevertheless, prices are approaching resistance around $95.00–$96.00, a region that could determine whether the recovery develops into a more sustained advance. A convincing breakout would bring $98.00 and potentially $100.00 into focus. Conversely, rejection at resistance could expose initial support around $92.00–$93.00, with $88.50 remaining the critical downside level.
Fundamental Perspective
Oil prices are finding support as tensions in the Middle East continue to escalate. Renewed attacks on commercial vessels near the Strait of Hormuz, coupled with Houthi strikes against Saudi targets, have raised fresh concerns about the security of regional oil supplies. The increasingly hostile exchanges between Washington and Tehran over control of the strait are adding to the unease. Still, there are forces working in the opposite direction. The prospect of increased Russian diesel exports is helping to temper price gains, while OPEC+ production is recovering despite the disruption to regional shipping. The group's output rose by roughly 900,000 barrels per day in September, according to OPEC's latest report. Demand is another concern, with OPEC cutting its forecast for global oil consumption growth in 2026 to just 200,000 barrels per day, half its previous estimate. For now, geopolitical tensions are giving UKOil and USOil a lift, but whether that momentum can be sustained will largely depend on how the threat to supplies develops against a backdrop of recovering production and sluggish demand growth.
USDOLLAR
Technical Analysis
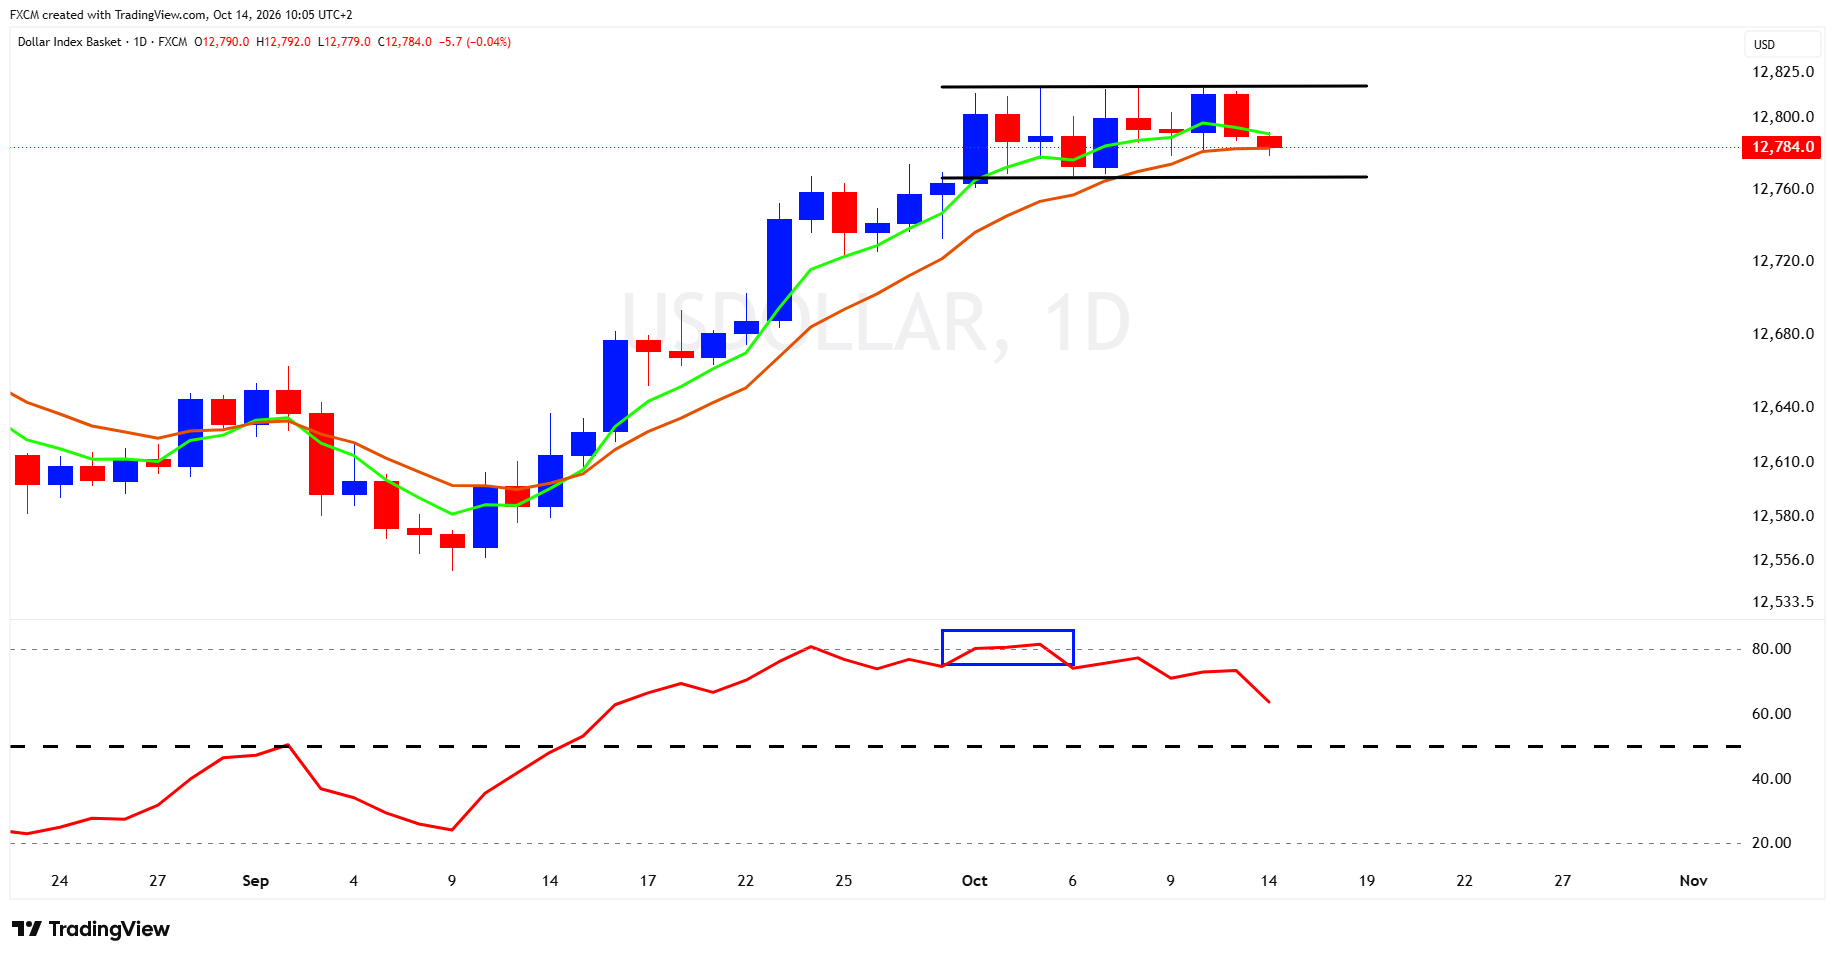
USDOLLAR has moved into a sideways consolidation pattern following its recent advance, suggesting that bullish momentum is taking a breather rather than necessarily reversing course. The earlier rally pushed the Relative Strength Index (RSI) into overbought territory, but the subsequent period of sideways trading has allowed the indicator to retreat to more neutral levels without a significant deterioration in the broader technical picture. This normalisation is potentially constructive, as it gives the market room to build momentum for another move higher. The key now is whether the RSI can hold above the 50 level, which would suggest that buyers still retain the upper hand and that the greenback remains supported. A sustained move below 50, however, could signal that bullish momentum is fading and leave USDOLLAR vulnerable to a deeper correction.
Fundamental Perspective
The dollar has lost some momentum after climbing to an 18-month high earlier this week, with investors weighing up the Federal Reserve's next move on interest rates. Although the Fed raised borrowing costs by 25 basis points in September, expectations of another increase this month have faded following more cautious comments from policymakers. That said, the underlying case for the greenback remains reasonably firm. Inflation is proving stubborn, Treasury yields remain elevated despite their recent retreat, and higher energy prices are threatening to add another layer of pressure. Attention now turns to today's US inflation figures, with headline consumer prices expected to rise 3.6% year-on-year in September, up from 3.4% in August. A stronger reading could revive speculation about further Fed tightening and give the dollar another lift, while softer figures may encourage investors to scale back those expectations. For now, the greenback appears to be taking a breather rather than facing a decisive shift in its fundamental outlook, although the inflation report could quickly change that picture.
Gold
Technical Analysis
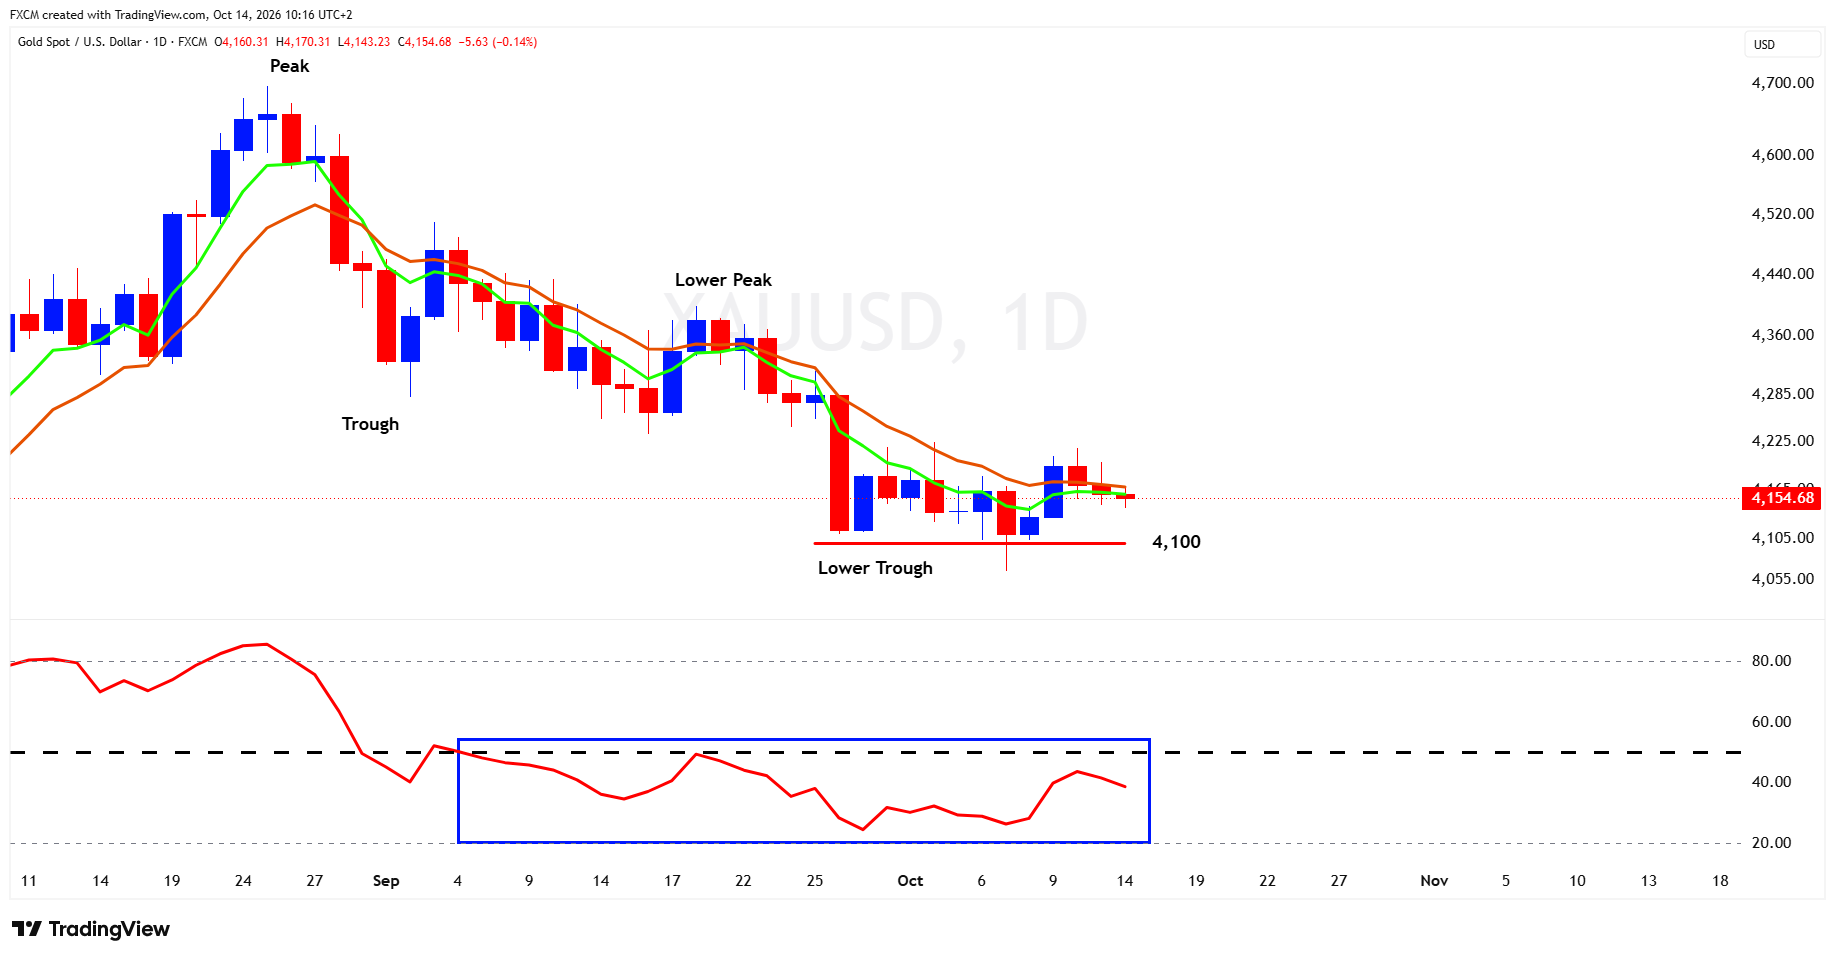
Gold remains under pressure, with the daily chart showing a clear sequence of lower peaks and lower troughs following its retreat from the late-August high near $4,650. Although prices have stabilised around the psychologically important $4,100 support level, the recovery has so far lacked conviction, with gold struggling to establish itself above the short- and longer-term moving averages. The Relative Strength Index (RSI) reinforces this cautious outlook, having remained below the neutral 50 level since early September. Notably, the indicator has recovered from near-oversold territory without breaking above 50, suggesting that selling pressure has eased but buyers have yet to regain control. A sustained move above $4,200 would be an encouraging first step towards challenging resistance around $4,285, while a decisive break below $4,100 could expose the $4,050 region and potentially the psychological $4,000 level.
Fundamental Perspective
Gold continues to struggle for direction as investors weigh mounting geopolitical tensions against the prospect of further US interest-rate increases. TThe dollar's recent strength and elevated Treasury yields have been particular headwinds for the precious metal, although both have eased somewhat in recent sessions. While the Federal Reserve is widely expected to leave rates unchanged in October, another increase before year-end remains a distinct possibility, limiting gold's appeal. Meanwhile, escalating tensions in the Middle East, particularly the renewed hostilities involving Saudi Arabia and Iran-backed Houthis, are keeping safe-haven demand in the picture, even if they have done little to spark a meaningful recovery. Much now rests on today's US inflation report, with annual headline inflation expected to climb to 3.6% in September from 3.4% in August. A stronger reading could reinforce expectations of further Fed tightening and put gold under renewed pressure. Softer figures, however, may take some of the heat out of Treasury yields and the dollar, offering the metal a chance to recover. For now, geopolitical uncertainty is providing a potential cushion, but the prospect of higher US interest rates remains a significant obstacle to a sustained rally.
Index in Focus: SPX500
Technical Analysis
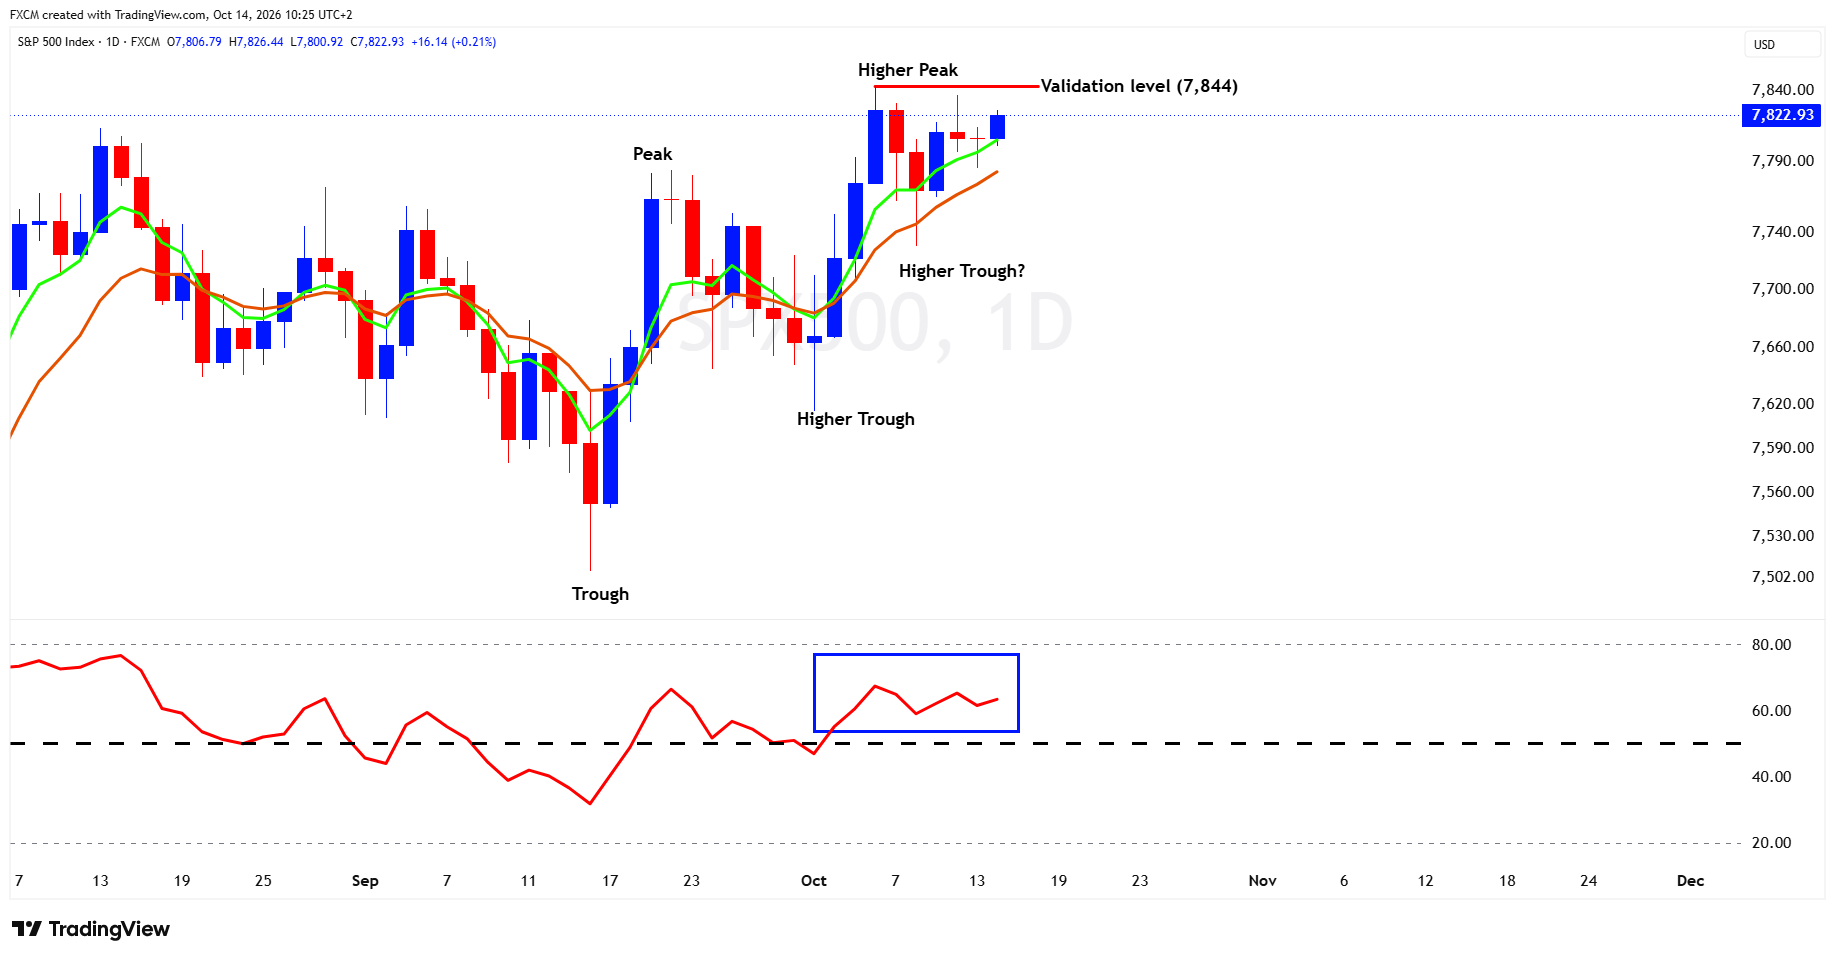
The SPX500's technical picture remains encouraging, with a higher trough followed by a higher peak, suggesting that buyers still have the upper hand. The recent pullback has done little to disturb that structure and may be setting the stage for another higher trough, although it is too early to call it confirmed. The level to watch is 7,844. A convincing break above this resistance would validate the developing bullish pattern and strengthen the case for further gains. Momentum is also holding up reasonably well, with the Relative Strength Index (RSI) remaining above the neutral 50 level despite easing from its recent highs. As long as the indicator holds above 50, the underlying bullish bias remains intact. For now, the SPX500 appears to be taking a breather rather than signalling a change in direction, with a breakout above 7,844 potentially providing the next leg higher.
Fundamental Perspective
The SPX500 continues to find support from an encouraging corporate earnings outlook, although investors are becoming more discerning as Wall Street trades near record highs. Third-quarter profits are expected to grow by around 30% year-on-year, with technology and artificial intelligence doing much of the heavy lifting. However, the market's muted response to the first round of major bank earnings suggests that strong results alone may no longer be enough to impress investors. Elevated Treasury yields and high oil prices are also keeping inflation concerns in focus, raising questions about how much further equities can climb. Attention now turns to today's US inflation report, with annual headline inflation expected to reach 3.6% in September, up from 3.4% in August. Softer figures could ease pressure on bond yields and give the market another reason to push higher, while an upside surprise may revive concerns about further Federal Reserve tightening. For now, the earnings outlook remains a source of strength, but with expectations already running high, companies will need to deliver if the rally is to maintain its momentum.

Russell Shor
Senior Market Strategist
Russell Shor is a Senior Market Strategist at FXCM, having been promoted to the role in 2025 in recognition of his depth of insight and consistent delivery of high-impact market analysis. He originally joined FXCM in October 2017 as a Senior Market Specialist.
Russell holds an Honours Degree in Economics from the University of South Africa, is a certified FMVA®, and a full member of the Society of Technical Analysts (UK). With over 20 years of experience in financial markets, his work is renowned for its clarity, precision, and strategic value across asset classes.

Any opinions, news, research, analyses, prices, other information, or links to third-party sites contained on this website are provided on an "as-is" basis, as general market commentary and do not constitute investment advice. The market commentary has not been prepared in accordance with legal requirements designed to promote the independence of investment research, and it is therefore not subject to any prohibition on dealing ahead of dissemination. Although this commentary is not produced by an independent source, FXCM takes all sufficient steps to eliminate or prevent any conflicts of interests arising out of the production and dissemination of this communication. The employees of FXCM commit to acting in the clients' best interests and represent their views without misleading, deceiving, or otherwise impairing the clients' ability to make informed investment decisions. For more information about the FXCM's internal organizational and administrative arrangements for the prevention of conflicts, please refer to the Firms' Managing Conflicts Policy. Please ensure that you read and understand our Full Disclaimer and Liability provision concerning the foregoing Information, which can be accessed here.