
Market Threads – Markets Turn More Selective as Rates Reassert Their Grip

.png)
Tracking important market threads across currencies, commodities, and indices.
- Oil's rally is fading, and with charts and supply both turning bearish, the next move could be big.
- The dollar's rally is roaring ahead, with strong momentum, surging yields and a hawkish Fed seemingly pointing higher.
- Gold is stuck under pressure as yields and the dollar climb, and this bounce looks more like relief than reversal.
- The SPX500 is stuck at a crossroads, with AI optimism and record yields locked in a standoff, and 7,780 or 7,650 will decide the next move.
PCE Inflation Keeps the Fed on Guard
Today's US PCE inflation report is unlikely to give the Federal Reserve much comfort, with headline and core inflation expected to remain well above its 2% target. Economists expect headline prices to rise 0.4% in August and core prices 0.3%, while broader signs of resilient consumer demand suggest the economy is continuing to hold up despite higher energy costs. The picture may be complicated by the BEA's annual revisions and methodological changes to several PCE components, which could mechanically alter some reported inflation rates and make the underlying trend harder to interpret. For the Fed, the key question will therefore be whether any apparent easing reflects genuine disinflation or statistical revisions. With inflation still elevated and policymakers signalling that further tightening may be necessary, another rate hike this year remains firmly in play.
Cross-Asset View
Cross-asset signals are becoming increasingly interesting as September draws to a close. Oil is losing momentum as improving physical supply begins to offset geopolitical risk, while USDOLLAR remains supported by firm US yields and a still restrictive policy backdrop. Gold is struggling against that combination of higher yields and dollar strength, although oversold conditions leave room for short-term stabilisation. SPX500, meanwhile, is caught between resilient technology leadership and a less comfortable macro backdrop of elevated yields, weak breadth and softer confidence. Taken together, the message is not one of outright stress, but of markets becoming more selective, more sensitive to rates and increasingly dependent on confirmation from both price and momentum.
Oil
Technical Analysis
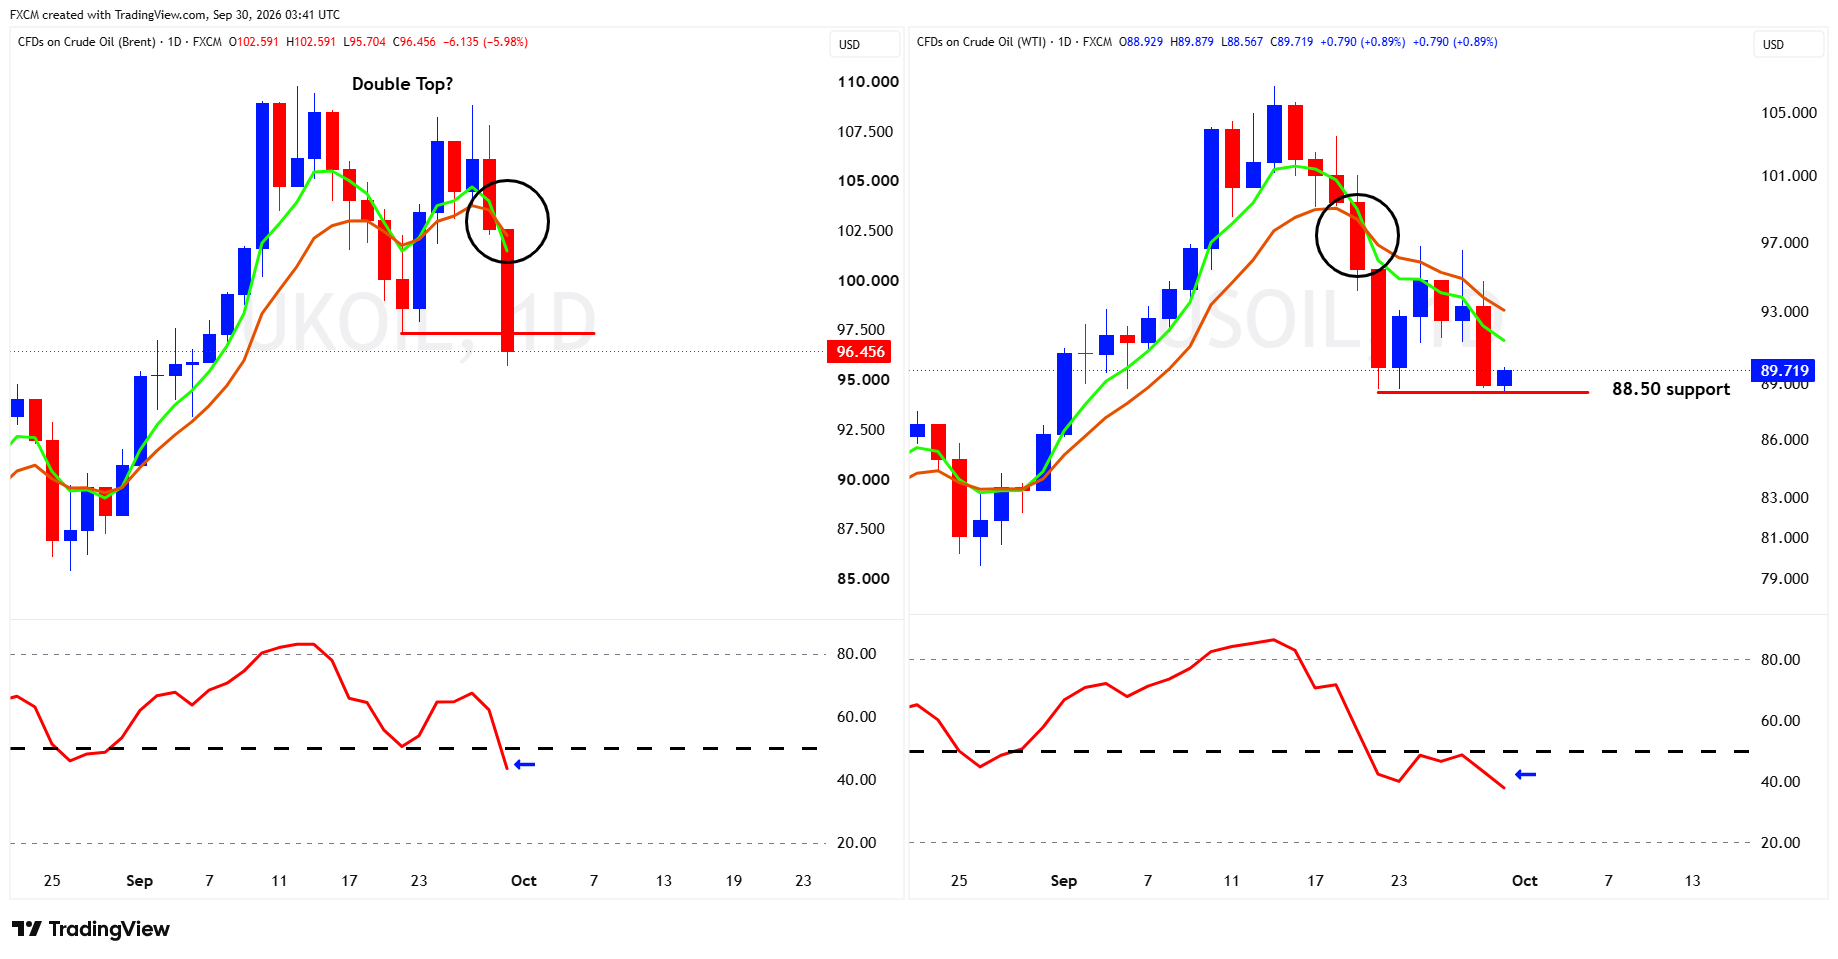
UKOil has taken a notable technical turn lower. The fast EMA has crossed beneath the slower EMA, while RSI has slipped below 50 and is falling, pointing to deteriorating momentum after September's strong advance. More importantly, price action is beginning to resemble a double-top formation, with the latest sharp sell-off breaking beneath the neckline support zone near US$97–98. That breakdown gives the pattern greater credibility and shifts the technical bias firmly towards the downside. The next question is whether UKOil can quickly reclaim the broken neckline area; failure to do so would leave rallies looking corrective rather than the start of a renewed uptrend. RSI is not yet deeply oversold, suggesting there may still be room for further weakness before momentum becomes stretched.
USOil is also under pressure, with the EMA crossover turning bearish and RSI holding below 50, confirming that sellers currently have the momentum advantage. The decline has been more orderly than UKOil's, but price is now testing an important support area around US$88.50, which makes the next few sessions particularly important. A sustained break beneath that level would complete another leg lower and reinforce the developing sequence of lower highs and lower lows, while a successful defence could trigger a short-term relief bounce towards the falling EMAs around the low-to-mid $90s. For now, however, those declining averages are acting as dynamic resistance and RSI remains subdued, so the burden of proof has shifted to the bulls.
Fundamental Perspective
The fundamental picture is beginning to reinforce the softer technical signals. September's oil rally was underpinned by fears of Middle Eastern supply disruption, but physical flows are now improving. Crude exports from major regional producers rebounded to 16.33 million barrels a day in September, their highest since the war began in February, while Saudi Arabia has restarted its East-West Pipeline and resumed tanker loadings from Yanbu. That recovery helped drive yesterday's sharp pullback in oil, and Washington has added another potential supply cushion by offering an exchange of up to 40 million SPR barrels, although those deliveries are scheduled for November and December rather than immediately. Geopolitical risk has by no means disappeared; UKOil and USOil rebounded early Wednesday after President Trump denied reports that he was prepared to ease sanctions on Iran, but the market is increasingly having to balance that risk against improving physical supply. That makes the bearish EMA crossovers and sub-50 RSI readings more interesting: for the moment, the fundamentals are no longer fighting the charts.
USDOLLAR
Technical Analysis
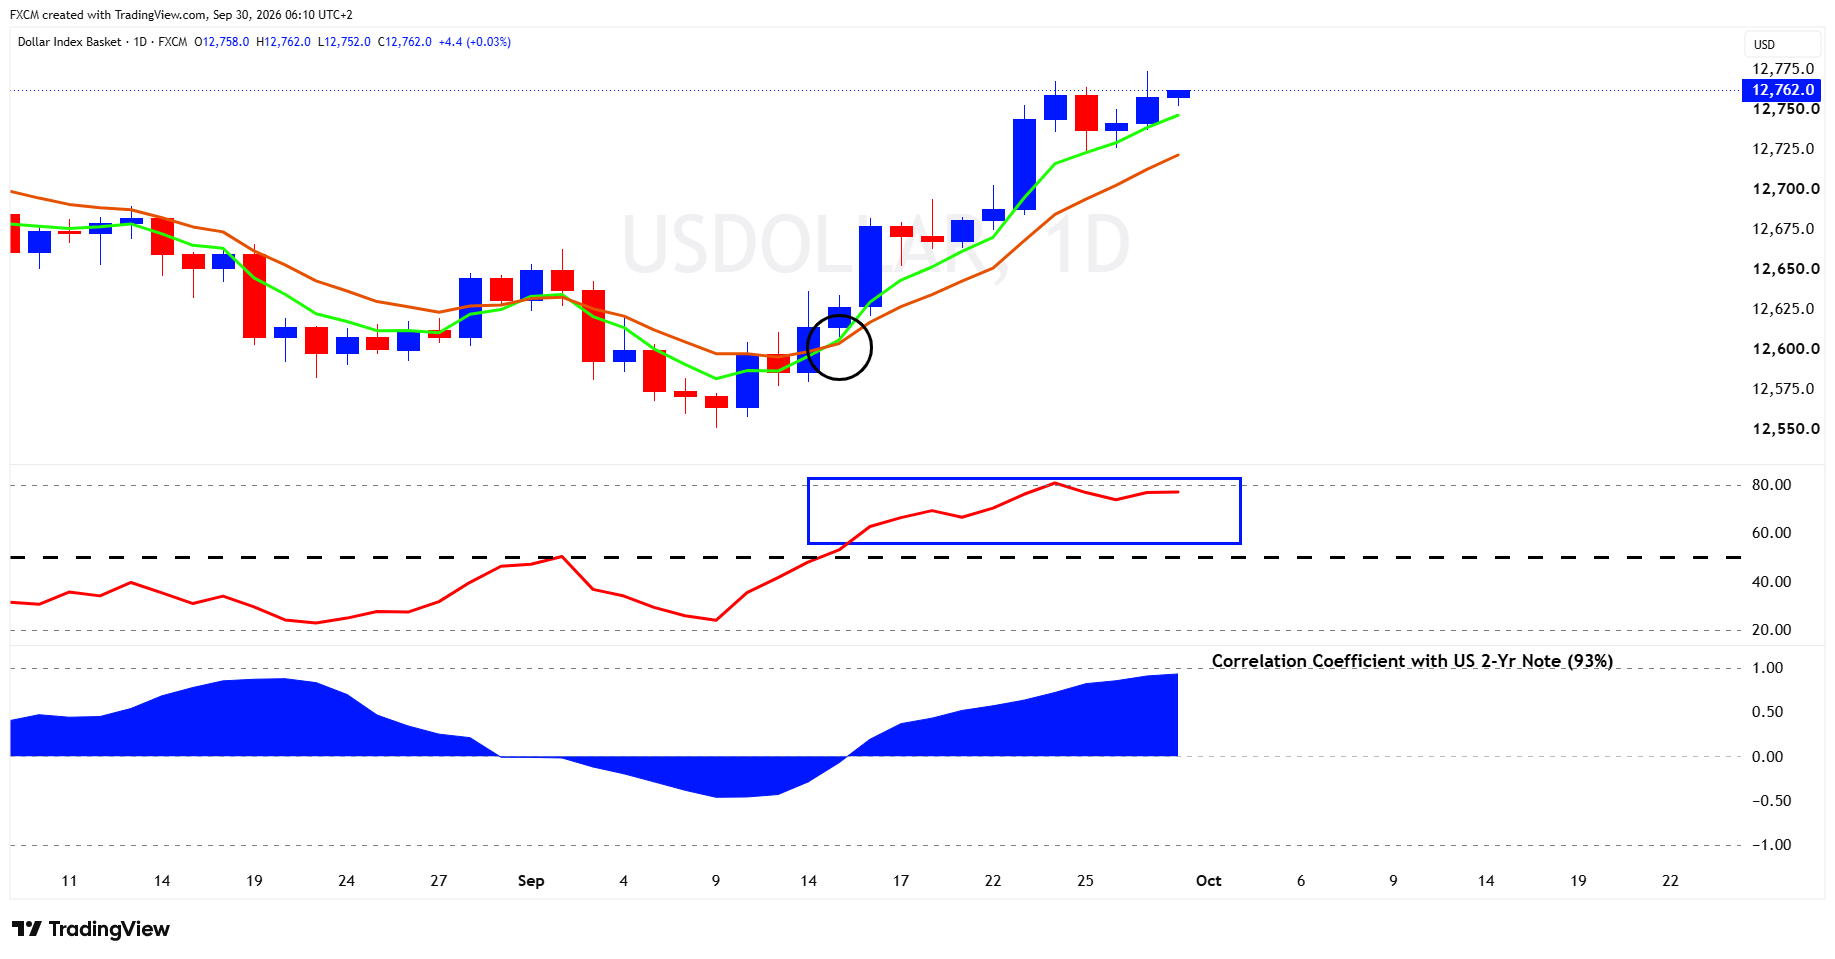
USDOLLAR remains technically strong, with the faster EMA above the slower EMA and both moving higher, confirming that the short-term trend remains firmly upward. RSI is comfortably above 50 and sitting in the mid-to-upper 70s, signalling strong underlying momentum, and the longer it holds above 50, the more support it provides to the advance. That said, momentum is becoming stretched as RSI approaches the 80 overbought area, so some consolidation would not be surprising after the sharp September rally. Price is also pressing against its recent high around 12,760, making this an important near-term test. A decisive move through that area would reinforce the bullish structure, while a failure to break higher could produce a pause back towards the rising EMAs without necessarily damaging the broader trend. Particularly interesting is the chart's roughly 93 percent positive correlation with the US two-year Treasury yield, suggesting that movements in short-dated US rates remain an important influence on the dollar. As long as the bullish EMA structure remains intact, RSI holds above 50 and US yields stay supportive, the technical balance continues to favour USDOLLAR strength.
Fundamental Perspective
The fundamental backdrop fits the bullish USDOLLAR chart surprisingly well. The Federal Reserve raised rates to 3.75 to 4.00 percent earlier this month, and 16 of 18 policymakers projected at least one further increase this year as persistent inflation, resilient domestic spending and strong investment keep the US economy running relatively hot. That shift has pushed Treasury yields sharply higher, with the 10-year yield around 5.24 percent and the two-year near 4.89 percent, more than 50 basis points above its end-August level. The resulting yield advantage has been a powerful tailwind for the dollar, while concerns over energy costs, debt and political uncertainty in Europe have added pressure on competing currencies. There is one wrinkle worth watching, with New York Fed President John Williams saying there is no urgency to tighten again, which pushed the market probability of an October hike down from 71 percent to around 53 percent. Even so, the bigger picture remains supportive for USDOLLAR. US yields are high, monetary policy has turned more restrictive, and the economy has so far absorbed those higher rates reasonably well, giving the bullish EMA structure and above-50 RSI a solid fundamental foundation rather than leaving the rally dependent on technical momentum alone.
Gold
Technical Analysis
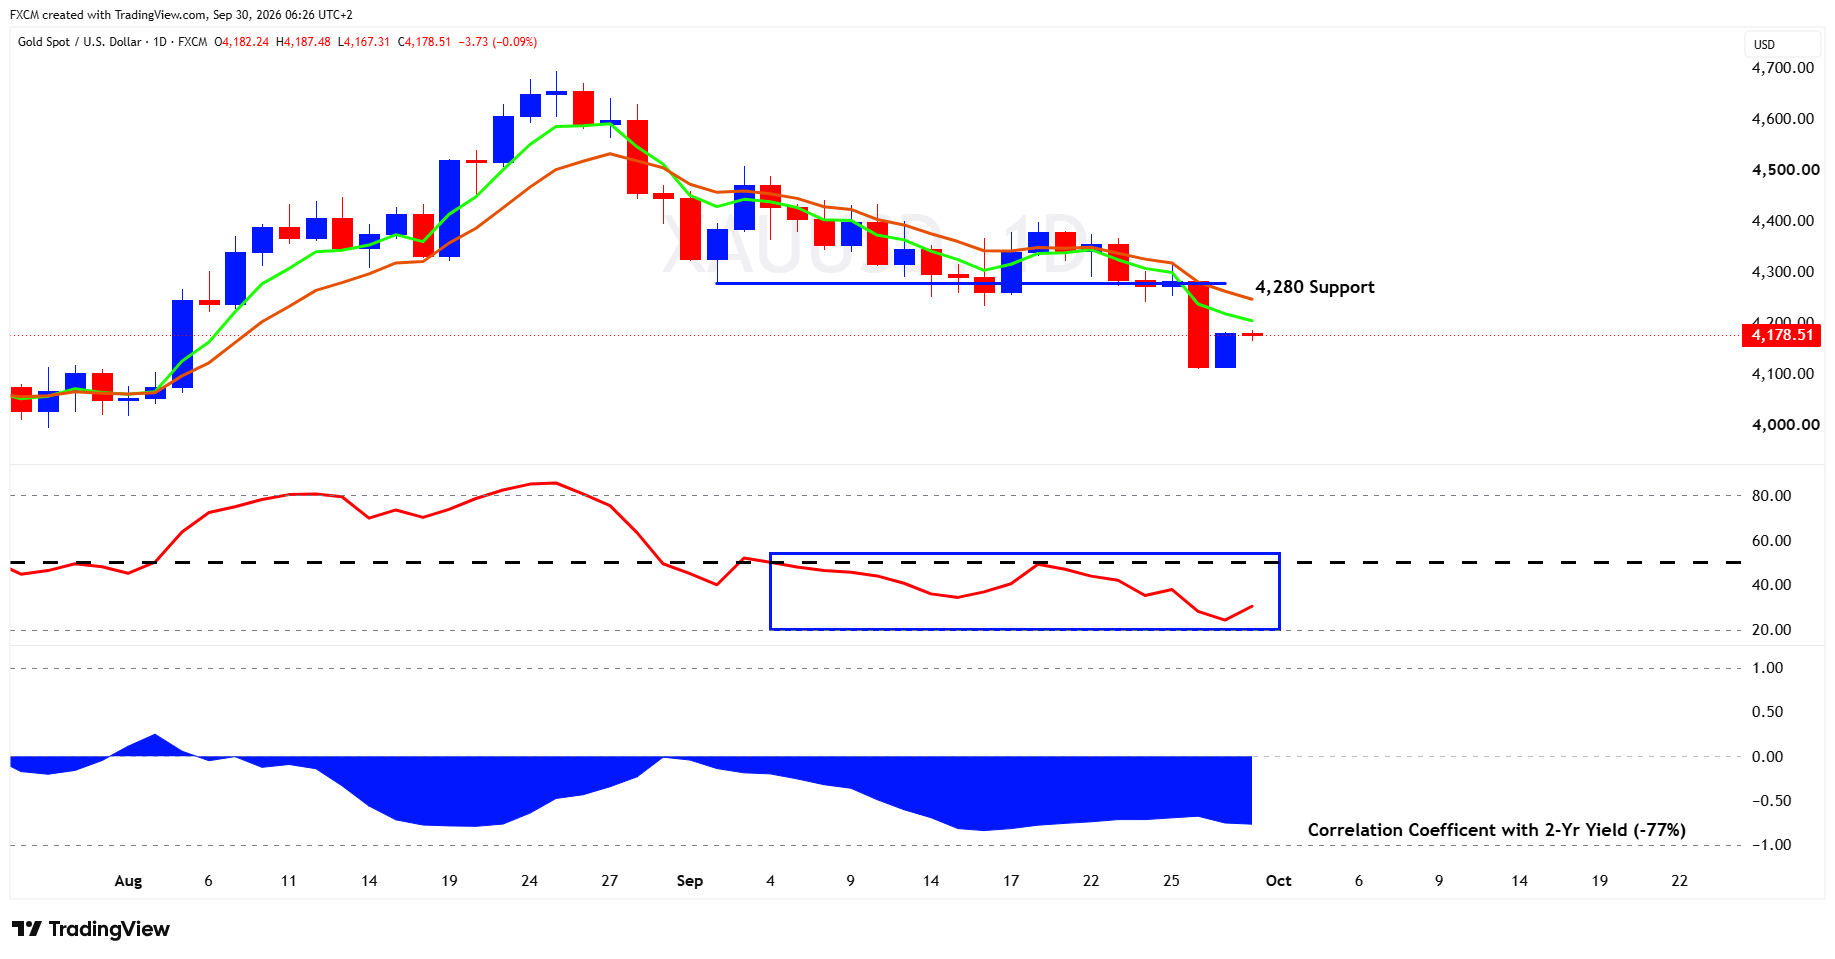
Gold's technical picture remains under pressure. Price has broken decisively below the 4,280 support area, which now becomes the first important resistance zone, while both EMAs are sloping lower and the faster average remains beneath the slower one, confirming a bearish trend structure. RSI is still below 50, so underlying momentum remains negative, although its rebound from near 20 suggests the market is trying to stabilise after becoming oversold. The recent bounce from around 4,110 is therefore worth watching, but unless gold can reclaim 4,280 and push back above the falling EMAs, it looks more like a relief rally than a genuine trend reversal. The broader pattern of lower highs and lower lows also keeps sellers in control, while the roughly 77 percent negative correlation with the US two-year Treasury yield is especially relevant, since further strength in yields would remain a headwind for gold. For now, the chart says the pressure is easing slightly, but the trend has not yet turned.
Fundamental Perspective
Higher US Treasury yields and a stronger dollar remain powerful headwinds, with spot gold having fallen to a seven-week low of $4,110.69 on Monday as rising oil prices fuelled inflation concerns and expectations of further Federal Reserve tightening. Those pressures remain significant. The US two-year yield is still more than 50 basis points higher in September, while the dollar is heading for a monthly gain. Higher yields increase the opportunity cost of holding non-yielding gold, while dollar strength makes the metal more expensive for buyers using other currencies. There has been some relief after New York Fed President John Williams said there was no urgency to raise rates again immediately, but markets still expect another increase this year and US borrowing costs remain elevated. The Middle East conflict remains a complicating factor because it can encourage safe-haven demand, yet its recent impact through higher oil prices, inflation expectations and bond yields has worked against gold. For now, the balance of those forces remains consistent with the bearish EMA structure, broken support and RSI below 50 seen on the chart.
Index in Focus: SPX500
Technical Analysis
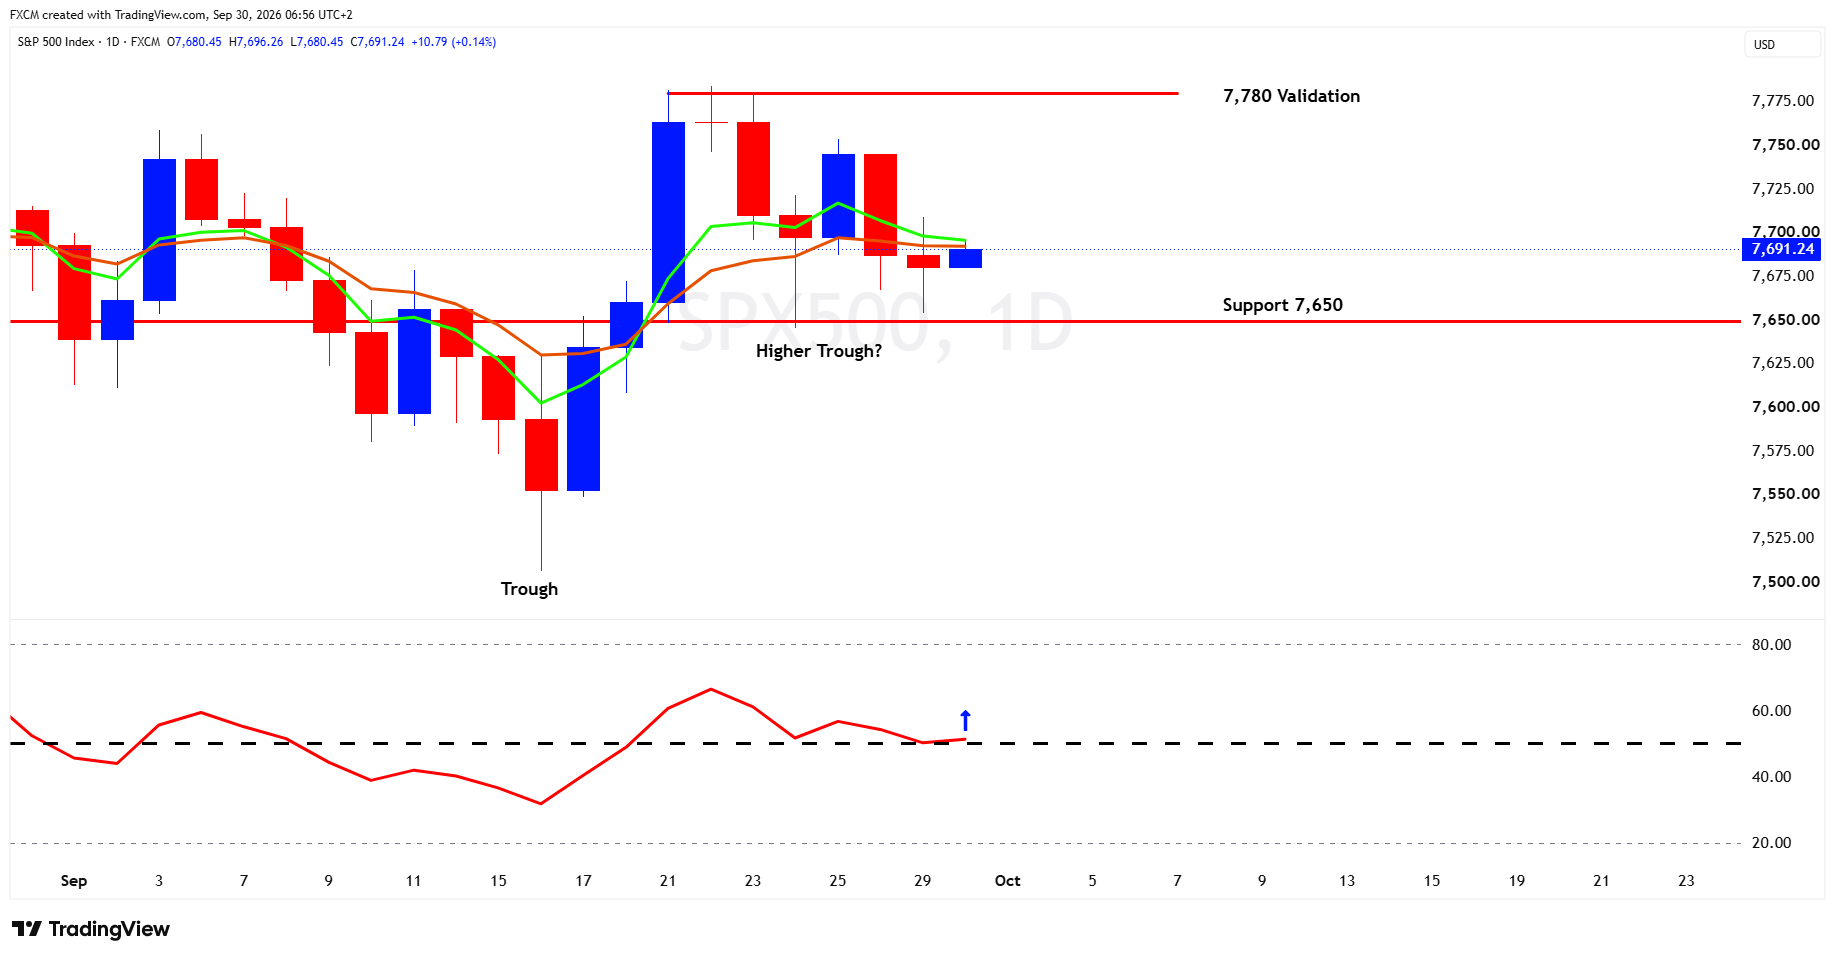
The SPX500 is at an interesting technical crossroads, with the recent pullback potentially setting up a higher trough above the mid-September low. That pattern is not confirmed yet, however, and the key validation level remains 7,780. A decisive move above that level would complete the higher trough structure and suggest that buyers have regained control. The 7,650 area is equally important on the downside. Holding above it keeps the constructive setup alive, while a sustained break below 7,650 would undermine the higher trough thesis and materially weaken the chart. Momentum also needs to improve. RSI is hovering only just above 50, which is effectively neutral, so a stronger and sustained move above 50 would provide much better confirmation that underlying buying momentum is building. Conversely, an RSI break below 50 that persists, particularly alongside a loss of 7,650, would strengthen the bearish case. The EMAs are also beginning to flatten and converge, reinforcing the sense that the market is currently undecided. For now, the index is sitting between clearly defined levels, with 7,780 offering bullish confirmation and 7,650 acting as the line the bulls need to defend.
Fundamental Perspective
The fundamental backdrop fits the SPX500's indecisive technical picture remarkably well. AI and technology shares continue to provide important support, helping keep the index close to its recent highs, but beneath the surface the market is considerably less comfortable. US bond yields remain a major obstacle, with the 10-year Treasury yield reaching 5.293 percent yesterday, its highest since June 2007, and the 30-year touching 5.6206 percent, its highest since June 2002. Higher yields raise financing costs and reduce the relative attraction of equities. There are also signs of strain away from the headline index, with market breadth weak and US consumer confidence falling to a twelve-and-a-half-year low in September. Some pressure eased after New York Fed President John Williams said there was no urgency for another immediate rate increase, but investors now face today's PCE inflation report and Friday's payroll data for the next clues on rates. That leaves SPX500 caught between persistent AI optimism and an increasingly demanding rates environment, a balance that fits the chart well. A break above 7,780 would strengthen the constructive case, while a loss of 7,650 would suggest that the fundamental headwinds are beginning to gain the upper hand.

Russell Shor
Senior Market Strategist
Russell Shor is a Senior Market Strategist at FXCM, having been promoted to the role in 2025 in recognition of his depth of insight and consistent delivery of high-impact market analysis. He originally joined FXCM in October 2017 as a Senior Market Specialist.
Russell holds an Honours Degree in Economics from the University of South Africa, is a certified FMVA®, and a full member of the Society of Technical Analysts (UK). With over 20 years of experience in financial markets, his work is renowned for its clarity, precision, and strategic value across asset classes.

Any opinions, news, research, analyses, prices, other information, or links to third-party sites contained on this website are provided on an "as-is" basis, as general market commentary and do not constitute investment advice. The market commentary has not been prepared in accordance with legal requirements designed to promote the independence of investment research, and it is therefore not subject to any prohibition on dealing ahead of dissemination. Although this commentary is not produced by an independent source, FXCM takes all sufficient steps to eliminate or prevent any conflicts of interests arising out of the production and dissemination of this communication. The employees of FXCM commit to acting in the clients' best interests and represent their views without misleading, deceiving, or otherwise impairing the clients' ability to make informed investment decisions. For more information about the FXCM's internal organizational and administrative arrangements for the prevention of conflicts, please refer to the Firms' Managing Conflicts Policy. Please ensure that you read and understand our Full Disclaimer and Liability provision concerning the foregoing Information, which can be accessed here.