
AlphaTrack – SPX500 Coils Ahead of Key Earnings

Thoughtful insights and approachable analysis.
- Alphabet Earnings Preview - Can AI Spending Finally Unlock the Next Breakout?
- Tesla Earnings Preview - Can Rebounding Deliveries Overcome Margin Pressure and Cash Burn?
- Intel Earnings Preview - Can AI Growth and Foundry Progress Reignite the Turnaround?
Quick Market Overview
US stocks began the week on a cautious note as renewed tensions between the US and Iran pushed oil prices higher. Investor attention is now shifting to a busy earnings calendar led by several Big Tech companies, with around 88% of companies reporting so far beating earnings expectations. With little economic data due this week, corporate results are likely to determine whether the broader market can regain momentum.
General Equity Market Health (SPX500)
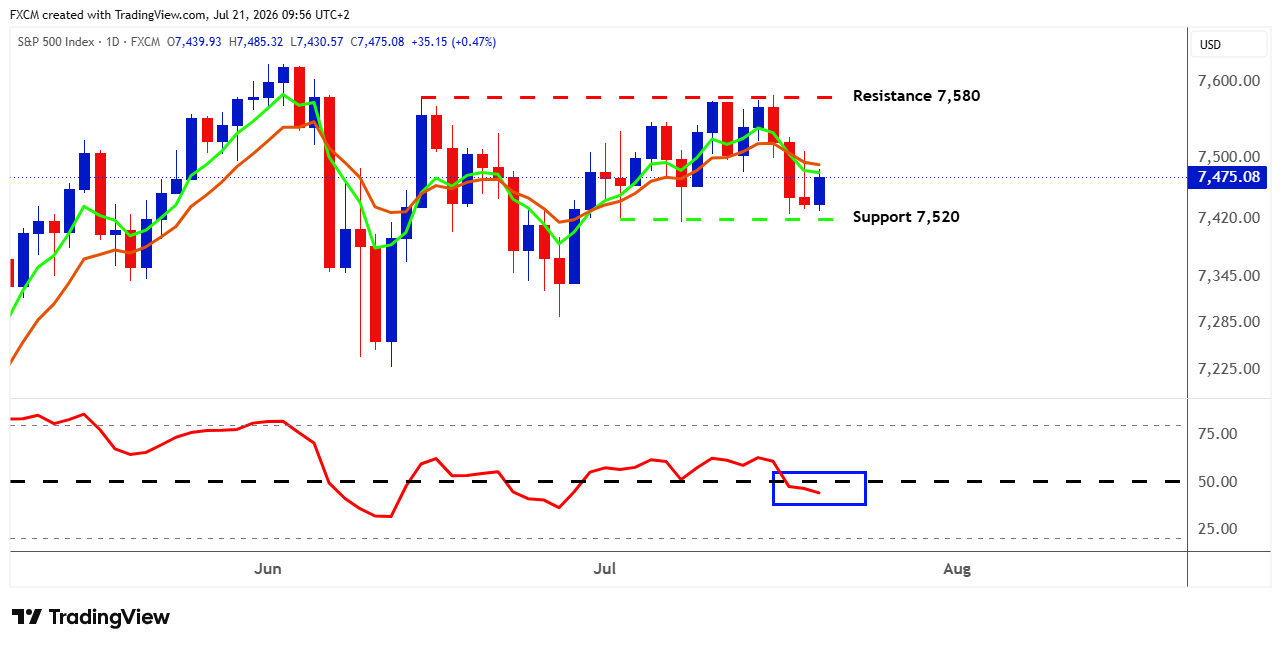
The SPX500 is trapped in a tightening range, with buyers defending the lower boundary near 7,420 while sellers continue to cap rallies around 7,580. Price remains below the short-term moving averages, and RSI is still under 50, showing that momentum has weakened rather than decisively reversed. A move back above 7,520 would improve the near-term picture and put 7,580 back in play, while a break below 7,420 would expose the June support zone around 7,300. For now, the market is neither breaking down nor breaking out; it is compressing, and that usually means the next decisive move could be sharper than the recent price action suggests.
The SPX500 enters the busiest part of earnings season with a strong start but limited tolerance for disappointment: blended second-quarter earnings growth stands at 24.7%, while 88% of the companies reporting so far have beaten EPS estimates. Alphabet, Tesla and Intel now provide an important test of whether heavy investment, particularly in artificial intelligence, is producing sufficient growth, margins and returns.
Strong guidance could revive an assault on 7,580, while cautious outlooks would challenge an index trading above its longer-term average valuation. At the same time, renewed Middle East tensions and higher oil prices threaten additional cost and inflation pressure, leaving corporate earnings as the principal market catalyst during the Fed's pre-meeting communications blackout.
Potential Trade Setups
Alphabet, Tesla and Intel report into a market that is becoming increasingly selective. Across all three, investors will be looking beyond headline earnings to judge whether heavy spending on AI, manufacturing and growth is translating into stronger margins, cash flow and credible execution. With each share price sitting at an important technical inflection point, guidance may matter more than the beat itself.
Alphabet Inc. - Class C (GOOG.us)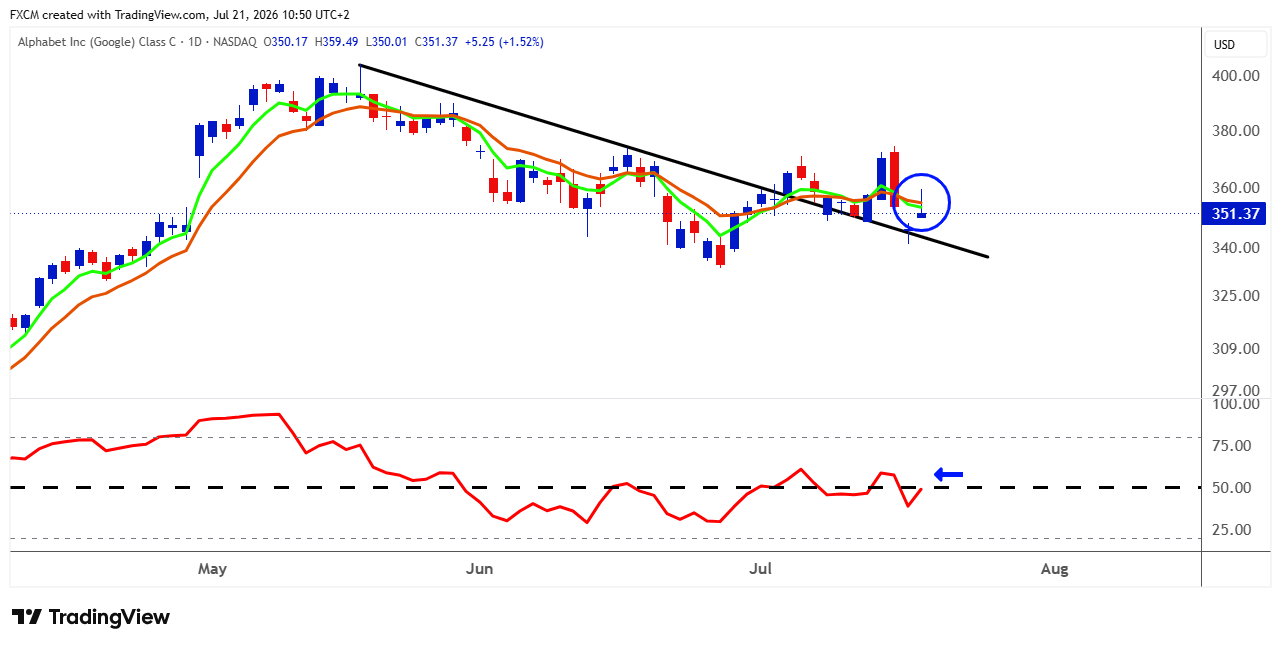
Technical Analysis
Alphabet is trying to stabilise after a multi-month decline, but the chart has not yet delivered a convincing bullish signal. Price is hovering around the falling trendline and short-term moving averages, while RSI is only testing the neutral 50 level rather than establishing positive momentum.
The setup would improve materially if RSI can move above 50 and hold there, while the faster EMA crosses back above the slower EMA and price follows through above the recent $360-$365 area. Until then, the stock remains caught between tentative recovery and renewed weakness, making tomorrow's earnings report the potential catalyst for either a confirmed trend reversal or another rejection.
Caveat
If RSI remains below 50, it would signal weak momentum and leave the share price vulnerable to further pressure.
Fundamental Perspective
When Alphabet reports after the close tomorrow, investors will look beyond the headline earnings figures and focus on whether its vast AI spending is producing real returns without undermining Search, the business that still funds the group.
Search advertising rose 19% to $60.4 billion last quarter, so continued growth will be closely watched, while Cloud may be the bigger swing factor after revenue jumped 63% to $20 billion, margins reached 32.9% and backlog climbed to $462 billion.
Attention will also turn to Alphabet's $180-190 billion capital-spending plan for 2026, the prospect of even higher investment in 2027, and whether demand for Gemini, AI infrastructure and TPU hardware can justify the cost. Alphabet has already proved it can compete in AI; it now needs to show that monetisation can grow faster than depreciation and infrastructure spending.
Tesla Motors Inc. (TSLA.us)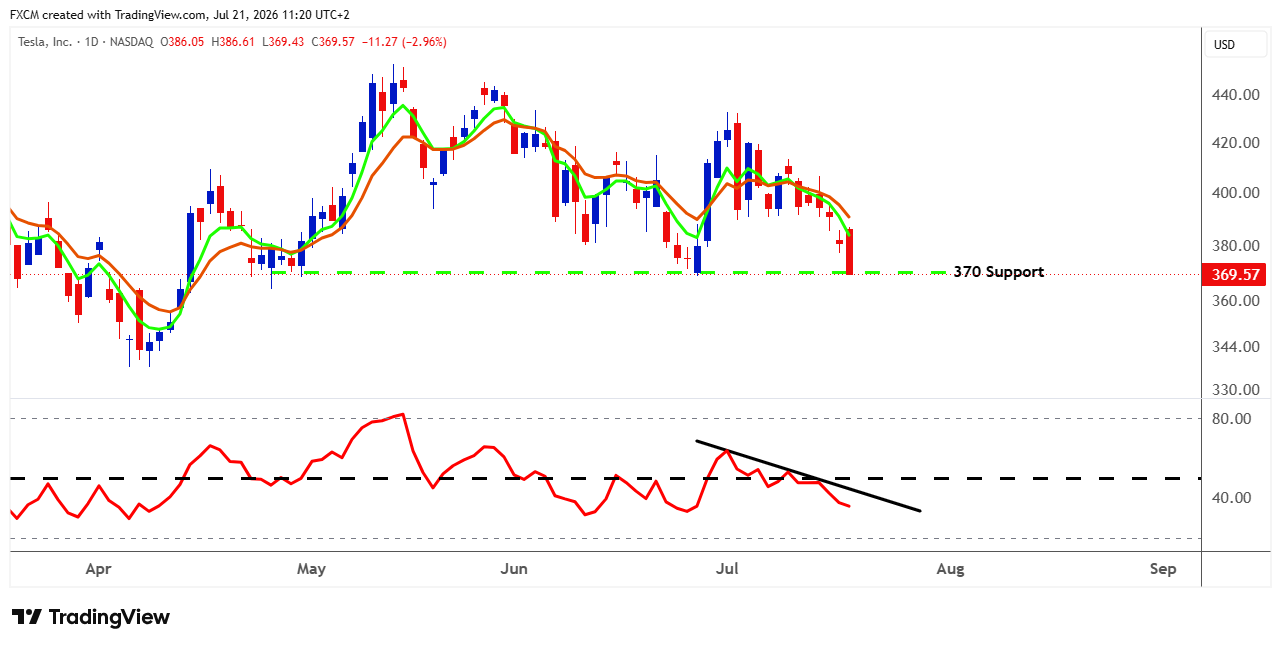
Technical Analysis
Technically, Tesla remains fragile, with $370 acting as the key line of support. A decisive break below that level would weaken the structure and increase the risk of further downside. Momentum is also soft, with RSI below 50; it needs to move above 50 and hold there before the chart can offer meaningful support to the share price. The EMAs remain bearishly aligned and are still sloping lower, so the setup will only become more constructive if they begin to flatten, converge and eventually cross bullishly.
Caveat
If RSI remains below 50, the risk of further support failing will rise, leaving the share price under continued pressure.
Fundamental Perspective
When Tesla reports after the close tomorrow, investors will look beyond its 480,126 vehicle deliveries and focus on whether stronger demand came at the expense of profitability. Automotive gross margin excluding regulatory credits will be closely watched, particularly after lower-priced models and financing incentives helped support sales, while Tesla's own consensus points to $27.6 billion in revenue and a 19.5% overall gross margin.
Attention will also turn to Robotaxi, FSD and Optimus, and whether progress is strong enough to justify roughly $6.7 billion of quarterly capital spending and expected negative free cash flow of about $3.25 billion. Energy storage could provide support after deployments reached 13.5 GWh, but the key question is whether Tesla can turn rising vehicle volumes into enough cash to fund its ambitious AI strategy without sustained cash burn.
Intel (INTC.us)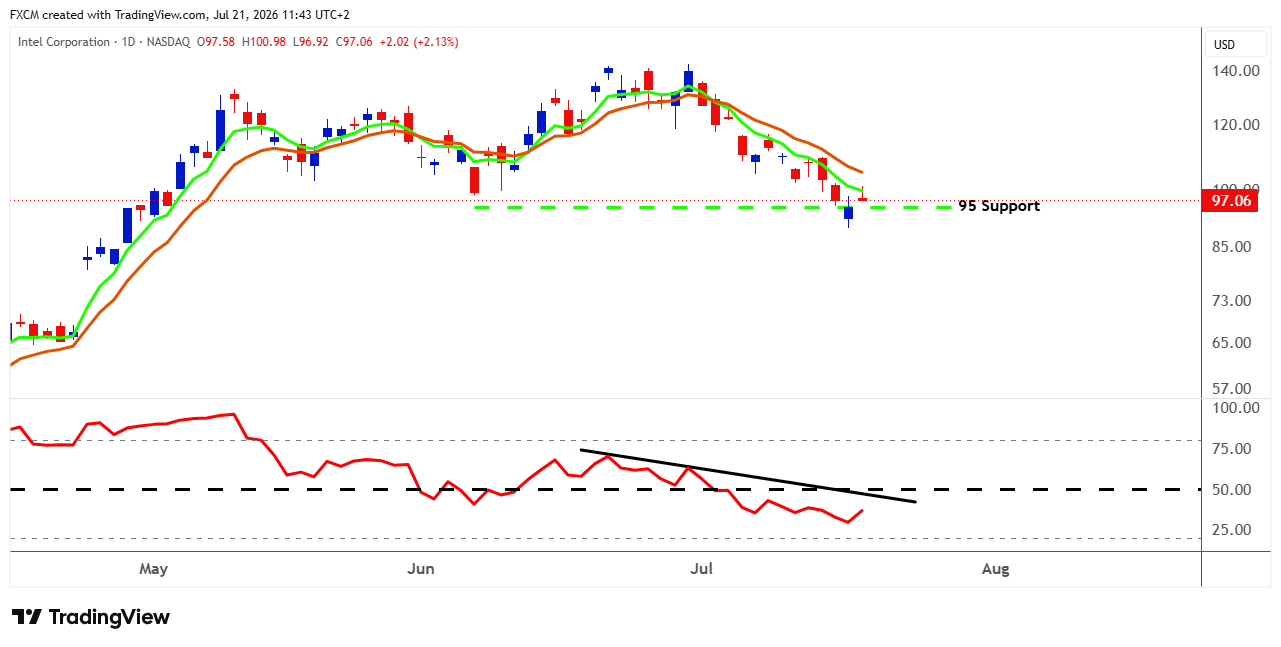
Technical Analysis
Technically, Intel remains under pressure after a steep decline, with price now testing the important $95 support zone. That level is a key support and a decisive break would weaken the structure further and expose the stock to another leg lower. Momentum is not yet helping, as RSI remains below 50 and trapped beneath its falling trendline; it needs to break higher and hold above 50 before buyers can claim genuine momentum support. The short-term EMAs are also bearishly aligned and sloping lower, so the chart will only become more constructive if price holds $95, RSI improves and the averages begin to flatten and converge.
Caveat
If RSI remains below 50, weak momentum will leave support vulnerable and keep the share price under pressure.
Fundamental Perspective
When Intel reports after the close on Thursday, investors will look beyond the roughly $14.4 billion revenue expected by analysts and ask whether its turnaround is producing sustainable commercial results. Data Centre and AI will be central after strong Xeon demand drove DCAI revenue up 22% last quarter, while management expects further double-digit sequential growth in Q2; investors will also want reassurance that anticipated second-half weakness in the PC market can be contained.
The harder test is manufacturing. Intel must show that improving 18A yields are reducing the costs of the early production ramp, that Foundry's $2.4 billion quarterly operating loss is moving in the right direction, and that customer evaluations are beginning to develop into credible external commitments.
Gross margin and forward guidance may therefore matter more than a modest earnings beat. After a powerful share-price rally, Intel must demonstrate that stronger products, AI-driven CPU demand and vast factory investment are translating into better economics, not merely a better story.
Hot News, Cold Logic
Goldman Sachs warned that UKOil could exceed $120 a barrel next quarter if disruptions to the Strait of Hormuz persist, although its base case still assumes prices average $80 later this year as tensions ease. With Gulf oil flows reportedly below 45% of pre-war levels, Goldman believes further shipping disruptions or damage to energy infrastructure could push prices significantly higher, although weaker Chinese demand continues to temper the longer-term outlook.
Final Thought
Markets are confronting the less comfortable reality that oil and geopolitics can temporarily overshadow the AI narrative, while the sharp semiconductor correction shows how unforgiving elevated expectations have become. The broader equity advance remains intact, but further gains are likely to require contained energy prices, more stable yields and earnings that provide credible evidence that extraordinary AI investment is producing durable commercial returns.

Russell Shor
Senior Market Strategist
Russell Shor is a Senior Market Strategist at FXCM, having been promoted to the role in 2025 in recognition of his depth of insight and consistent delivery of high-impact market analysis. He originally joined FXCM in October 2017 as a Senior Market Specialist.
Russell holds an Honours Degree in Economics from the University of South Africa, is a certified FMVA®, and a full member of the Society of Technical Analysts (UK). With over 20 years of experience in financial markets, his work is renowned for its clarity, precision, and strategic value across asset classes.

Any opinions, news, research, analyses, prices, other information, or links to third-party sites contained on this website are provided on an "as-is" basis, as general market commentary and do not constitute investment advice. The market commentary has not been prepared in accordance with legal requirements designed to promote the independence of investment research, and it is therefore not subject to any prohibition on dealing ahead of dissemination. Although this commentary is not produced by an independent source, FXCM takes all sufficient steps to eliminate or prevent any conflicts of interests arising out of the production and dissemination of this communication. The employees of FXCM commit to acting in the clients' best interests and represent their views without misleading, deceiving, or otherwise impairing the clients' ability to make informed investment decisions. For more information about the FXCM's internal organizational and administrative arrangements for the prevention of conflicts, please refer to the Firms' Managing Conflicts Policy. Please ensure that you read and understand our Full Disclaimer and Liability provision concerning the foregoing Information, which can be accessed here.