U.S. Dollar Surges to Two-and-a-Half-Month High Amid Strong Economic Data

The dollar reached a two-and-a-half-month high last week, driven primarily by stronger-than-expected U.S. economic data. This suggests that the Federal Reserve is likely to implement only an additional 50 basis points in rate cuts this year—25 basis points in November and another 25 basis points in December. The Dollar Index benefited from robust reports on retail sales and jobless claims.
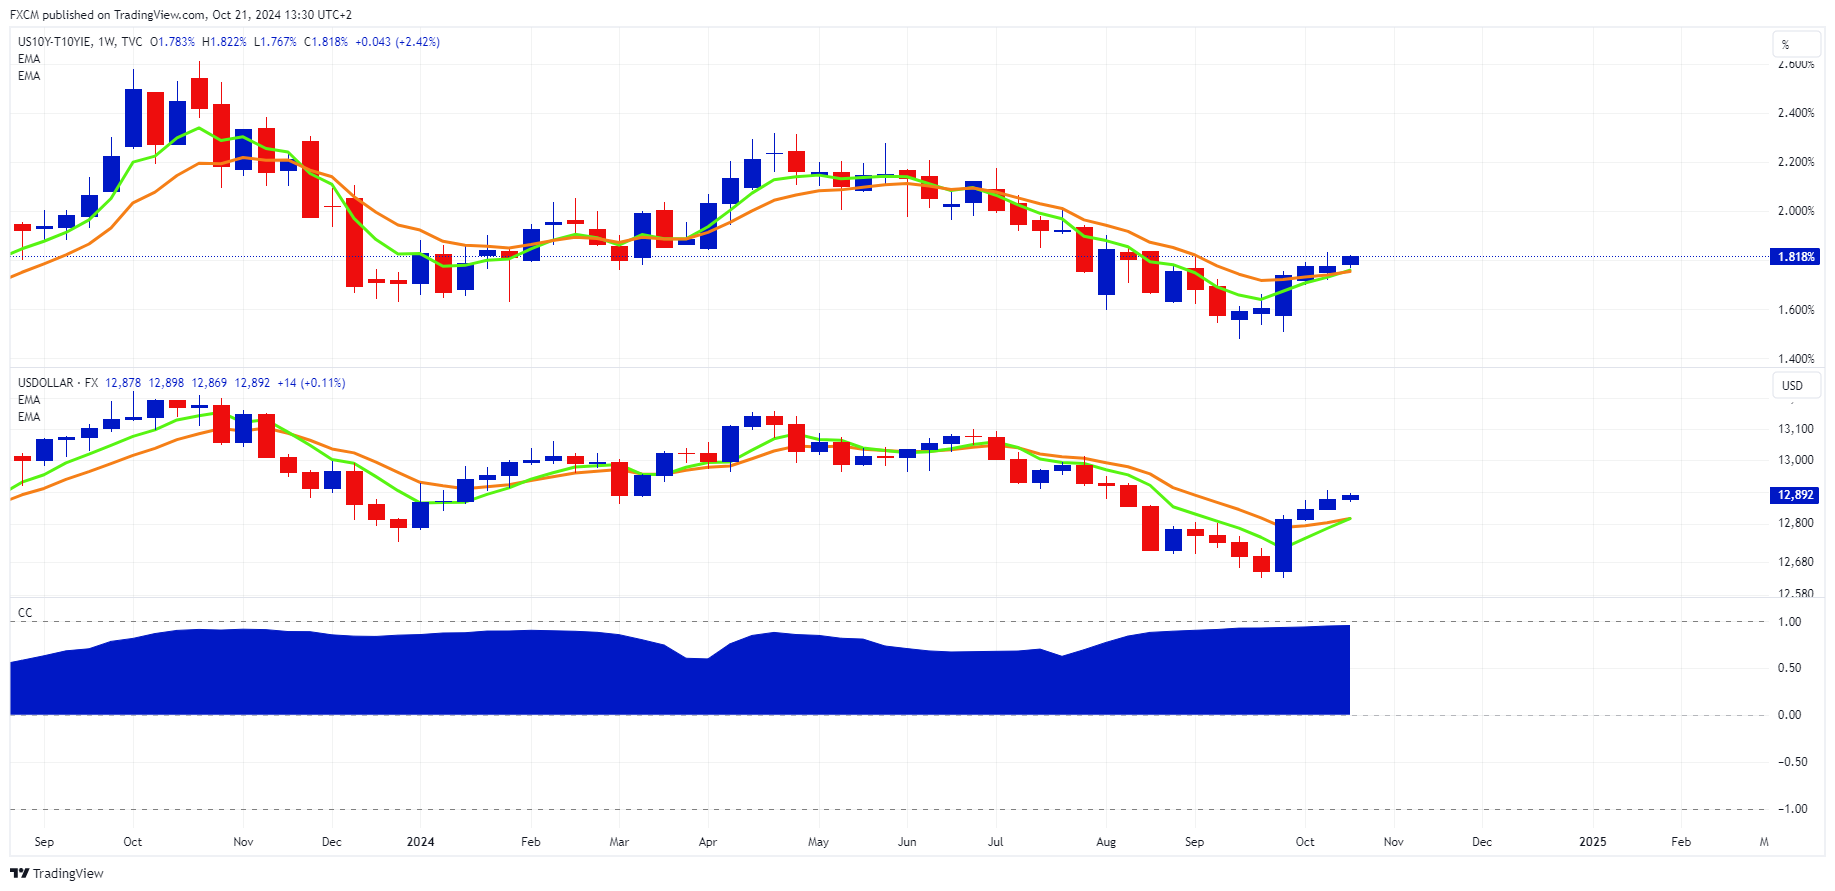
Additionally, the real rate (shown in the top chart) has been climbing since its mid-September low, with the dollar (depicted in the middle chart) following suit. The current correlation coefficient (illustrated in the bottom chart) between these two metrics stands at a strong 95%. As long as the economic data continues to support the real yield, this trend bodes well for the greenback.
Source: www.tradingview.com
Russell Shor
Senior Market Strategist
Russell Shor is a Senior Market Strategist at FXCM, having been promoted to the role in 2025 in recognition of his depth of insight and consistent delivery of high-impact market analysis. He originally joined FXCM in October 2017 as a Senior Market Specialist.
Russell holds an Honours Degree in Economics from the University of South Africa, is a certified FMVA®, and a full member of the Society of Technical Analysts (UK). With over 20 years of experience in financial markets, his work is renowned for its clarity, precision, and strategic value across asset classes.
These materials constitute marketing communication and do not take into consideration your personal circumstances, investment experience or current financial situation. The content is provided as general market commentary and should not be construed as containing any type of investment advice, investment recommendation and/or a solicitation for any investment transactions. This market communication does not imply or impose an obligation on you to perform an investment transaction and/or purchase investment products or services. These materials have not been prepared in accordance with legal requirements designed to promote the independence of investment research and are not subject to any prohibition on dealing ahead of the dissemination of investment research.
FXCM, and any of its Affiliates, shall not in any way be liable to you for any inaccuracies, errors or omissions, regardless of cause, in the content of these materials, or for any damages (whether direct or indirect) which may arise from the use of such materials, services and their content. Consequently, any person acting on them does so entirely at their own risk. Please ensure that you read and understand our Full Disclaimer and Liability provision concerning the foregoing Information, which can be accessed here.