
Market Threads – USDOLLAR Charts Bullish Flag as Oil-Driven Inflation Risk Lifts Yields

.png)
Tracking important market threads across currencies, commodities, and indices.
- Oil surges on Middle East supply-risk fears, with UKOil and USOil confirming bullish breakouts.
- USDOLLAR charts bullish flag as rising yields and oil-driven inflation risk boost safe-haven demand.
- XAUUSD tests key trendline resistance near $4,150-$4,200 with momentum turning bullish.
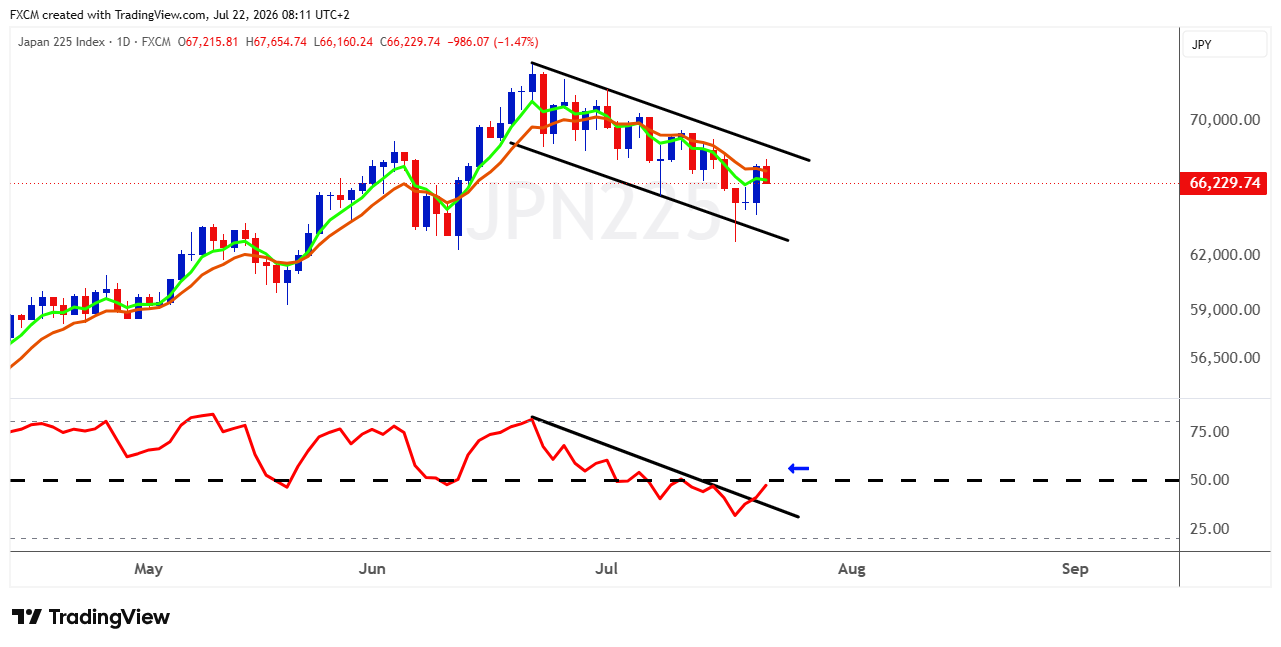
- JPN225 consolidates in a bullish flag as strong exports and semiconductor optimism build the case for a breakout.
Cross Asset View
Markets are balancing renewed energy-driven inflation concerns against a tentative recovery in AI and semiconductor sentiment. Oil's technical breakout reflects mounting risks to Middle Eastern supply and shipping, while higher Treasury yields, inflation concerns and defensive demand are supporting the USDOLLAR; XAUUSD is nevertheless attempting to recover despite those yield and currency headwinds. JPN225 sits between these forces, with stronger semiconductor sentiment and robust Japanese exports supporting a bullish flag, but expensive energy and extreme yen weakness creating an important counterweight. The next cross-asset move is therefore likely to be shaped by whether Middle East disruption intensifies or forthcoming technology earnings strengthen confidence that the recent equity rebound can become more durable.
Oil
Technical Analysis
UKOil
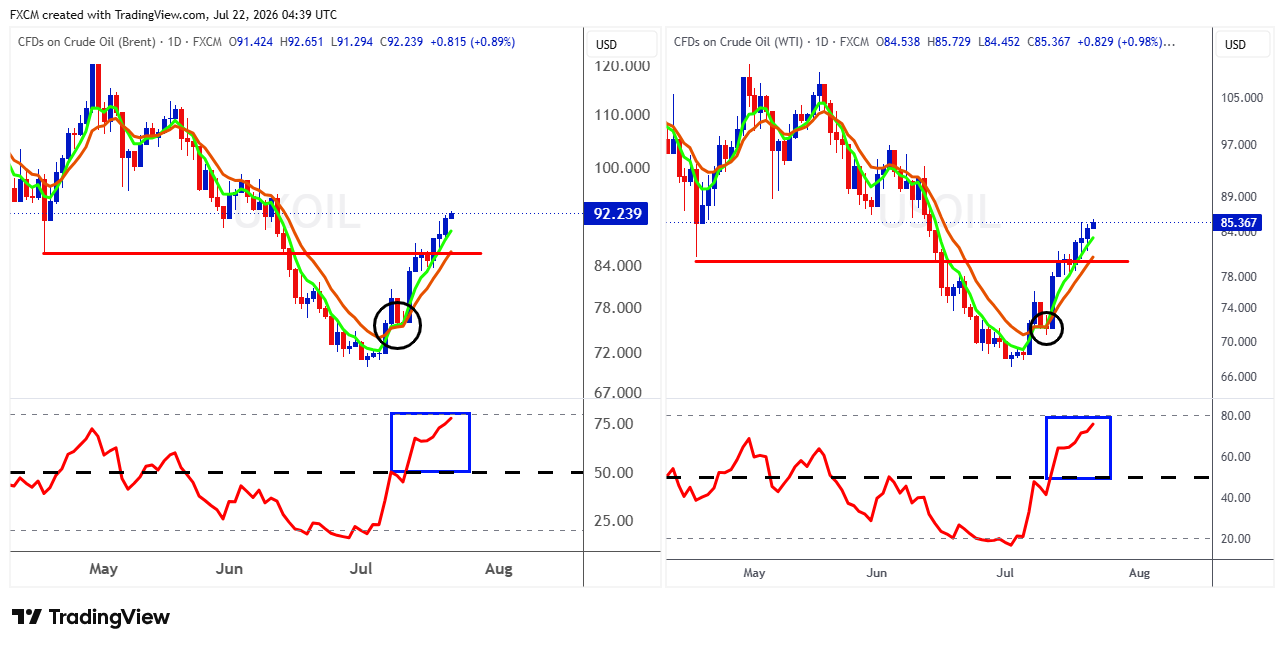
UKOil has completed a technically impressive reversal from its late-June low near $70. The circled area marks the point where the short-term moving average turned higher and crossed above the slower average, signalling that the recovery was becoming more than a temporary bounce. Price has since broken decisively through the former support-turned-resistance zone around $86 and is holding above both rising averages, leaving the short-term trend firmly bullish. Momentum confirms the move: the RSI has surged from deeply oversold territory to almost 80, showing powerful buying pressure but also warning that UKOil is becoming stretched in the near-term. A pause or pullback towards the breakout area would therefore be healthy rather than bearish; provided $86 holds as support, the chart leaves the door open to the mid-$90s and potentially the psychologically important $100 region.
USOil
USOil tells an equally bullish story, with an almost textbook progression from capitulation to recovery and then breakout. After bottoming below $70, price formed a rounded base, produced a bullish moving-average crossover near $72 and accelerated through the important $80 resistance level. The advance to roughly $85.37 represents clear follow-through rather than a marginal breakout, while both moving averages are now rising beneath the market. The RSI has moved into the mid-to-high 70s, confirming strong momentum but suggesting that fresh buyers are increasingly chasing the move. The first meaningful test now lies around $88-89, where the June decline previously gathered pace. A retracement that holds above $80 would reinforce the breakout; a close back beneath that zone would raise the risk that this has been an exhaustion move rather than the beginning of a more durable uptrend.
Fundamental Perspective
Oil is increasingly being priced around the risk that disruption spreads across more than one critical export corridor. With security deteriorating around Hormuz and fresh uncertainty surrounding Red Sea shipments, the routes that have allowed Gulf producers to keep barrels moving are becoming less dependable. Recent tanker diversions, further attacks on shipping and the continuation of US military operations have therefore strengthened both the supply-risk and freight-cost components of the rally.
Even so, this is not yet an unambiguous global shortage as some Gulf crude continues to reach the market, alternative export systems remain operational and emergency reserves have provided an additional buffer. The central issue is whether current shipping difficulties develop into a prolonged reduction in export volumes. A deeper physical disruption could keep oil elevated despite stretched momentum, whereas credible diplomacy and safer transit conditions could remove part of the premium quickly.
USDOLLAR
Technical Analysis
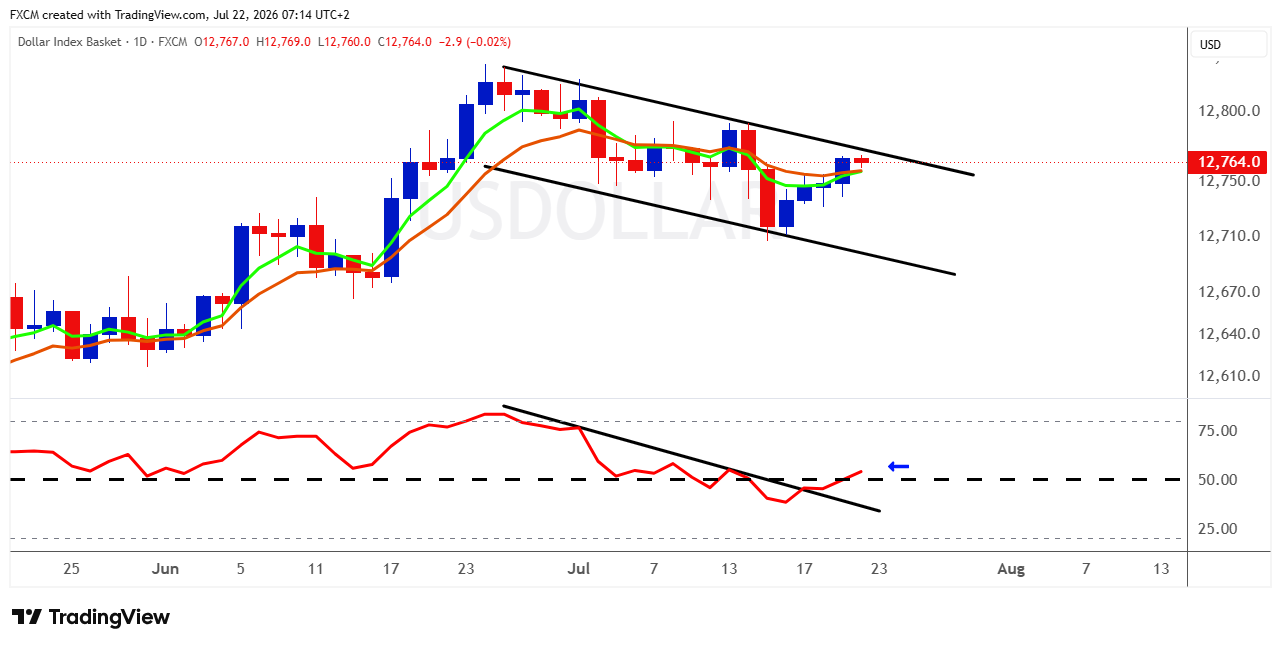
USDOLLAR appears to be forming a bullish flag after its strong June advance, with the recent decline contained inside a relatively orderly downward-sloping channel rather than developing into a broader reversal. Price is now pressing against the flag's upper boundary near 12,760-12,770, while the faster EMA has turned higher and is converging on the slower EMA; a bullish crossover accompanied by a decisive daily close above the channel would provide stronger confirmation that the consolidation has ended.
Momentum is already beginning to lead price as the RSI has broken above its own descending trend line and recovered through 50, signalling that buying pressure is returning before the price breakout has been fully confirmed. The longer RSI holds above 50, the more credible the bullish setup becomes, particularly if it starts making higher highs.
A confirmed breakout would initially bring the June peak around 12,810–12,830 back into focus, with scope for further appreciation if that resistance gives way. Conversely, rejection at the channel ceiling followed by a move back below the EMAs would weaken the pattern, while a break beneath the recent low near 12,710 would call the bullish interpretation into question.
Fundamental Perspective
The prospective bullish breakout in USDOLLAR has some fundamental support from higher US Treasury yields and renewed defensive demand for the dollar, although the monetary-policy backdrop remains finely balanced.
Disruption around Hormuz and growing threats to Red Sea shipping have lifted oil prices, revived inflation concerns and helped drive the 10-year Treasury yield to a two-month high, while the wider dollar is trading near a one-week high and the yen has fallen to its weakest level since 1986.
The Federal Reserve is widely expected to keep rates unchanged on 29 July, but the perceived risk of another increase has risen as expensive energy threatens to interrupt disinflation. That provides a plausible catalyst for a technical breakout, although softer-than-expected June consumer and producer inflation remains an important counterweight and any easing in geopolitical tensions, oil prices or yields could weaken the dollar's support.
USDJPY Intervention Risk Rises Above 163
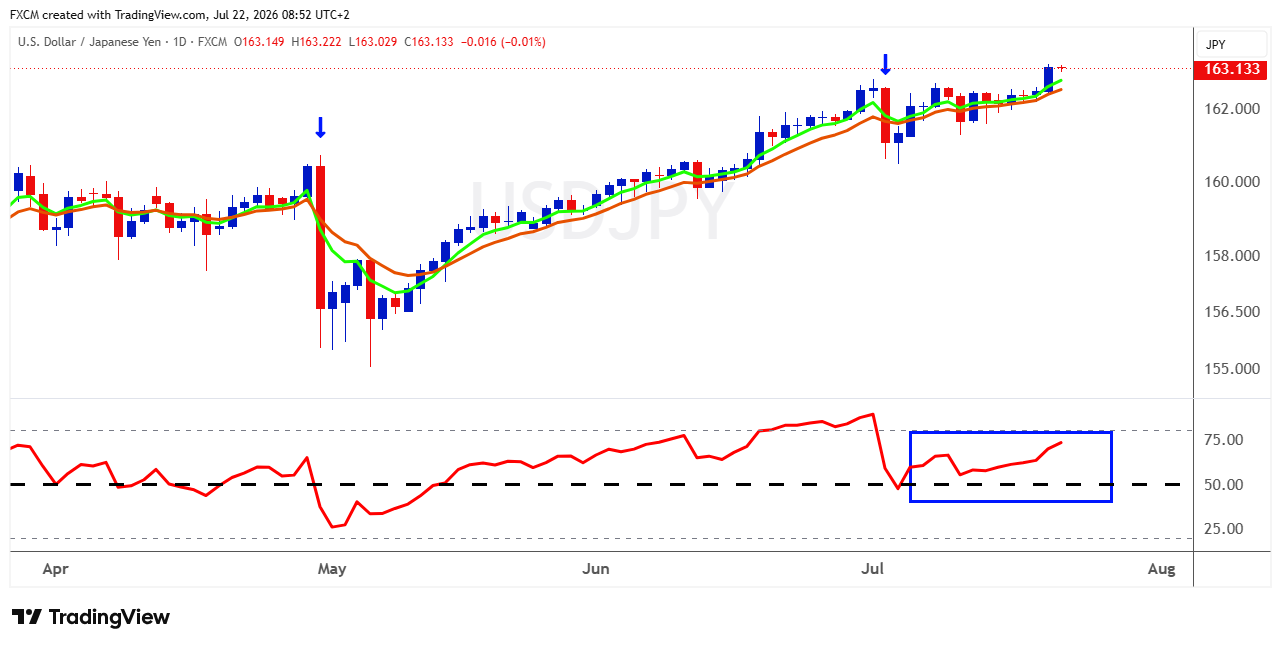
USDJPY remains firmly bullish near 163.13, with price above rising EMAs and the RSI comfortably above 50, confirming that depreciation pressure on the yen remains strong. However, the pair has entered a high-intervention-risk area after touching 163.24 yesterday, its weakest level since late 1986; Japan previously spent a record ¥11.7349 trillion supporting the yen after USDJPY crossed 160 in April and May. Japanese officials have again said they are prepared to take decisive action if necessary, although analysts believe the speed and disorderliness of any further rise may matter more than a fixed exchange-rate level. Intervention could trigger an abrupt drop similar to the confirmed April-May reversal, but its lasting effect may remain limited while elevated US yields, expensive oil and the wide US-Japan interest-rate gap continue to support the dollar. Without a meaningful shift in those fundamentals, an intervention-driven yen rally would be more likely to begin as a sharp correction than a durable trend reversal.
Gold
Technical Analysis
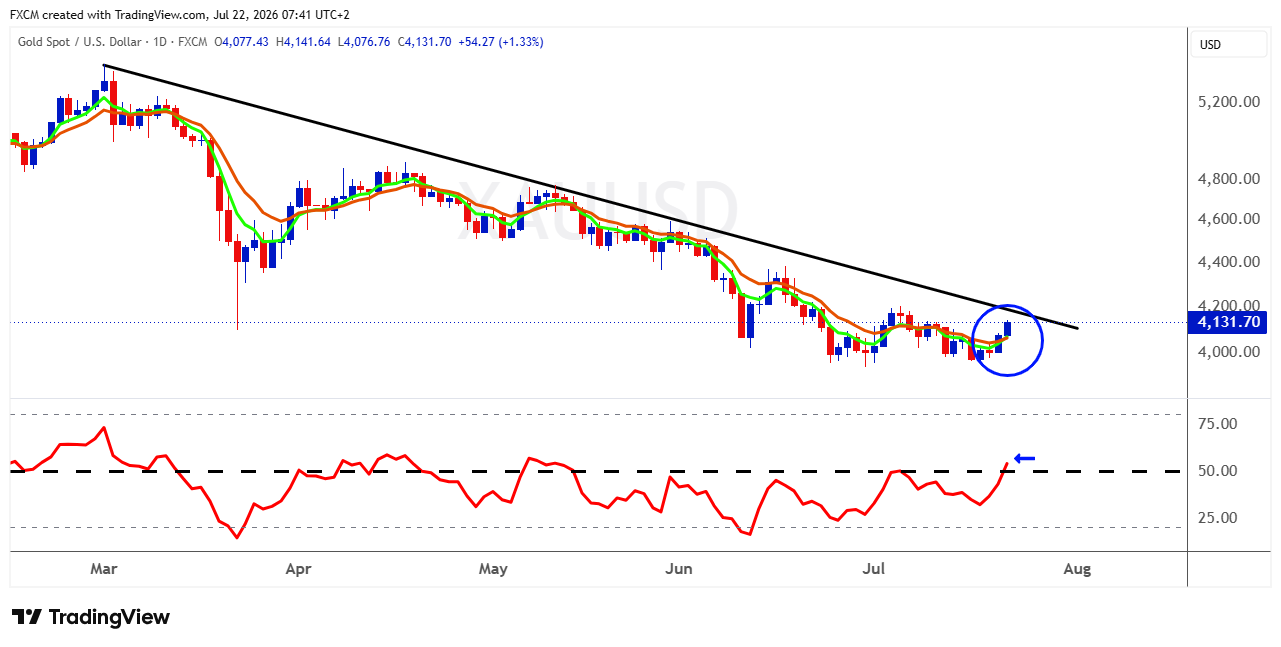
XAUUSD's prolonged decline may be losing steam. The fast EMA has turned sharply higher and is closing in on a bullish cross above the slower EMA, while the RSI has broken above 50 for the first time in weeks, a sign momentum may be shifting back to buyers.
Price is now approaching the descending trend line that has capped every meaningful rally since March, making the $4,150-$4,200 region the decisive test. A sustained daily close above that barrier, particularly alongside a confirmed EMA crossover and RSI holding above 50, would materially improve the structure and open the way towards the previous resistance area around $4,300-$4,400.
Until that breakout occurs, however, the broader trend remains bearish and the current move should still be treated as a recovery within a downtrend. Rejection from the trend line would return attention to support around $4,050 and the psychologically important $4,000 level.
Fundamental Perspective
Gold's rebound has a credible but conflicted fundamental foundation. Escalating US-Iran hostilities and threats to shipping through Hormuz and the Red Sea may be keeping defensive interest in bullion alive, while technical and value buying has helped spot gold rise to a two-week high. Yet the same conflict is lifting oil prices, inflation concerns, the USDOLLAR and Treasury yields, with the ten-year yield near 4.63%, increasing the opportunity cost of holding non-yielding gold.
The Fed's 28-29 July meeting also looms large with economists unanimously expecting no change, but expensive energy has raised the odds of a later hike as it threatens to stall disinflation, though June's 0.4% monthly CPI decline and flat core index offer an important counterweight.
Structural support remains intact, with central banks adding a net 41 tonnes in May and 89% of surveyed reserve managers expecting global holdings to grow over the next year. Still, a sustained technical breakout would carry more weight if geopolitical demand holds up without a further sharp rise in US yields or the dollar.
Index in Focus: JPN225
Technical Analysis
JPN225 remains trapped inside its bullish flag following its powerful April-to-June advance, so the broader bullish continuation case is still alive but not yet confirmed. Last week's RSI trend line had to be redrawn after momentum failed to follow through, but the indicator has now broken above the revised resistance line, an encouraging early signal that selling pressure may be fading. The more important test is whether RSI can reclaim 50 and remain there, which would indicate that momentum has shifted decisively back towards buyers. Price must then clear the EMA cluster and produce a sustained daily close above the flag's upper boundary, currently around 68,000-69,000, before a retest of the June high above 72,000 becomes credible. Until that happens, the index is still consolidating rather than breaking out where a rejection near the upper boundary would leave support around 64,000 exposed, while a decisive break beneath the channel would invalidate the bullish flag and suggest that the correction has further to run.
Fundamental Perspective
Japan's exports rose 19.3% year on year in June, the tenth consecutive increase and ahead of expectations, as AI-related demand and the weak yen supported overseas sales, providing a favourable backdrop for internationally exposed technology and industrial companies. Japanese manufacturers also remained net optimistic in July, with the Reuters Tankan index holding at +13 as semiconductor, memory-chip and AI-server suppliers reported strong demand.
A rebound in global semiconductor shares is beginning to improve risk appetite, while bargain-hunting helped the Nikkei recover 3.26% from its recent technology-led decline. The BOJ is also expected to retain its 1% policy rate when its meeting concludes on 31 July, reducing, although not eliminating, the risk of an immediate tightening shock.
Fundamentally, resilient exports, continued AI investment and a sustained recovery in semiconductor sentiment could provide the catalyst for the flag to resolve higher, particularly if forthcoming technology earnings support the view that the recent sell-off was a correction rather than the beginning of a deeper deterioration.

Russell Shor
Senior Market Strategist
Russell Shor is a Senior Market Strategist at FXCM, having been promoted to the role in 2025 in recognition of his depth of insight and consistent delivery of high-impact market analysis. He originally joined FXCM in October 2017 as a Senior Market Specialist.
Russell holds an Honours Degree in Economics from the University of South Africa, is a certified FMVA®, and a full member of the Society of Technical Analysts (UK). With over 20 years of experience in financial markets, his work is renowned for its clarity, precision, and strategic value across asset classes.


Any opinions, news, research, analyses, prices, other information, or links to third-party sites contained on this website are provided on an "as-is" basis, as general market commentary and do not constitute investment advice. The market commentary has not been prepared in accordance with legal requirements designed to promote the independence of investment research, and it is therefore not subject to any prohibition on dealing ahead of dissemination. Although this commentary is not produced by an independent source, FXCM takes all sufficient steps to eliminate or prevent any conflicts of interests arising out of the production and dissemination of this communication. The employees of FXCM commit to acting in the clients' best interests and represent their views without misleading, deceiving, or otherwise impairing the clients' ability to make informed investment decisions. For more information about the FXCM's internal organizational and administrative arrangements for the prevention of conflicts, please refer to the Firms' Managing Conflicts Policy. Please ensure that you read and understand our Full Disclaimer and Liability provision concerning the foregoing Information, which can be accessed here.