
Market Threads – Oil Strengthens as the Dollar Weakens and Gold and SPX500 Test Key Levels

.png)
Tracking important market threads across currencies, commodities, and indices.
- UKOil and USOil are closing in on key breakout levels as bullish momentum builds and Middle East supply risks keep crude firmly in focus.
- USDOLLAR stays under pressure as bearish momentum builds, with Friday's US CPI setting the stage for the next big move.
- XAUUSD is approaching a key inflection point, with a potential higher trough forming ahead of Friday's US CPI catalyst.
- SPX500 is testing a key inflection point around 7,700, with fading momentum and Friday's US CPI poised to drive the next major move.
Cross-Asset View
Cross-asset signals are becoming increasingly intertwined, with oil pushing towards important resistance, the dollar under pressure, gold attempting to stabilise and SPX500 hesitating near a key pivot. The common thread is a market caught between resilient growth and rising macro risks, as higher energy prices, elevated Treasury yields, shifting central-bank expectations and Friday's US CPI all compete to shape the next move. With several major markets now sitting close to technical inflection points, the coming sessions could determine whether current trends extend or begin to reverse.
Oil
Technical Analysis
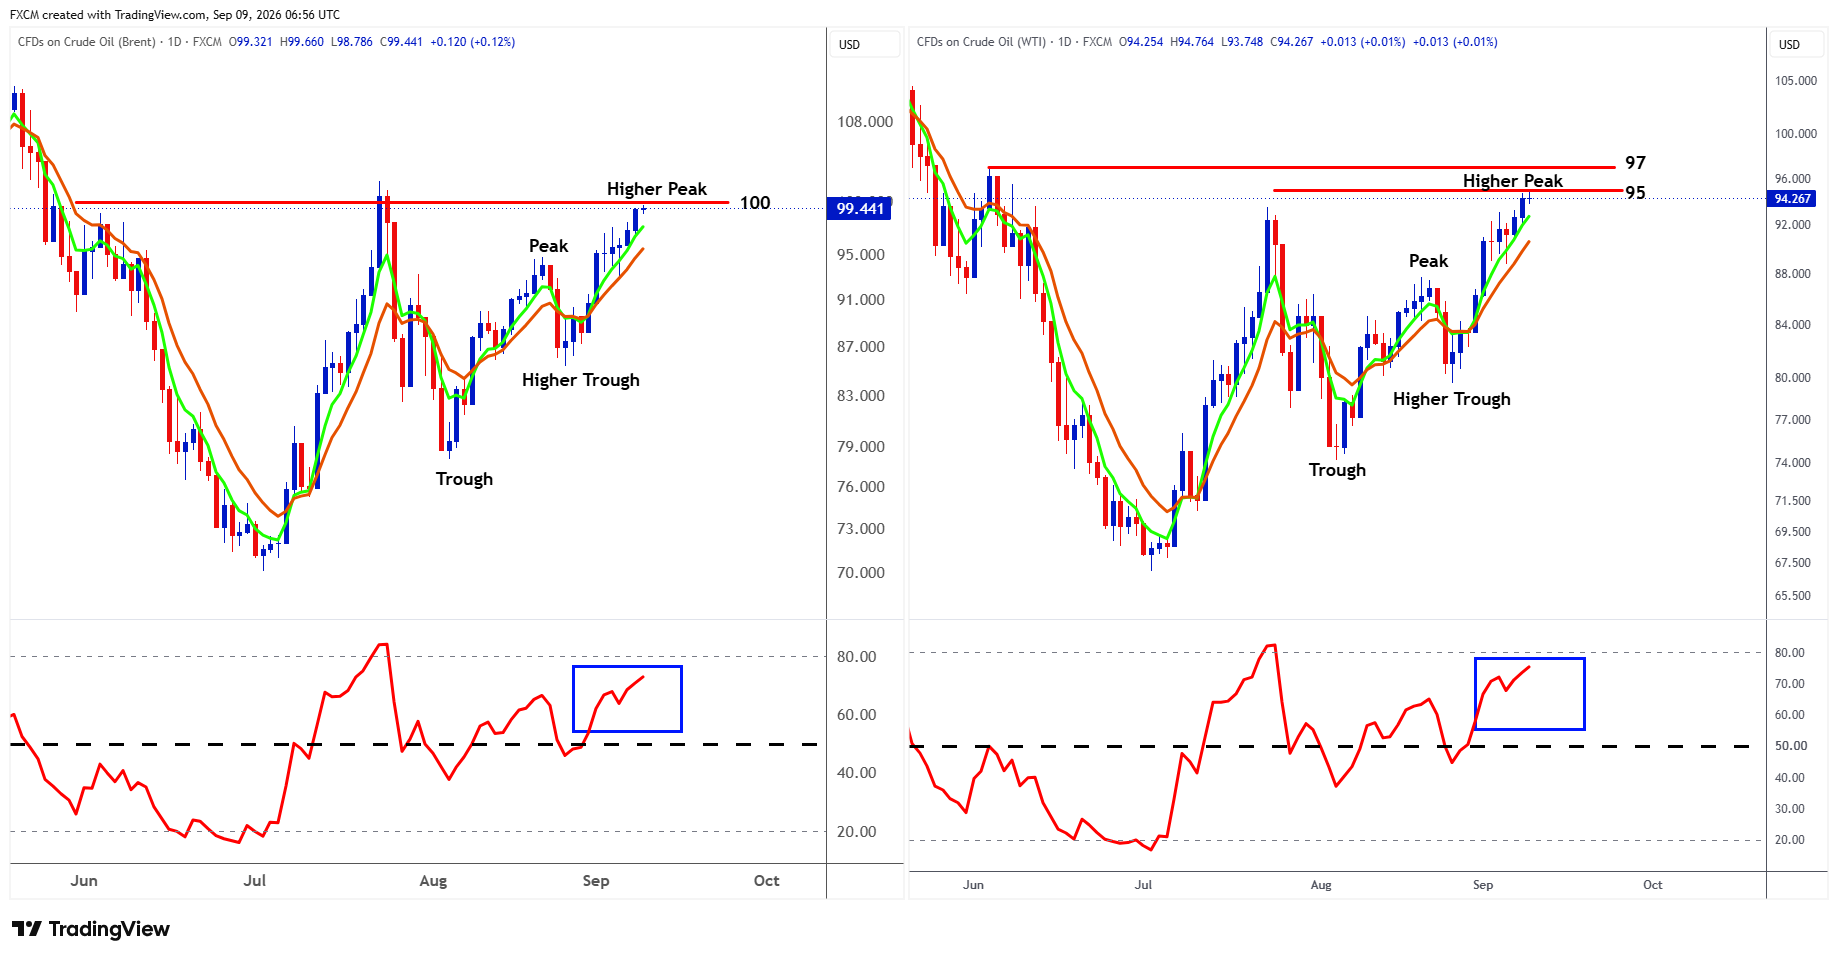
UKOil's technical picture has strengthened materially, with the recovery from the July low developing into a clear sequence of higher troughs and higher peaks. Price is trading above both rising moving averages, with the faster average above the slower one, reinforcing the improving short-term trend. Momentum is also supportive: the RSI has recovered comfortably above 50 and is pushing towards 70, signalling solid buying pressure without yet becoming decisively overbought. The immediate test is the psychologically important $100 area, which also marks the previous July peak and therefore represents meaningful resistance. A sustained daily close above $100 would confirm a more significant breakout and strengthen the case for another leg higher, while failure to clear it could invite some near-term consolidation. For now, however, the combination of improving price structure, rising averages and strengthening momentum keeps the technical bias constructively bullish.
USOil is displaying a similarly constructive setup, having established a succession of higher troughs and higher peaks since its July low while remaining firmly above its rising moving averages. The faster average has moved above the slower one and both are moving higher, suggesting that the underlying trend is gaining traction rather than simply reflecting a short-lived rebound. RSI has climbed into the upper-60s after repeatedly holding around the 50 area, showing increasingly persistent buying momentum, although the market is now approaching an important technical hurdle. $95 is the first key resistance level, with the more significant $97 area sitting just above it. A convincing break through $95 would put $97 firmly in focus and potentially complete the next stage of the recovery, while rejection around current levels could produce a pause or pullback. Until the higher-trough structure is broken, the broader technical picture remains bullish, but increasingly dependent on a successful resistance breakout.
Fundamental Perspective
The fundamental backdrop broadly supports the constructive technical picture in UKOil and USOil, with the latest advance reflecting a renewed increase in supply risk rather than momentum alone. Middle East tensions have intensified again, with Iranian retaliation against US targets, Houthi attacks on Saudi energy facilities and renewed threats to Gulf shipping and energy infrastructure. At the same time, traffic through the Strait of Hormuz remains constrained and unusually difficult to measure as "dark" tanker movements obscure the true volume of crude passing through a waterway that normally carries roughly a fifth of global oil supply.
Seven OPEC+ producers have also agreed to maintain September production requirements through October, removing another near-term source of incremental supply at a time when physical crude markets remain tight. There are important offsets: Gulf producers are making greater use of alternative export routes, non-OPEC supply continues to grow and Chinese oil demand has weakened sharply.
Nevertheless, near-term supply risks remain skewed to the upside for prices, making UKOil's test of $100 especially significant. A further deterioration in Gulf security could provide the fundamental catalyst for a technical breakout, while credible de-escalation around Hormuz would represent one of the clearest downside risks to the current bullish setup.
USDOLLAR
Technical Analysis
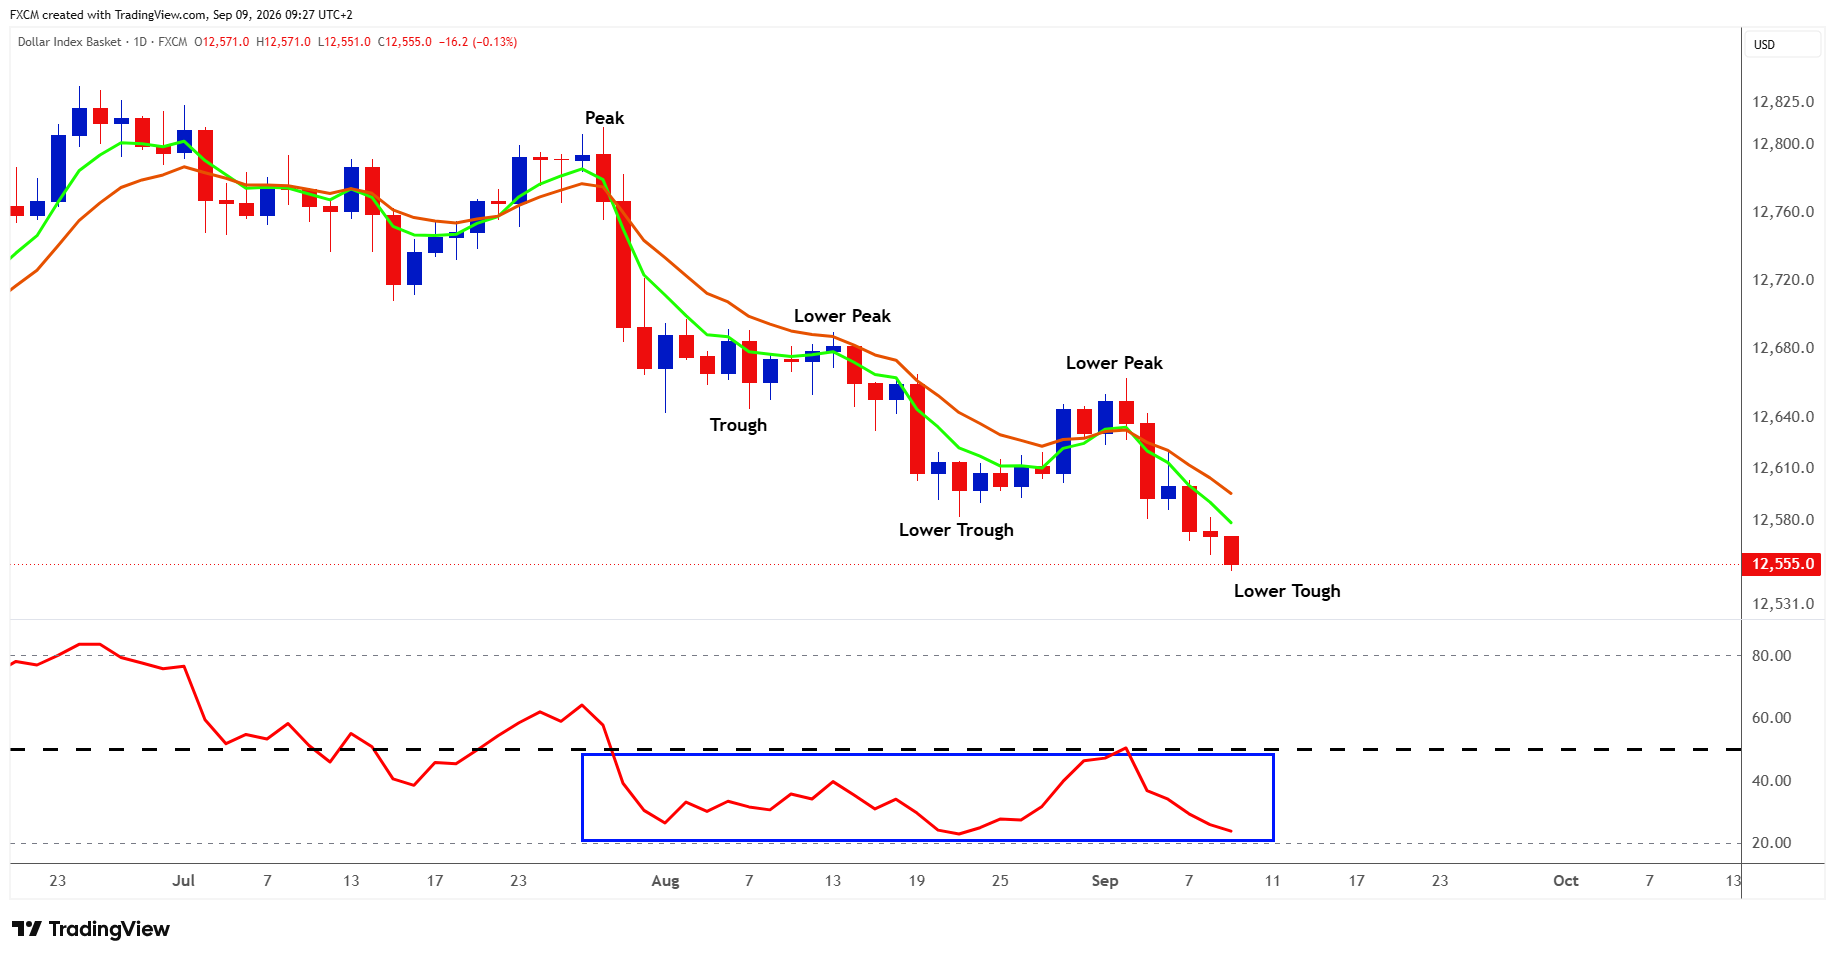
USDOLLAR remains technically weak, with the chart showing a well-established sequence of lower peaks and lower troughs since late July. Price is trading beneath both declining moving averages, while the faster average remains below the slower one, confirming that downside momentum is still dominant. The latest move has pushed USDOLLAR towards the 12,550 area, extending the bearish structure and leaving the index vulnerable to further pressure if this level fails to hold. Momentum indicators reinforce that view, with the RSI falling into the low-20s and approaching oversold territory after repeatedly failing to sustain moves above 50. That does raise the risk of a short-term rebound, but for now any recovery would look corrective unless USDOLLAR can reclaim the 12,580–12,610 area and begin breaking the pattern of lower highs. Until then, the technical bias remains firmly bearish, albeit increasingly stretched in the near term.
Fundamental Perspective
The fundamental backdrop broadly supports the bearish technical picture in USDOLLAR, although the downside case is not one-way. The dollar is trading close to a two-week low as expectations of tighter monetary policy elsewhere begin to limit the policy divergence that has supported the US currency, particularly against the yen. Traders widely expect the Bank of Japan to raise rates by 25 basis points next week, while the European Central Bank is also expected to deliver a quarter-point increase on Thursday.
The resulting shift in relative policy expectations, together with an unwinding of yen-funded carry trades and the prospect of Japanese capital repatriation, has helped push the yen towards a seven-month high and kept the dollar under pressure. There are important counterweights: August US payrolls rose a much stronger-than-expected 162,000, markets markets currently lean towards a 25-basis-point Fed hike, although the outcome remains far from certain, and rising oil prices are keeping inflation concerns firmly in focus.
That puts Friday's US CPI report firmly centre stage. A softer reading could strengthen the case for the Fed to remain on hold and extend pressure on USDOLLAR, whereas a hotter print would reinforce the case for another rate hike and could provide the catalyst for the corrective rebound already suggested by oversold technical momentum.
Forex Focus: EURUSD
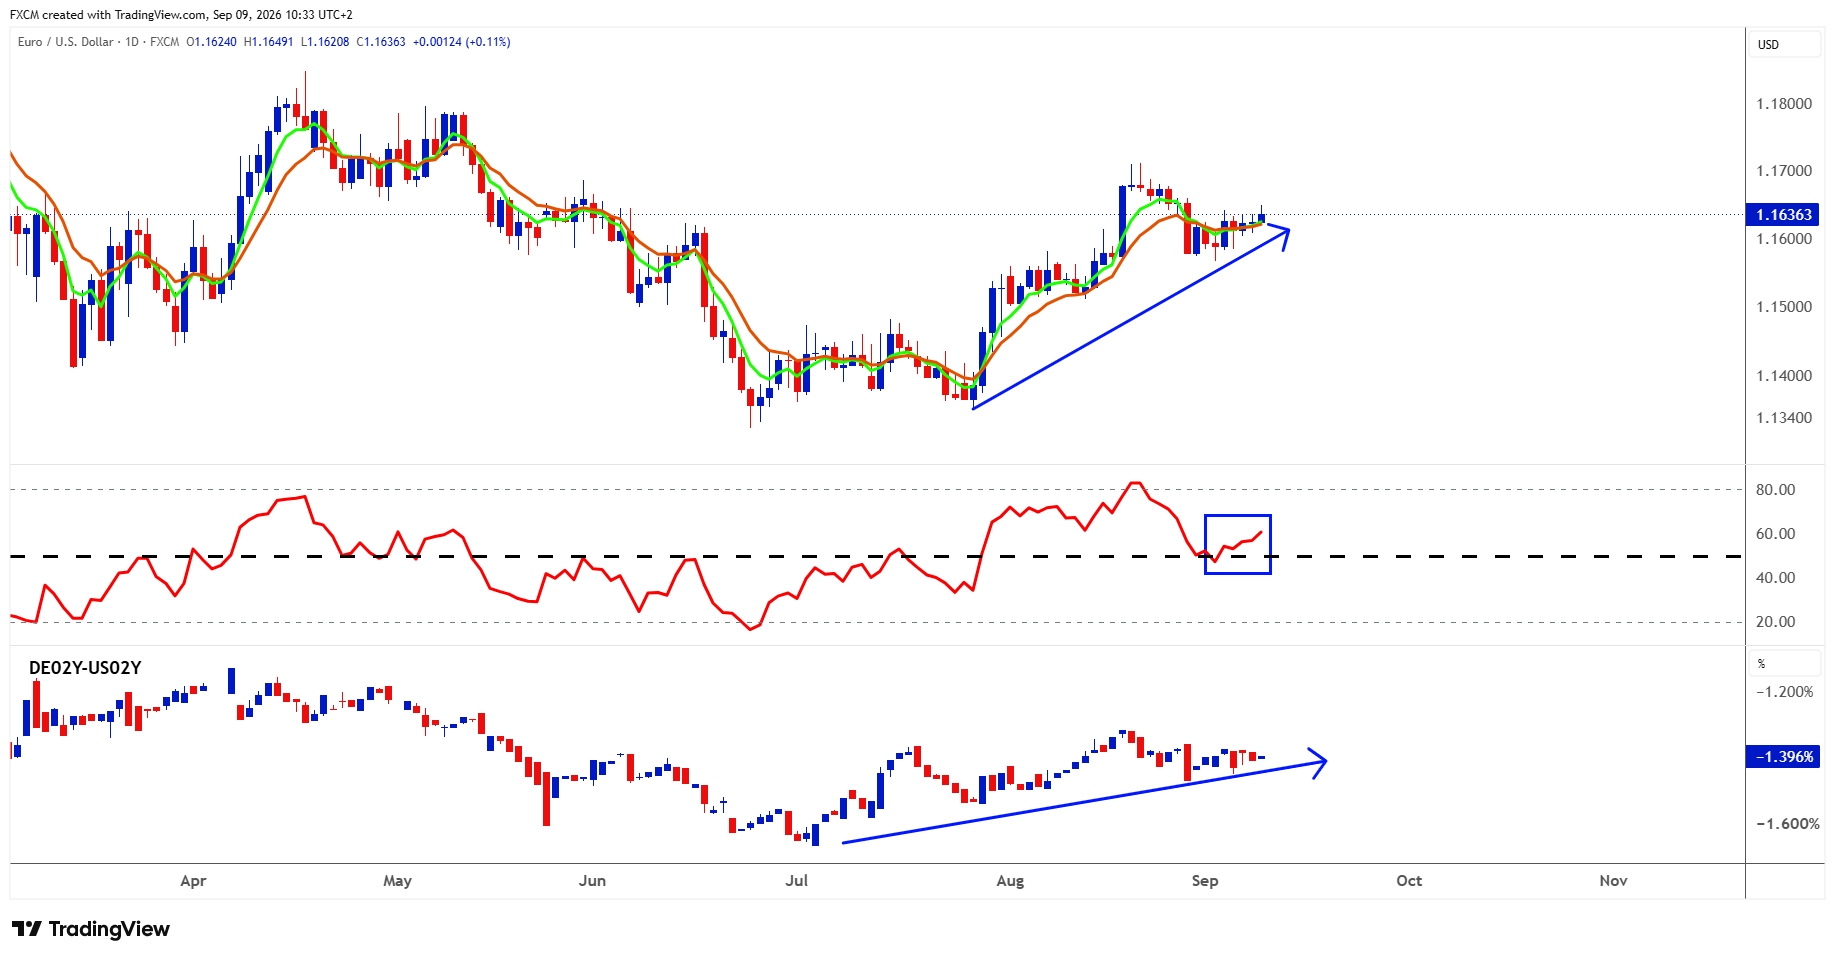
EURUSD retains a constructive bias, with price holding above the rising trendline from the July low while the faster EMA remains above the slower average, suggesting the broader recovery structure is still intact. Momentum is also improving, with the RSI turning higher above 50, an encouraging development following the recent pullback.
Importantly, the German 2-year versus US 2-year yield spread continues to move in the euro's favour, becoming less negative and narrowing Germany's short-term yield disadvantage. That fits a macro backdrop in which the ECB is widely expected to raise its deposit rate by 25 basis points to 2.50% on Thursday, after euro-area inflation accelerated to 3.3% in August, while next week's Fed decision remains considerably less certain.
The dollar is also trading close to a two-week low, although strong US payrolls and the realistic prospect of another Fed hike mean the bearish-dollar case is far from settled. That puts Friday's US CPI firmly centre stage: softer inflation could reinforce the improving relative-rate backdrop and support further EURUSD gains, while a hot print could revive US yields and dollar demand.
The principal counterweight is the renewed energy shock, with UKOil pushing above $100 a barrel. Higher energy costs are strengthening the ECB's near-term inflation concerns, but a prolonged shock could also weaken euro-area growth and ultimately limit how far the central bank can tighten. For now, rising technical support, improving RSI momentum and a relative-rate spread moving in the euro's favour leave EURUSD with a cautiously bullish complexion.
Gold
Technical Analysis
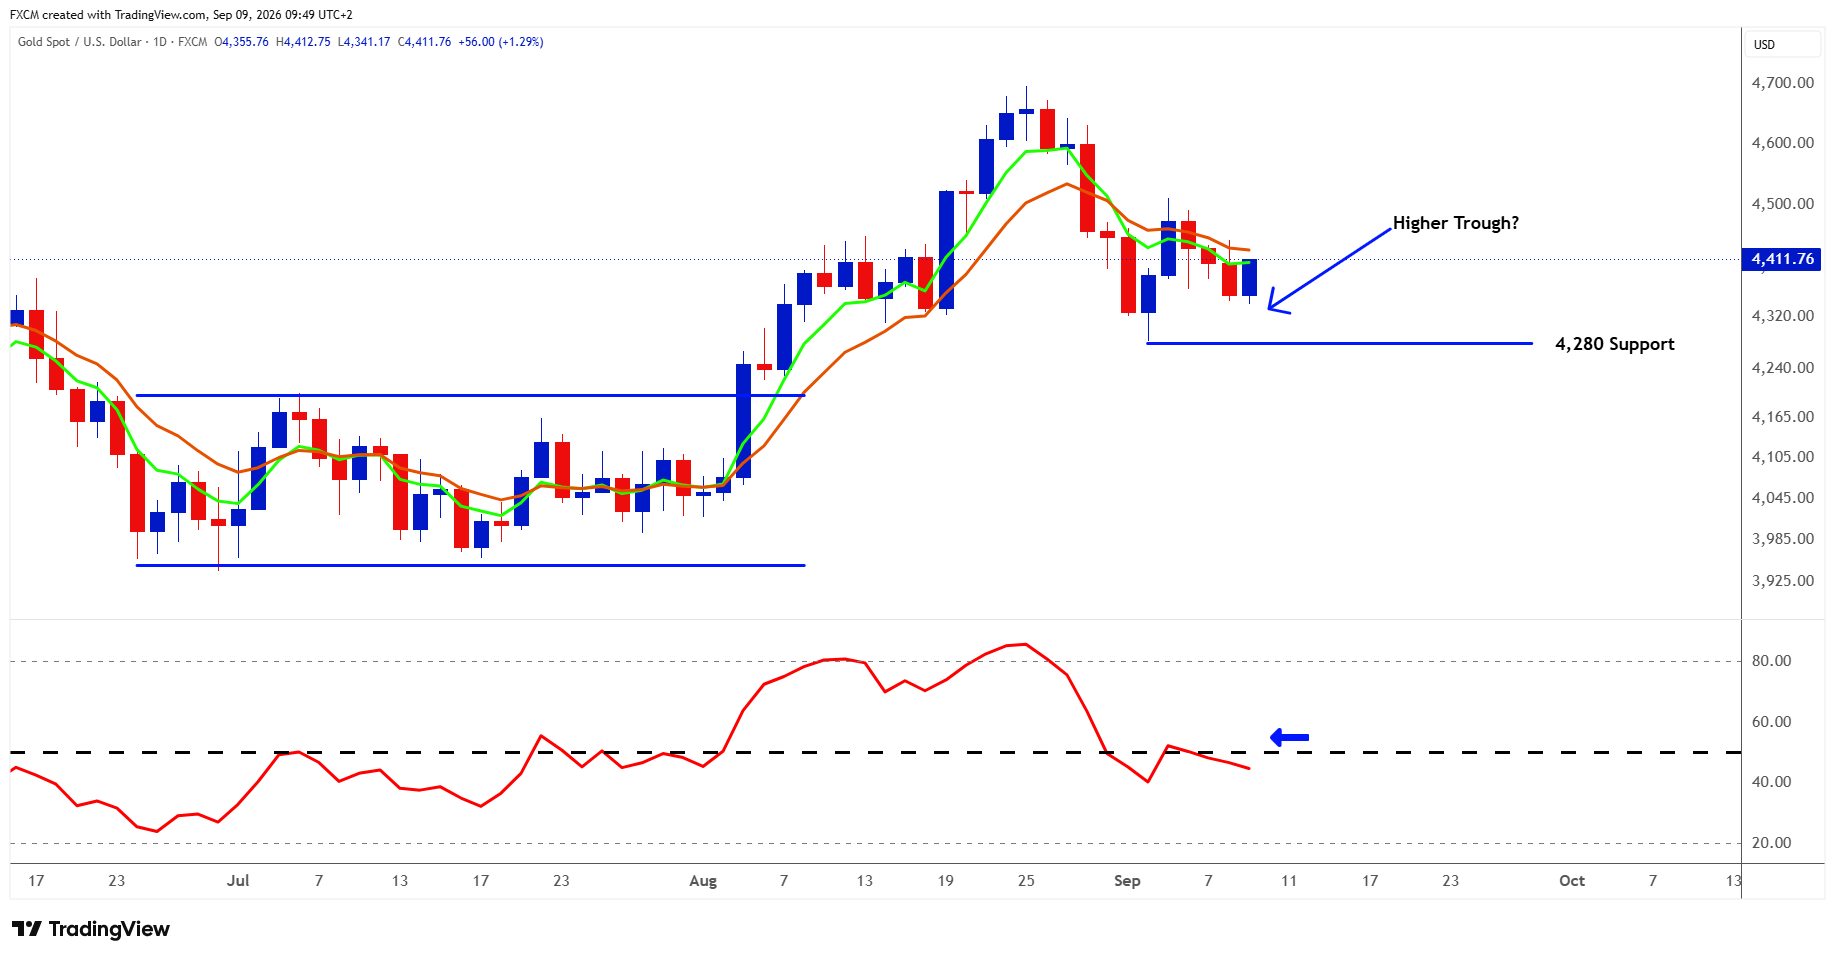
XAUUSD is at an interesting technical juncture as the market attempts to stabilise following its sharp retreat from the late-August peak. The key question is whether the latest pullback can establish a higher trough, preserving the broader recovery structure rather than developing into a deeper correction. Price is currently consolidating around its short-term moving averages, which have begun to flatten, while the $4,280 area provides an important underlying support level. Momentum is less convincing, with the RSI sitting below the neutral 50 line after retreating sharply from overbought territory. A sustained move back above 50 in the RSI would be an encouraging confirmation that bullish momentum is returning, particularly if accompanied by a higher trough in price. Conversely, if the RSI remains below 50, buying momentum is likely to remain subdued and the yellow metal could come under renewed pressure, putting the developing higher-trough structure, and potentially $4,280 support, to the test.
Fundamental Perspective
The fundamental backdrop for XAUUSD remains mixed but provides a credible foundation for the higher-trough scenario. A softer US dollar, which is trading close to a two-week low, is supportive for dollar-denominated gold, while escalating Middle East tensions remain a potential source of safe-haven demand. The principal headwind is elevated US Treasury yields: stronger-than-expected August payrolls lifted expectations of a September Federal Reserve rate hike, while longer-term yields remain high against a backdrop of persistent inflation, solid economic growth, large fiscal deficits and high government debt.
Higher yields raise the opportunity cost of holding non-interest-bearing gold and have already weighed on the metal in recent sessions. That puts Friday's US CPI report firmly centre stage ahead of the Fed's 15–16 September meeting. A softer reading could reduce Fed-tightening expectations, ease upward pressure on Treasury yields and leave the dollar vulnerable, providing a more supportive backdrop for XAUUSD to establish a higher trough. Conversely, a hotter print would strengthen the case for another Fed hike, potentially putting renewed upward pressure on yields and supporting the dollar, both of which could place fresh pressure on gold.
Index in Focus: SPX500
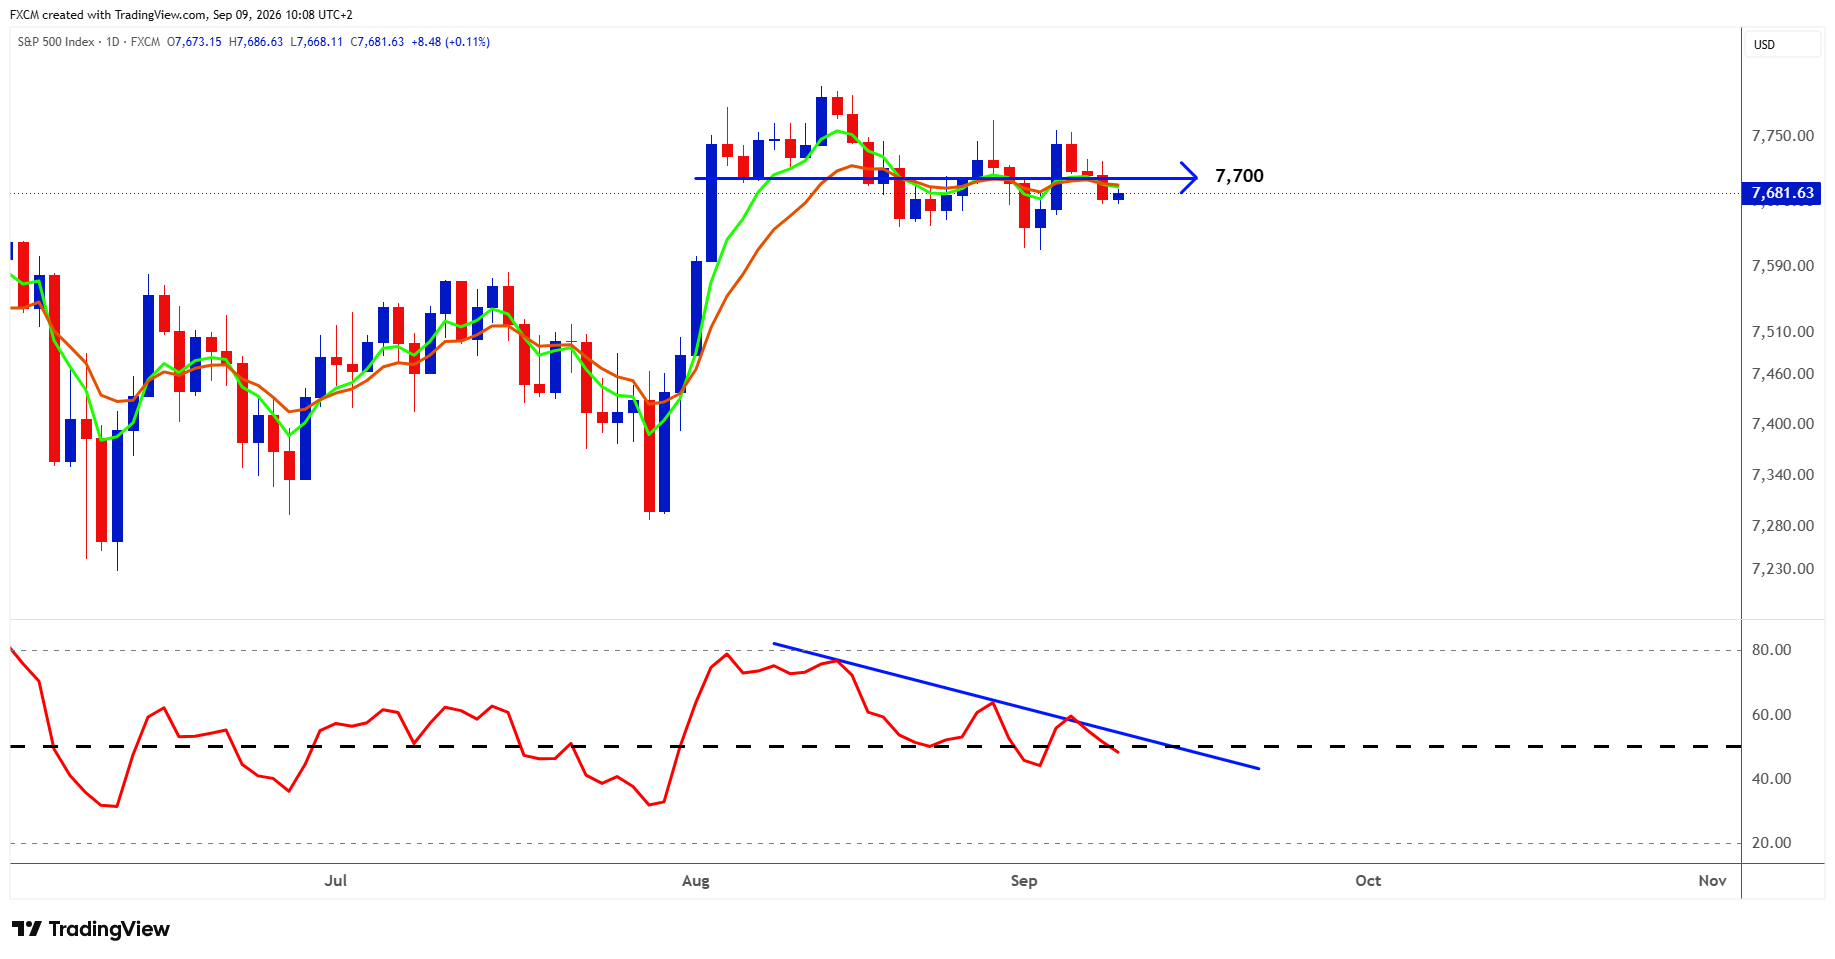
Technical Analysis
SPX500 is at an important technical inflection point, with the index repeatedly oscillating around the 7,700 area rather than establishing a decisive break in either direction. Price is also clustered around its short-term moving averages, which have flattened, reinforcing the sense that the strong August advance has shifted into consolidation. The more concerning signal comes from momentum: the RSI has formed a sequence of lower peaks since its August overbought reading and is currently slipping below the neutral 50 level, suggesting that buying momentum is fading even though the index remains close to its highs. If RSI remains below 50 while SPX500 struggles to reclaim 7,700, the risk of a deeper pullback towards the recent September lows would increase. Conversely, a decisive move back above 7,700 accompanied by the RSI reclaiming 50 would be an encouraging bullish confirmation, suggesting momentum is rebuilding and potentially bringing the recent highs back into focus. For now, the broader uptrend has not been decisively broken, but the combination of sideways price action and deteriorating momentum makes 7,700 and RSI 50 the key confirmation levels to watch.
Fundamental Perspective
The fundamental backdrop for SPX500 has become increasingly two-sided, fitting the index's current consolidation around 7,700. Economic resilience remains supportive, with August payrolls rising a much stronger-than-expected 162,000, while robust corporate earnings and continued investment in AI infrastructure are still providing pockets of strength within technology and semiconductors.
However, the macro environment has become less forgiving. UKOil is trading around $100 a barrel as Middle East tensions intensify, renewing concerns that higher energy costs could add to inflationary pressure and complicate the Federal Reserve's decision next week. Treasury yields also remain elevated, reflecting persistent inflation, resilient growth, fiscal concerns and expectations for tighter monetary policy, raising the hurdle rate for equities. Markets currently lean towards a 25-basis-point Fed hike, although the outcome remains far from certain, putting Friday's US CPI report firmly centre stage.
There are also signs of increasingly uneven equity leadership: software shares were hit by renewed fears of AI-driven disruption on Tuesday while semiconductor and data-centre beneficiaries proved more resilient. Against that backdrop, softer inflation and some easing in oil and Treasury yields could help SPX500 reclaim 7,700 decisively, while persistent price pressures and stronger expectations of further Fed tightening would make the weakening momentum evident on the chart more concerning.

Russell Shor
Senior Market Strategist
Russell Shor is a Senior Market Strategist at FXCM, having been promoted to the role in 2025 in recognition of his depth of insight and consistent delivery of high-impact market analysis. He originally joined FXCM in October 2017 as a Senior Market Specialist.
Russell holds an Honours Degree in Economics from the University of South Africa, is a certified FMVA®, and a full member of the Society of Technical Analysts (UK). With over 20 years of experience in financial markets, his work is renowned for its clarity, precision, and strategic value across asset classes.


Any opinions, news, research, analyses, prices, other information, or links to third-party sites contained on this website are provided on an "as-is" basis, as general market commentary and do not constitute investment advice. The market commentary has not been prepared in accordance with legal requirements designed to promote the independence of investment research, and it is therefore not subject to any prohibition on dealing ahead of dissemination. Although this commentary is not produced by an independent source, FXCM takes all sufficient steps to eliminate or prevent any conflicts of interests arising out of the production and dissemination of this communication. The employees of FXCM commit to acting in the clients' best interests and represent their views without misleading, deceiving, or otherwise impairing the clients' ability to make informed investment decisions. For more information about the FXCM's internal organizational and administrative arrangements for the prevention of conflicts, please refer to the Firms' Managing Conflicts Policy. Please ensure that you read and understand our Full Disclaimer and Liability provision concerning the foregoing Information, which can be accessed here.