
Market Threads – Financial Markets Show Consolidation with No Clear Trend. Attention is Warranted

.png)
Tracking important market threads across currencies, commodities, and indices
- Oil markets remain trapped between geopolitical tension and tightening supply, with UKOil and USOil consolidating as traders wait for the next major breakout catalyst.
- Could the next big USDOLLAR breakout be approaching? Our latest analysis explores the key drivers traders are watching.
- Gold is stuck between safe-haven demand and rising rate fears. Could the next major XAUUSD move be approaching?
- Could the UK100 be gearing up for its next breakout? See why traders are watching this buy-the-dip setup closely.
Cross- Asset View
Beneath the surface, oil, the US dollar, and gold all appear to be reflecting the same uneasy market mood: hesitation ahead of a potentially major move.
Geopolitical tensions, inflation concerns, and shifting central bank expectations continue to pull markets in opposing directions, creating an environment where conviction remains surprisingly fragile despite the intensity of recent headlines.
What makes the current setup particularly interesting is how closely these major asset classes seem to be moving in sync, with each one hinting at the same underlying macro story.
For now, markets remain trapped in consolidation, but the longer this tension builds, the more significant the eventual breakout across the broader financial landscape could become.
Oil
Technical Analysis
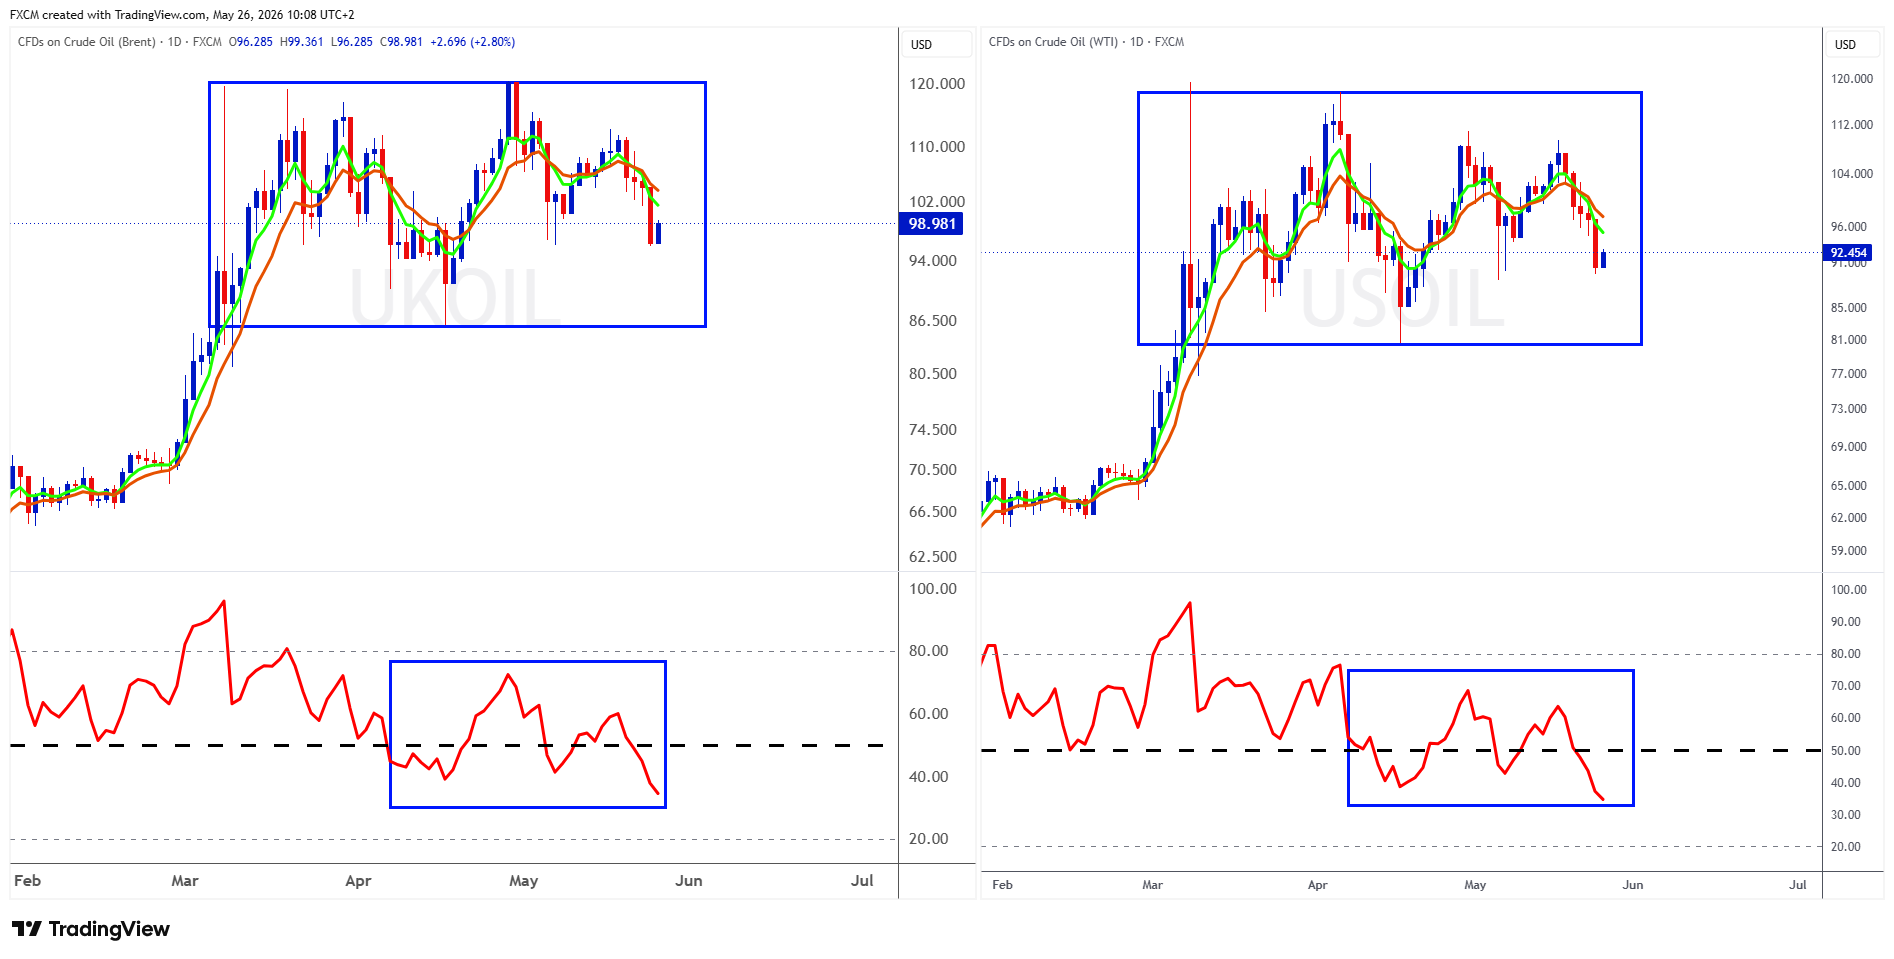
Oil continues to churn sideways. The chart on the left shows UKOil, while the right shows USOil. Both instruments remain within their respective consolidation patterns, with their RSIs oscillating around the 50 level, which typically signals a lack of clear directional momentum.
If the RSIs hold above 50, bullish momentum could begin to support prices in both UKOil and USOil. However, sustained moves below 50 would likely point to further downside pressure. Ultimately, much of the technical positioning will depend on underlying fundamental developments.
For now, there is no strong directional bias, and both UKOil and USOil remain in consolidation until a clearer breakout/breakdown emerges.
Fundamental Perspective
Oil markets remain caught between tightening physical supply and rapidly shifting geopolitical headlines, which helps explain the current consolidation in both UKOil and USOil.
The biggest driver continues to be uncertainty surrounding the Strait of Hormuz after months of disruption linked to the Iran conflict. Hopes of a potential US-Iran agreement briefly pushed prices lower this week, but renewed military strikes have quickly reminded traders that the situation remains fragile and far from resolved.
At the same time, the IEA has warned that global oil inventories are being drawn down at a record pace as supply disruptions continue to tighten the market. Demand expectations have also become harder to interpret, particularly across parts of Asia where higher prices and disrupted flows are starting to weigh on consumption.
The result is a market struggling to establish direction: one headline points toward easing tensions and lower oil prices, while the next reignites fears of supply shocks, tighter inventories, and renewed inflation pressure.
The USDOLLAR
Technical Analysis
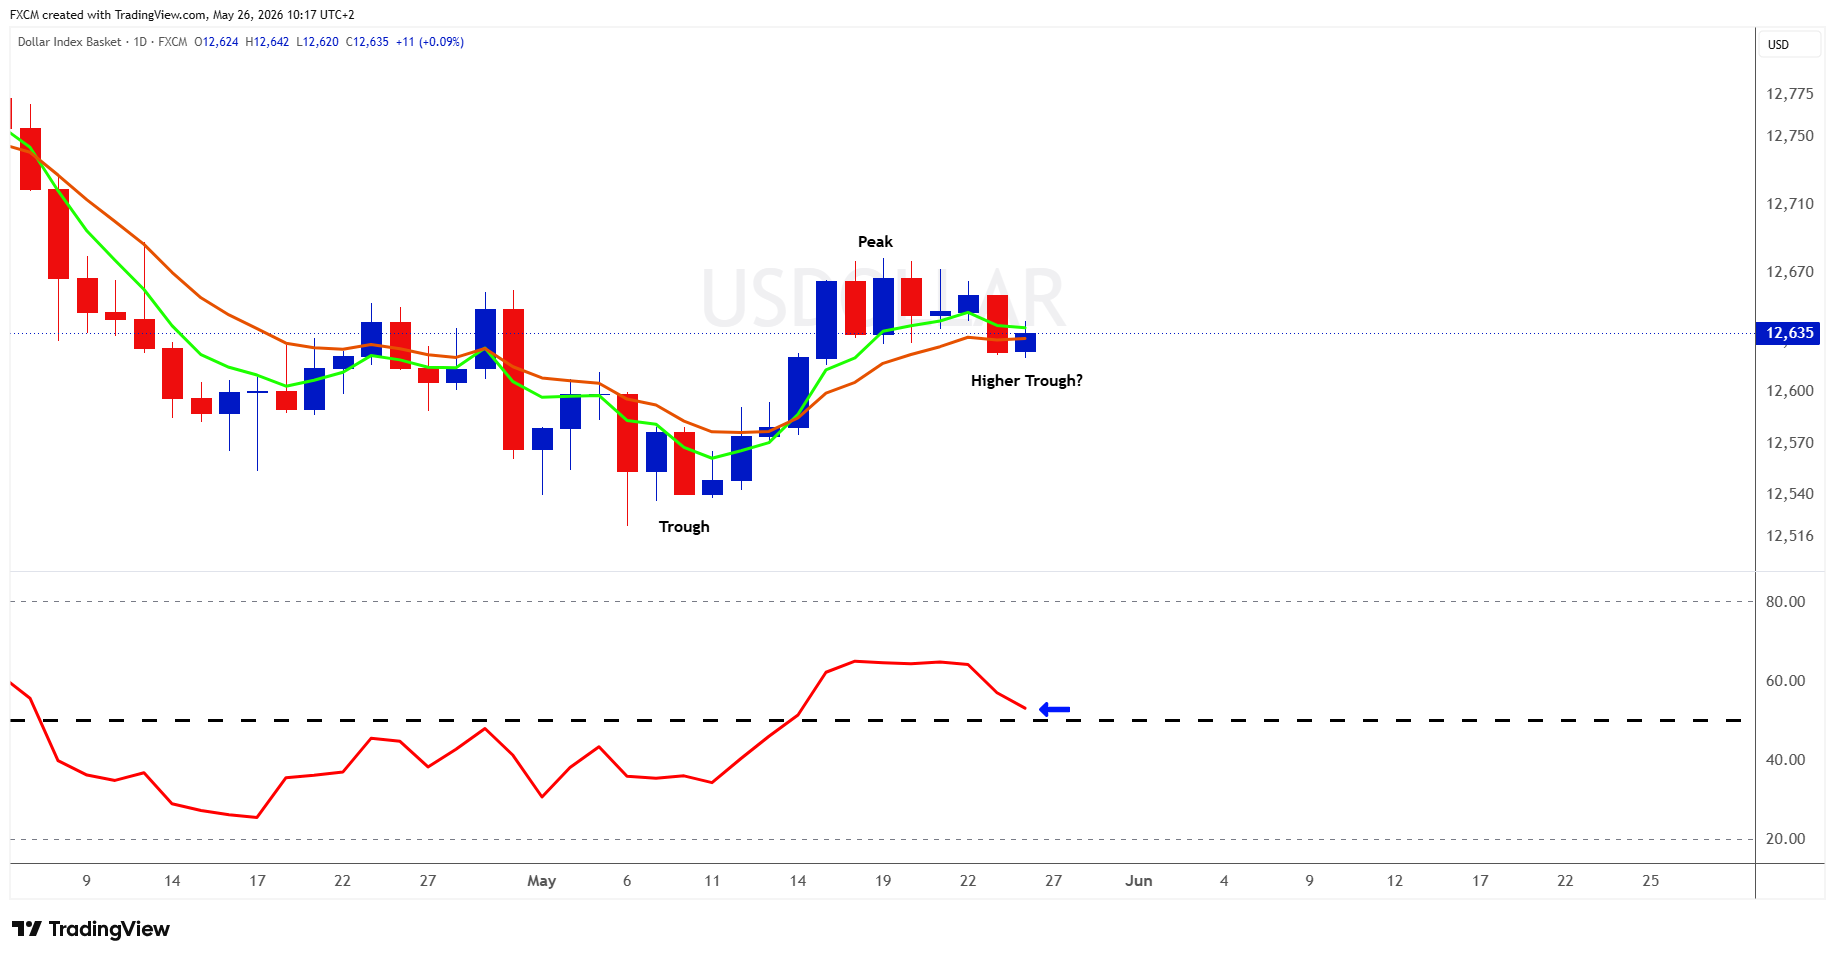
We relabelled the peaks and troughs this week to assess whether the USDOLLAR is beginning to establish a trend. At present, we have identified a trough followed by a peak, and the next key development will be whether a higher trough forms. If that occurs, it would create the foundation for another higher peak, which would confirm an emerging uptrend on the daily chart.
For now, however, those conditions have not yet been met, so we cannot conclude that the greenback is in a sustained uptrend.
Much will depend on the RSI (blue arrow). If it holds above the 50 level, the case for an uptrend strengthens. However, if the RSI weakens and falls below 50, negative momentum is likely to place pressure on the greenback.
This setup also aligns with the oil market, which remains in consolidation and lacks a clear directional trend. If oil's uptrend resumes, it could help keep the greenback's RSI above 50 and support renewed dollar strength, and vice versa.
Fundamental Perspective
The USDOLLAR remains caught between rising geopolitical risk and growing uncertainty around the Federal Reserve, which helps explain the current lack of clear trend direction.
Escalating tensions surrounding the Strait of Hormuz and renewed US strikes on Iran have kept demand for traditional safe-haven assets alive, while elevated oil prices are also reviving fears that inflation could remain sticky for longer. That has complicated expectations for Fed rate cuts, with traders increasingly questioning whether the central bank may need to keep policy tighter for longer if energy-driven inflation pressures persist. At the same time, markets remain uncertain about the broader global growth outlook, leaving the dollar struggling to establish a decisive directional move.
The result is a market where geopolitical stress and higher oil prices continue to support the greenback, but uncertainty around inflation, growth, and Fed policy is limiting conviction behind a sustained dollar breakout.
Some Currencies to Keep an Eye on
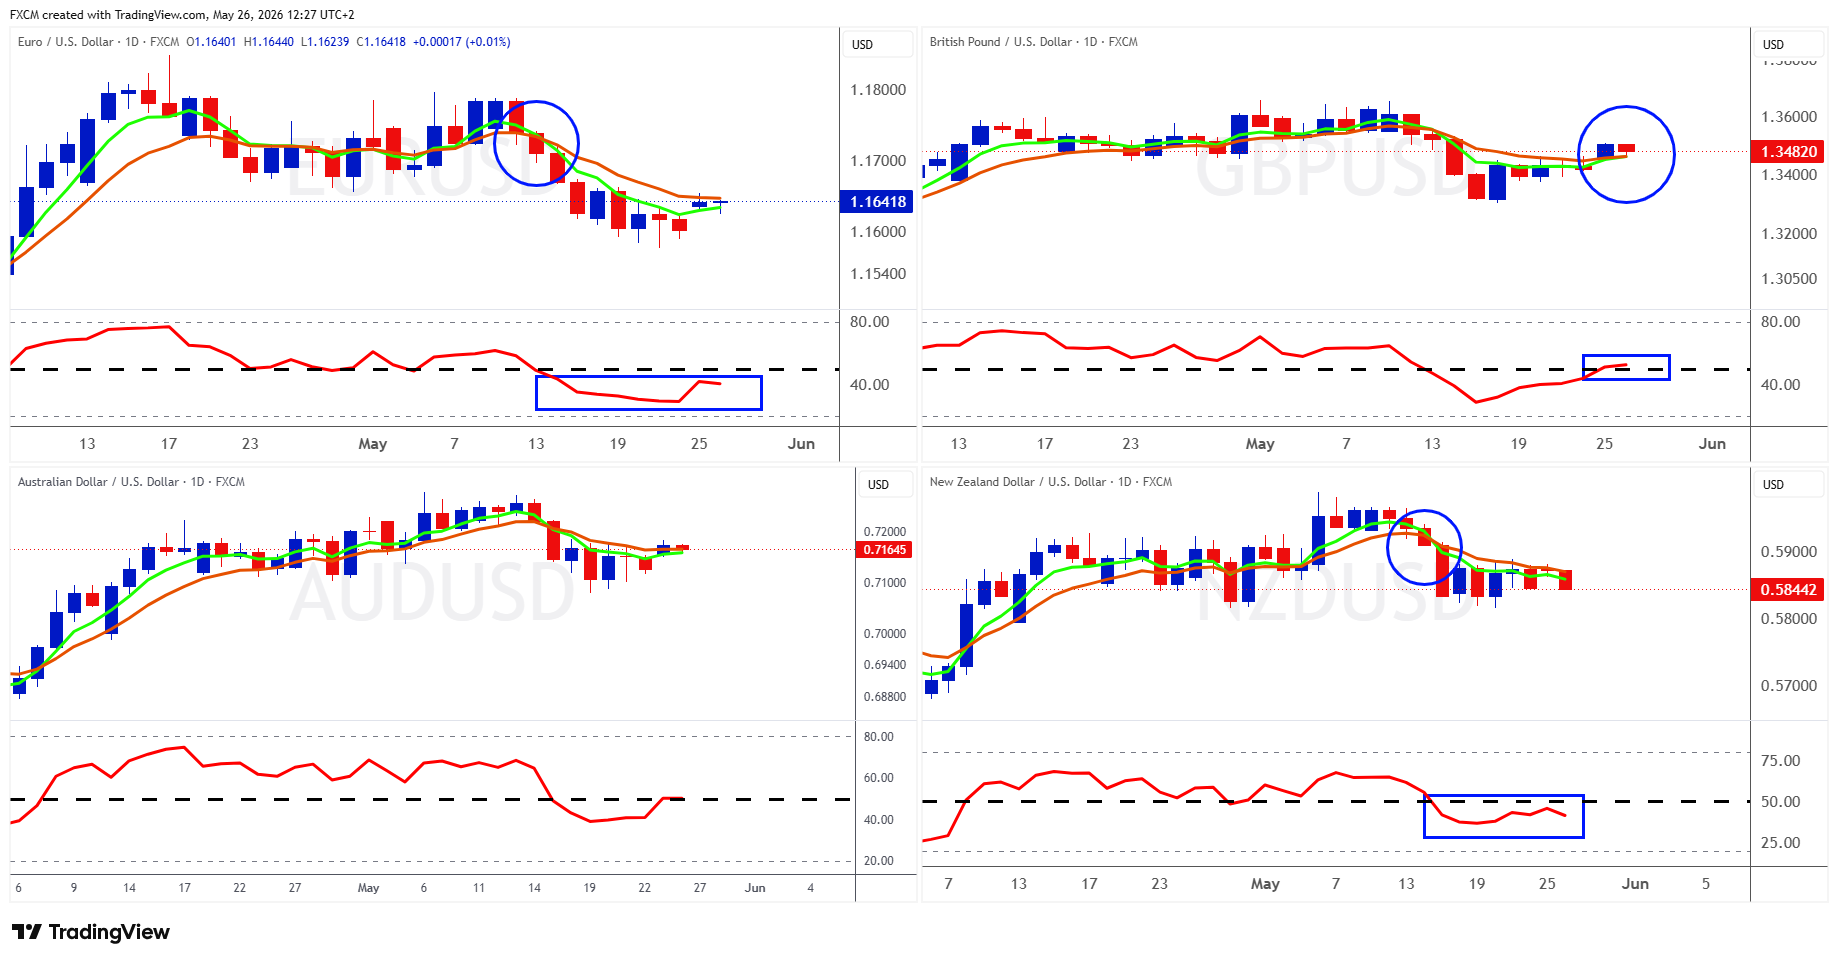
The top left chart shows EURUSD, the top right shows GBPUSD, the bottom left shows AUDUSD, and the bottom right shows NZDUSD.
Our view remains that the USDOLLAR is the key driver in determining trend across these pairs. Given the current lack of a clear trend in the dollar itself, analysing these currencies remains challenging. Nevertheless, the daily charts currently suggest the following:
- EURUSD: The EMAs remain in bearish formation, while the RSI is below 50. As long as the RSI stays beneath that level, downside pressure is likely to persist on EURUSD.
- GBPUSD: The pair has turned more constructive, with the RSI moving above 50. The EMAs also appear close to a bullish crossover. If the RSI can maintain above 50, it would support further upside potential for GBPUSD.
- AUDUSD: The pair is leaning towards neutral territory. The RSI is hovering around 50, while the EMAs remain relatively flat. Further chart development is needed before a clearer directional bias can emerge.
- NZDUSD: The pair retains a downside bias, with the RSI holding below 50 and the EMAs remaining in bearish formation.
These pairs continue to be driven by oil prices, geopolitical tensions, and shifting central bank expectations. EURUSD remains pressured by weak eurozone growth concerns, while GBPUSD has shown greater resilience as markets reassess the Bank of England outlook amid rising energy costs. AUDUSD and NZDUSD remain closely tied to global risk sentiment and commodity trends, with elevated oil prices and growth concerns limiting upside momentum.
Overall, the lack of a clear USDOLLAR trend continues to leave these pairs without strong directional conviction.
Gold
Technical Analysis
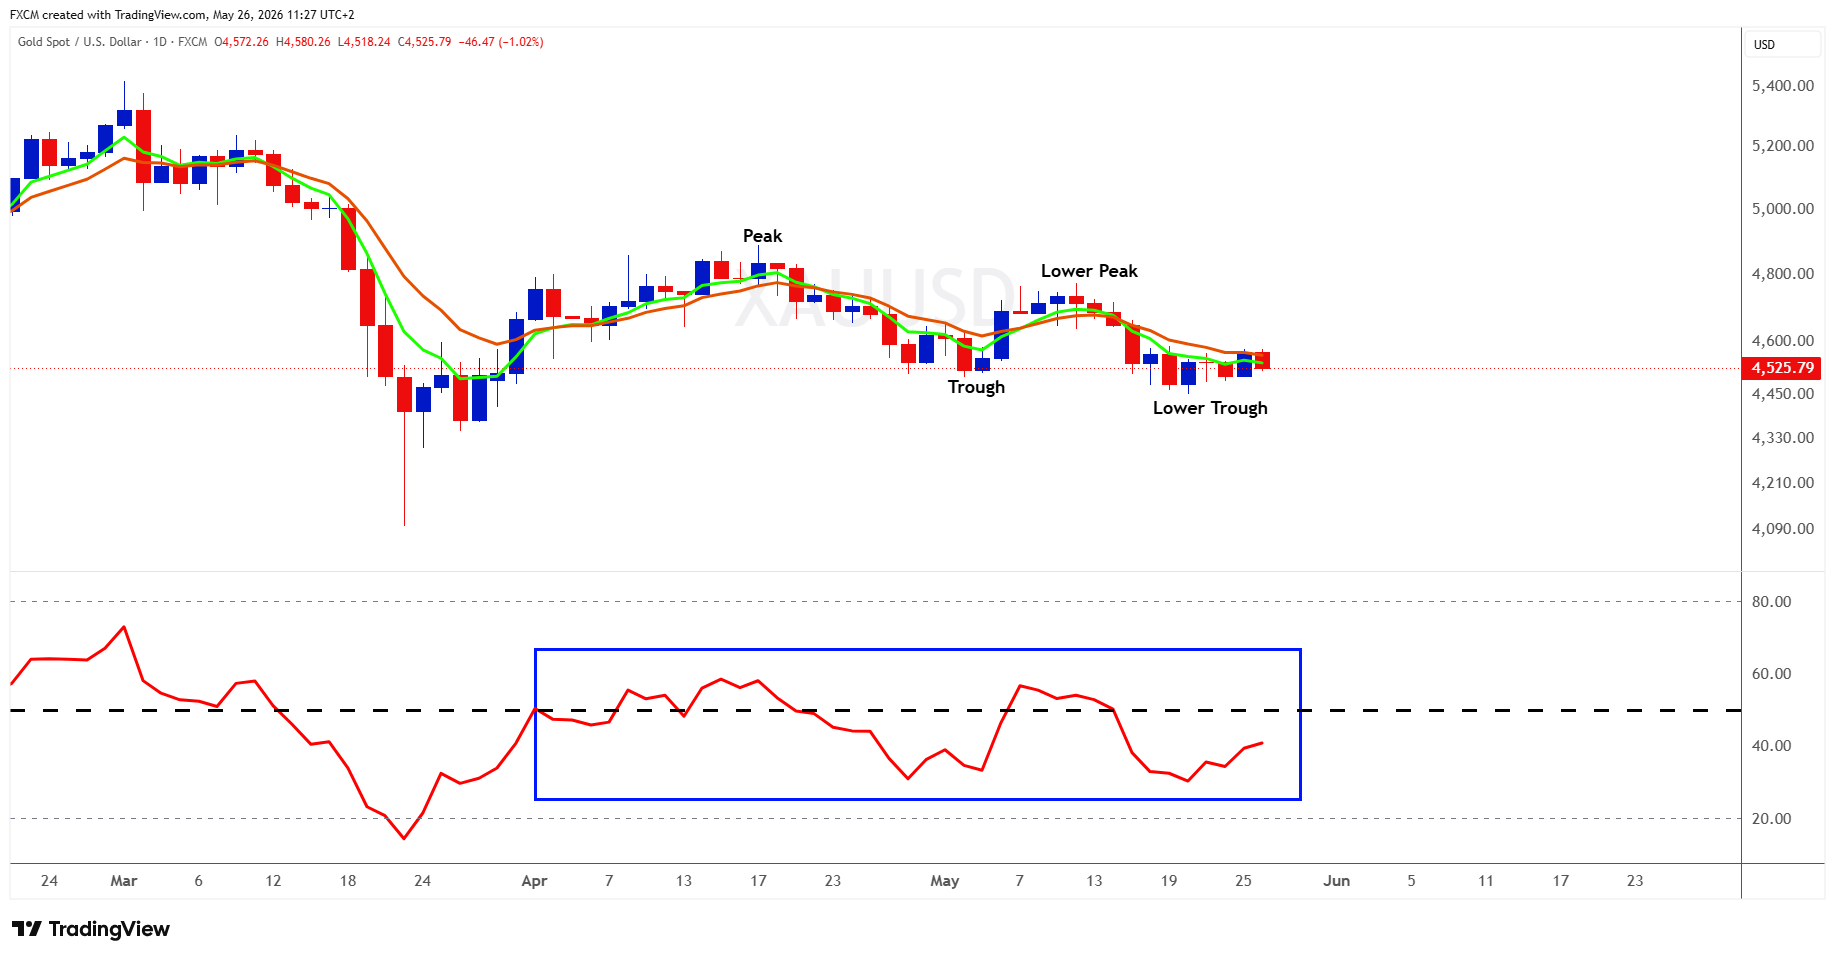
As noted last week, gold has charted a lower peak followed by a lower trough, which technically keeps the yellow metal in a downtrend on the daily chart. However, it is notable that gold has not experienced a sharp decline. In fact, the angle of the downtrend remains extremely shallow, to the point where price action appears more sideways than decisively bearish, albeit with a slight downward bias.
This broadly aligns with the consolidation seen in oil and the lack of a clear trend in the dollar, suggesting that gold may also be in a broader consolidation phase despite the lower peak and lower trough structure.
Supporting this view is the RSI, which has remained choppy and oscillated around the 50 level since the beginning of April, reflecting the absence of sustained momentum in either direction.
If gold charts another lower peak followed by a further lower trough, it will strengthen the bearish case. For now, we await further price action to determine whether consolidation continues, or a clearer directional trend begins to emerge.
Fundamental Perspective
Gold's recent price action reflects a market torn between safe-haven demand and the growing risk of higher-for-longer US interest rates, which helps explain why XAUUSD has been drifting sideways rather than establishing a decisive trend.
Escalating tensions surrounding Iran and the Strait of Hormuz continue to support demand for defensive assets, particularly after renewed US military strikes this week reminded investors that geopolitical risks remain elevated.
At the same time, rising oil prices are reviving inflation concerns, lifting Treasury yields and reducing expectations for Federal Reserve rate cuts. That has created a more challenging backdrop for gold because higher yields increase the opportunity cost of holding non-yielding assets like bullion.
The result is a market caught between competing forces: geopolitical uncertainty and inflation fears continue to underpin gold structurally, while a firmer dollar and elevated rate expectations are limiting conviction behind a sustained upside breakout.
Index in Focus: UK100
Technical Analysis
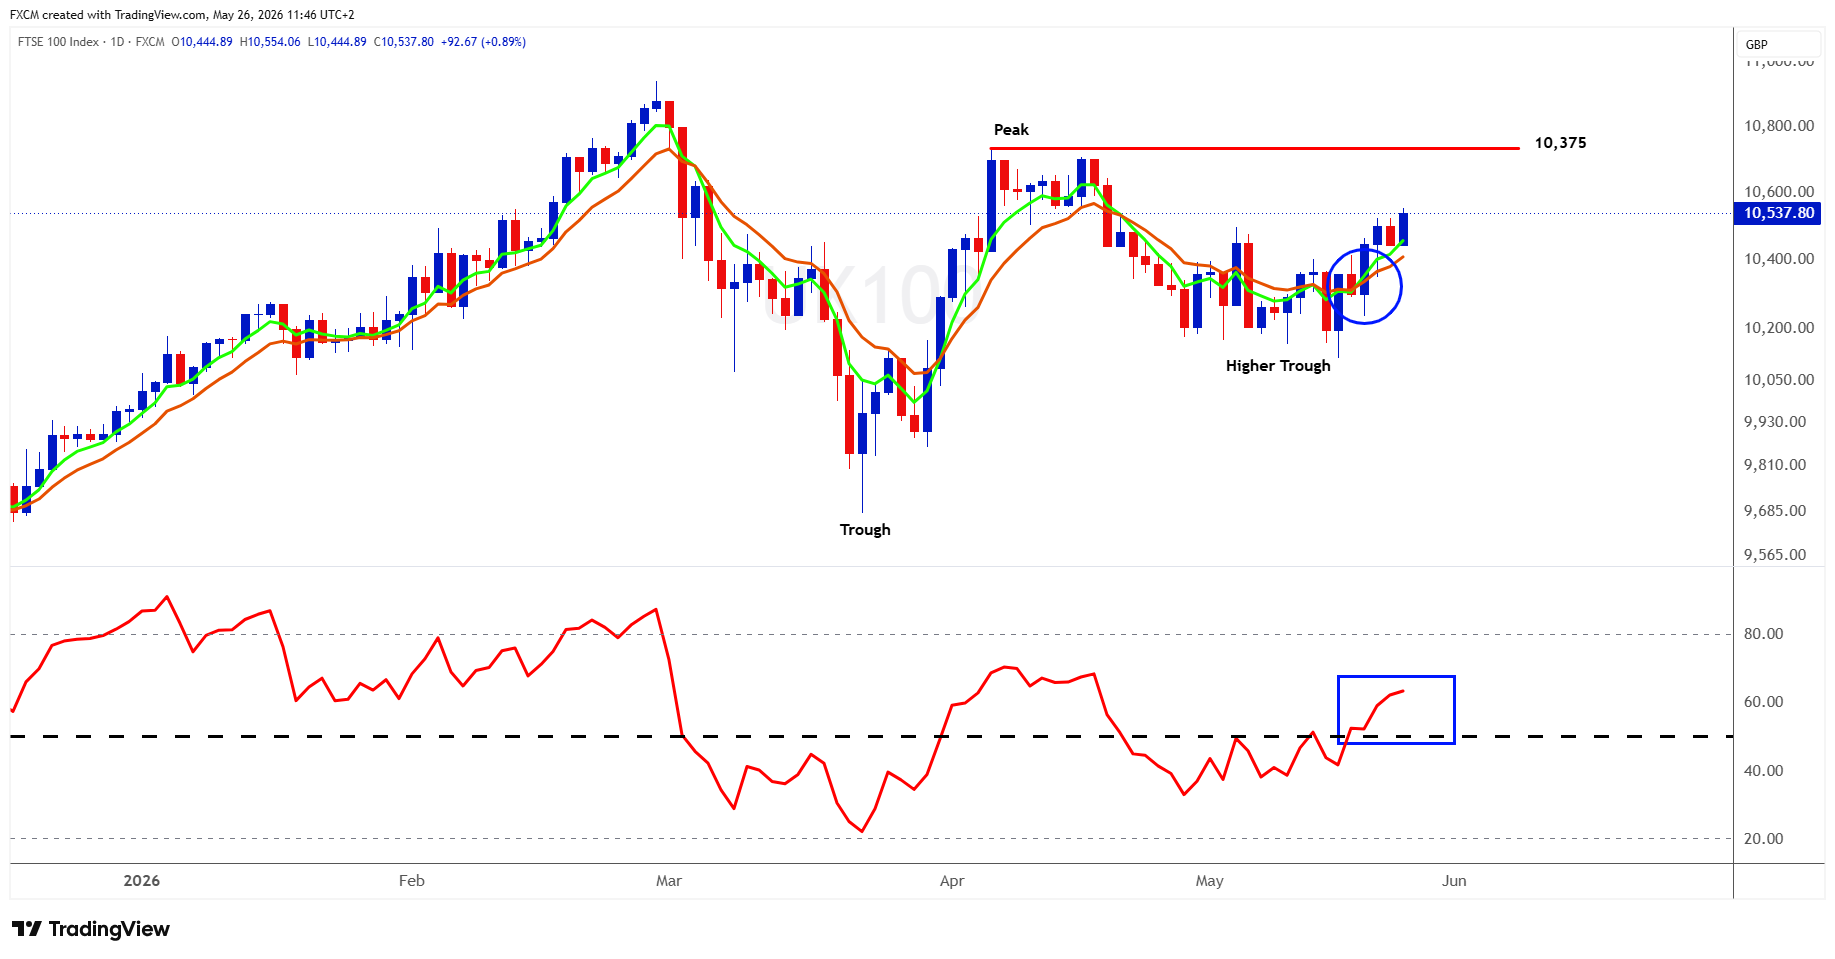
This week we turn our attention to the UK100, taking a broader approach to the trend analysis. Rather than applying peak and trough analysis too rigidly, we believe the current structure still captures the underlying direction of the market. In this regard, a higher trough appears to have formed, potentially creating the foundation for the next higher peak, which would be confirmed if price breaks above the 10,735 level.
We also note that the RSI has moved above the 50 line (blue rectangle). If it manages to hold above that level, we would expect the EMAs to begin developing stronger angle and separation as price pushes towards a higher peak. In other words, the current setup may represent the proverbial buy-the-dip opportunity. However, caution may still be warranted when the fundamentals are considered.
Fundamental Perspective
The UK100 continues to show relative resilience despite an increasingly complicated macro backdrop, helped in large part by the index's heavy exposure to energy, mining, and defensive multinational companies.
Rising oil prices linked to renewed tensions surrounding Iran and the Strait of Hormuz have supported commodity producers, which has helped underpin the UK index even as broader global markets remain volatile.
At the same time, investors are reassessing the outlook for the Bank of England as persistent inflation and higher energy costs reduce confidence that aggressive rate cuts are likely in the near term. That creates a delicate balancing act for equities: higher oil prices are supportive for the UK100's large energy sector, but they also risk keeping inflation elevated and financial conditions tighter for longer.
The result is a market where commodity strength continues to provide support for the index, while uncertainty around inflation, interest rates, and global growth is limiting conviction behind a sustained breakout higher.

Russell Shor
Senior Market Strategist
Russell Shor is a Senior Market Strategist at FXCM, having been promoted to the role in 2025 in recognition of his depth of insight and consistent delivery of high-impact market analysis. He originally joined FXCM in October 2017 as a Senior Market Specialist.
Russell holds an Honours Degree in Economics from the University of South Africa, is a certified FMVA®, and a full member of the Society of Technical Analysts (UK). With over 20 years of experience in financial markets, his work is renowned for its clarity, precision, and strategic value across asset classes.


Any opinions, news, research, analyses, prices, other information, or links to third-party sites contained on this website are provided on an "as-is" basis, as general market commentary and do not constitute investment advice. The market commentary has not been prepared in accordance with legal requirements designed to promote the independence of investment research, and it is therefore not subject to any prohibition on dealing ahead of dissemination. Although this commentary is not produced by an independent source, FXCM takes all sufficient steps to eliminate or prevent any conflicts of interests arising out of the production and dissemination of this communication. The employees of FXCM commit to acting in the clients' best interests and represent their views without misleading, deceiving, or otherwise impairing the clients' ability to make informed investment decisions. For more information about the FXCM's internal organizational and administrative arrangements for the prevention of conflicts, please refer to the Firms' Managing Conflicts Policy. Please ensure that you read and understand our Full Disclaimer and Liability provision concerning the foregoing Information, which can be accessed here.