
Market Threads – Oil Risk Rises, but Inflation Is in the Driver’s Seat

.png)
Tracking important market threads across currencies, commodities, and indices.
- Oil is back in play as UKOil and USOil test major breakout levels amid escalating Strait of Hormuz tensions.
- Is USDOLLAR breaking down? Cooling inflation and fading rate-hike expectations put the crucial 12,700 level in the spotlight.
- Gold teeters on the cliff edge as surging oil prices keep rates restrictive.
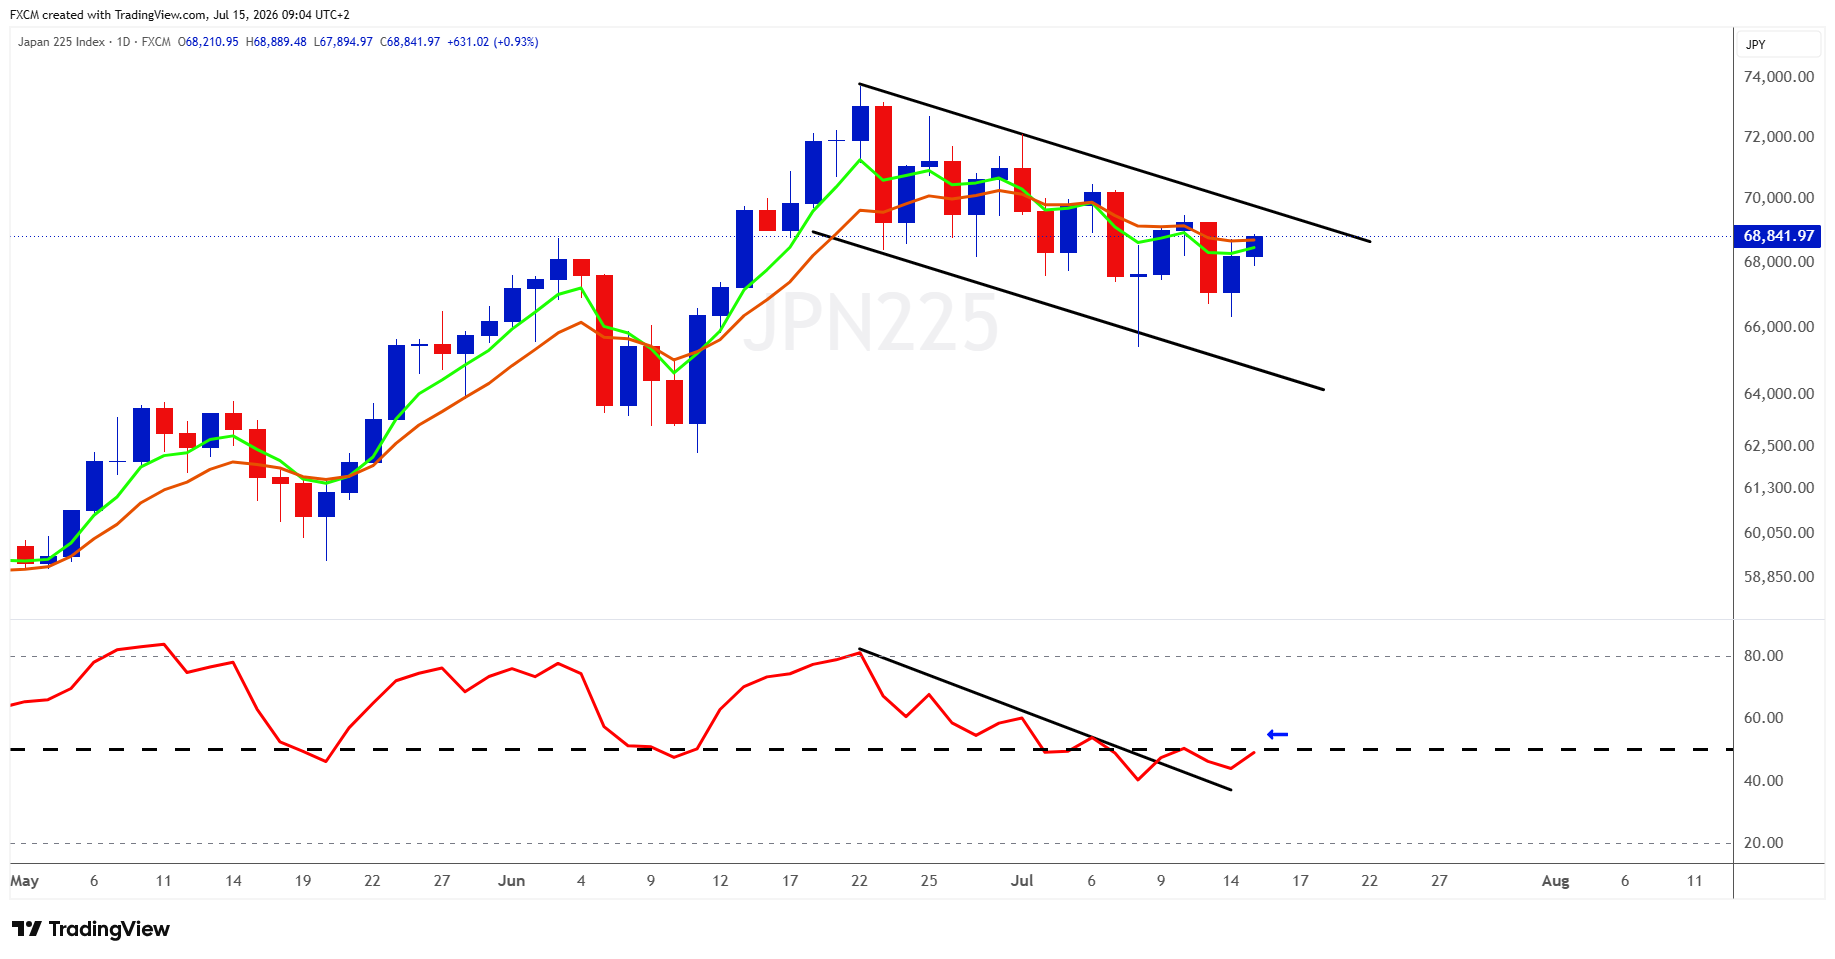
- JPN225 is on breakout watch as a bullish flag and improving tech momentum put 70,000, and potentially 73,000, within reach.
Cross Asset View
A shifting macro backdrop is creating sharply different signals across oil, the US dollar, gold and Japanese equities. Yesterday's softer-than-expected US inflation print eased near-term tightening fears, although Fed Chair Kevin Warsh tempered the relief by warning that one favourable reading was not "mission accomplished" on inflation. With energy risk rising and several markets nearing key technical inflection points, the cross-asset picture is becoming increasingly compelling.
Oil
Technical Analysis
UKOil
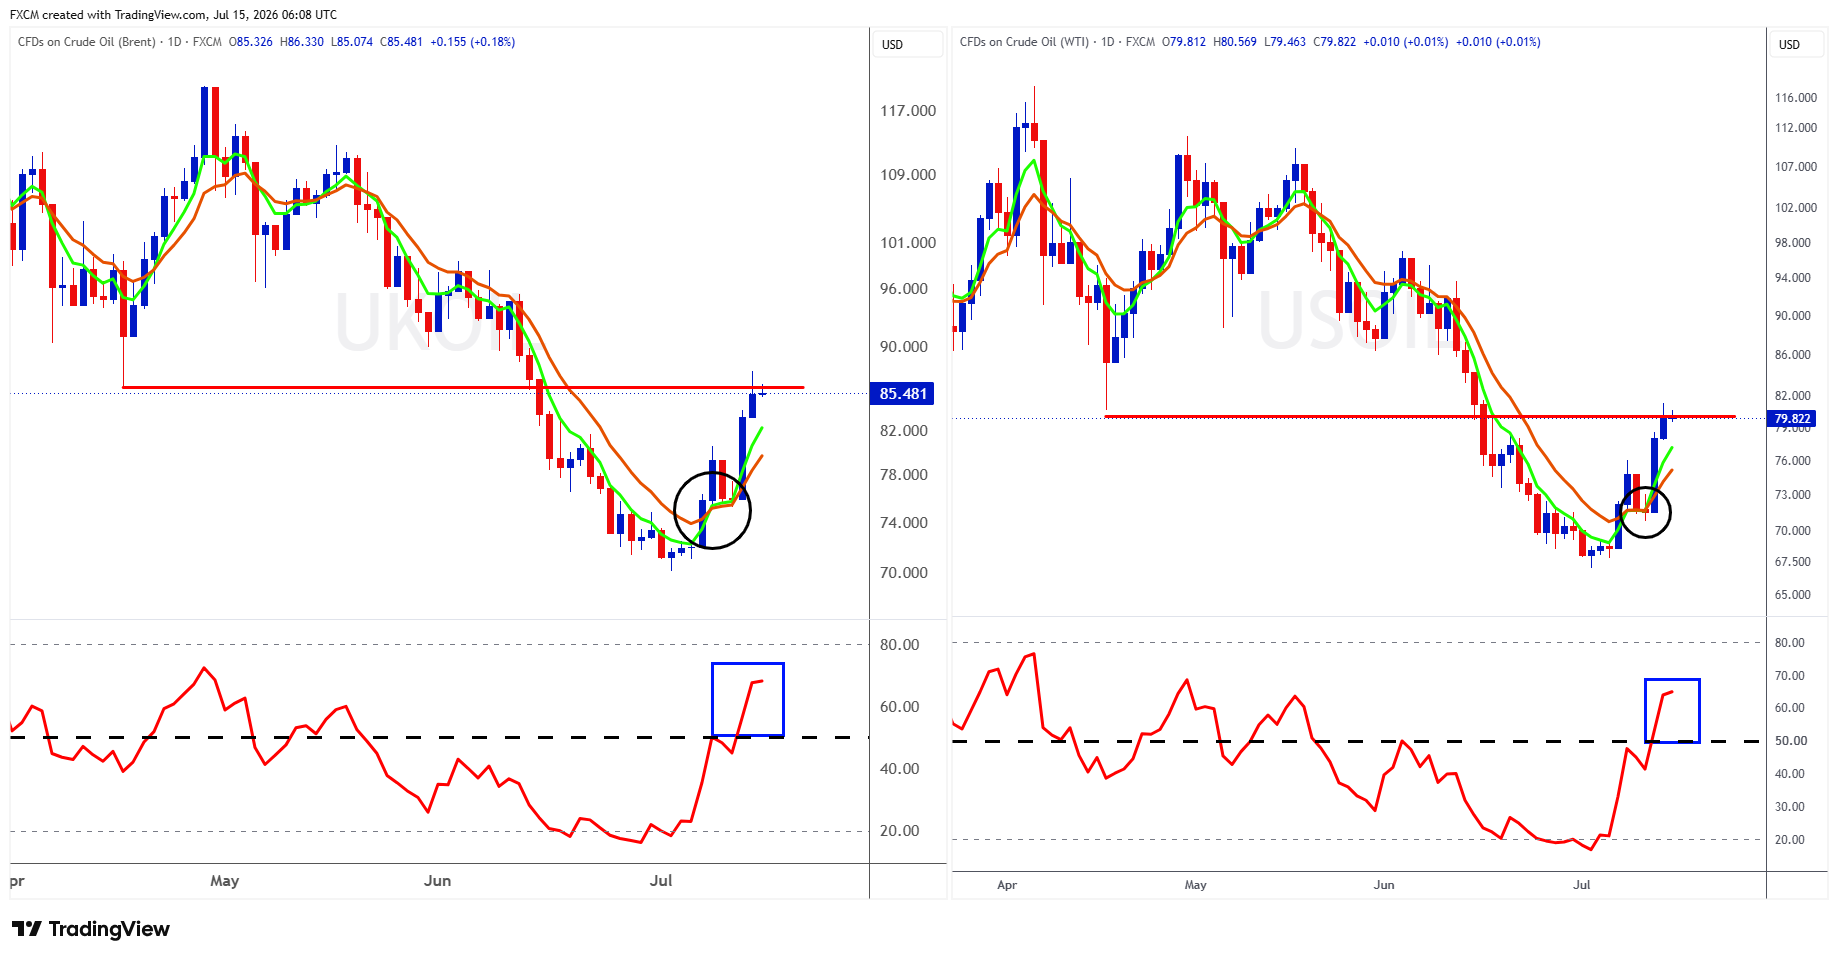
UKOil has staged a convincing short-term reversal from its early-July low near $70, breaking above both moving averages and the prior congestion zone around $78-80. The faster average has turned sharply higher and crossed above the slower line, and buyers reasserted control. RSI has also shifted decisively above 50, confirming strong momentum without yet being unequivocally overbought. At roughly $85.34, however, UKOil is testing the first meaningful resistance area around $86, where the earlier decline accelerated. A close above this region could expose $90, while failure to break through would increase the likelihood of consolidation towards $82 or, more importantly, the $78-80 breakout zone.
USOil
USOil displays an almost identical reversal pattern, rebounding from approximately $67 and above both moving averages. RSI's rapid recovery from oversold territory to the mid-60s marks a clear momentum regime change, although the speed of the move means the market may now be vulnerable to a near-term pause. USOil is currently challenging the psychologically important $80 level; a sustained break would strengthen the case for a move towards $85-86. The $72-73 region now serving as the more important dividing line between a genuine trend reversal and merely a sharp rally within the preceding downtrend.
Fundamental Perspective
Oil's breakout is being driven primarily by renewed geopolitical risk. The US has reinstated its blockade on Iranian ports, Iran says it has again closed the Strait of Hormuz, and attacks on shipping have reduced traffic through a route that normally carries roughly one-fifth of global oil and LNG. Brent and key Middle Eastern crude benchmarks have consequently moved sharply back into backwardation, signalling that traders are again paying a premium for near-term supply. The longer-term picture is less decisively bullish, however: global production rebounded strongly in June, and the EIA expects prices to retreat if Gulf exports continue normalising. UKOil and USOil are therefore caught between an immediate and credible supply threat and the risk that diplomacy or improved shipping flows rapidly removes much of the geopolitical premium.
USDOLLAR
Technical Analysis
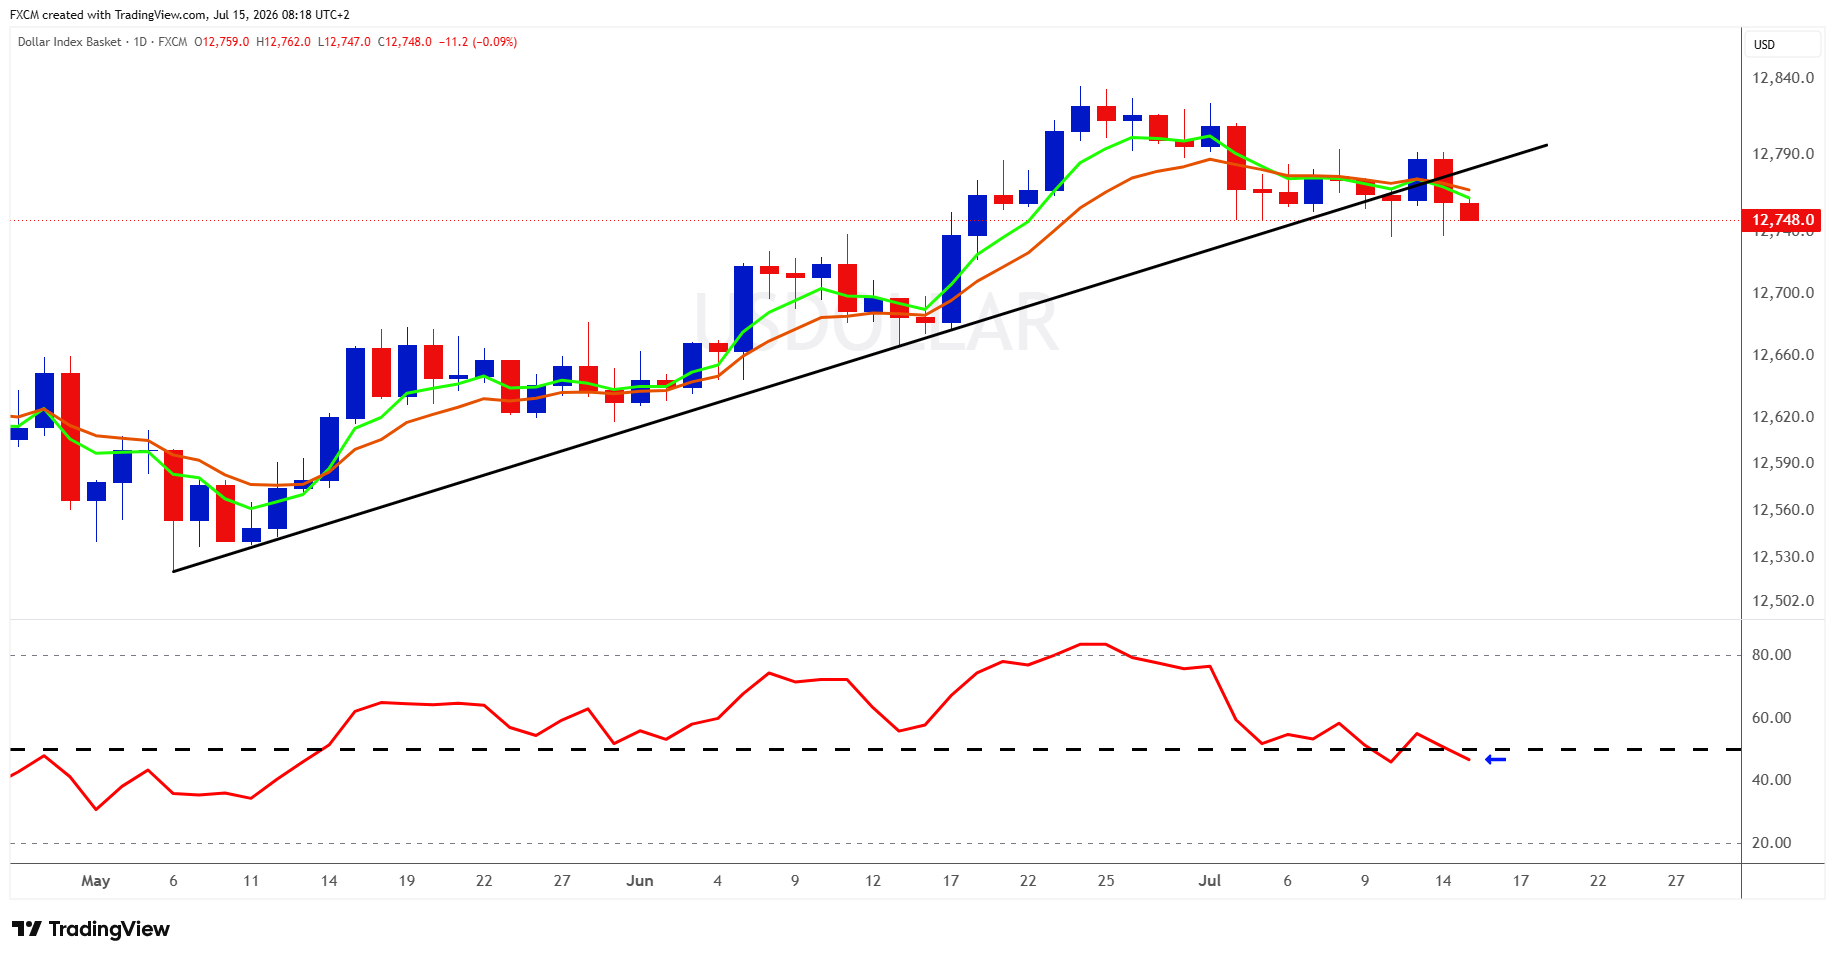
USDOLLAR is showing its clearest loss of momentum since the May recovery began. Price has slipped beneath the rising trendline and fallen below both moving averages. The faster average is also rolling beneath the slower one, while RSI has moved below 50, confirming that momentum has shifted towards sellers. A sustained daily close below the 12,740 area would strengthen the breakdown and expose 12,700, followed by approximately 12,660. Bulls now need to reclaim the broken trendline and the 12,770-12,790 resistance zone to show that this is merely a temporary pullback rather than the beginning of a broader dollar reversal.
Fundamental Perspective
USDOLLAR is weakening because softer US inflation has reduced expectations for an imminent Fed rate increase, outweighing the safe-haven support ordinarily generated by escalating tensions around the Strait of Hormuz. June CPI fell 0.4% month on month and slowed to 3.5% annually, driving two-year Treasury yields lower and cutting the probability of a July hike to around 16%. Fed Chair Kevin Warsh maintained a firm anti-inflation stance and defended the central bank's independence, but offered no signal that a rate increase was imminent. Rising oil prices remain a threat to future inflation, yet for now cooler data and lower short-term yields have weakened the dollar's interest-rate advantage.
Gold
Technical Analysis
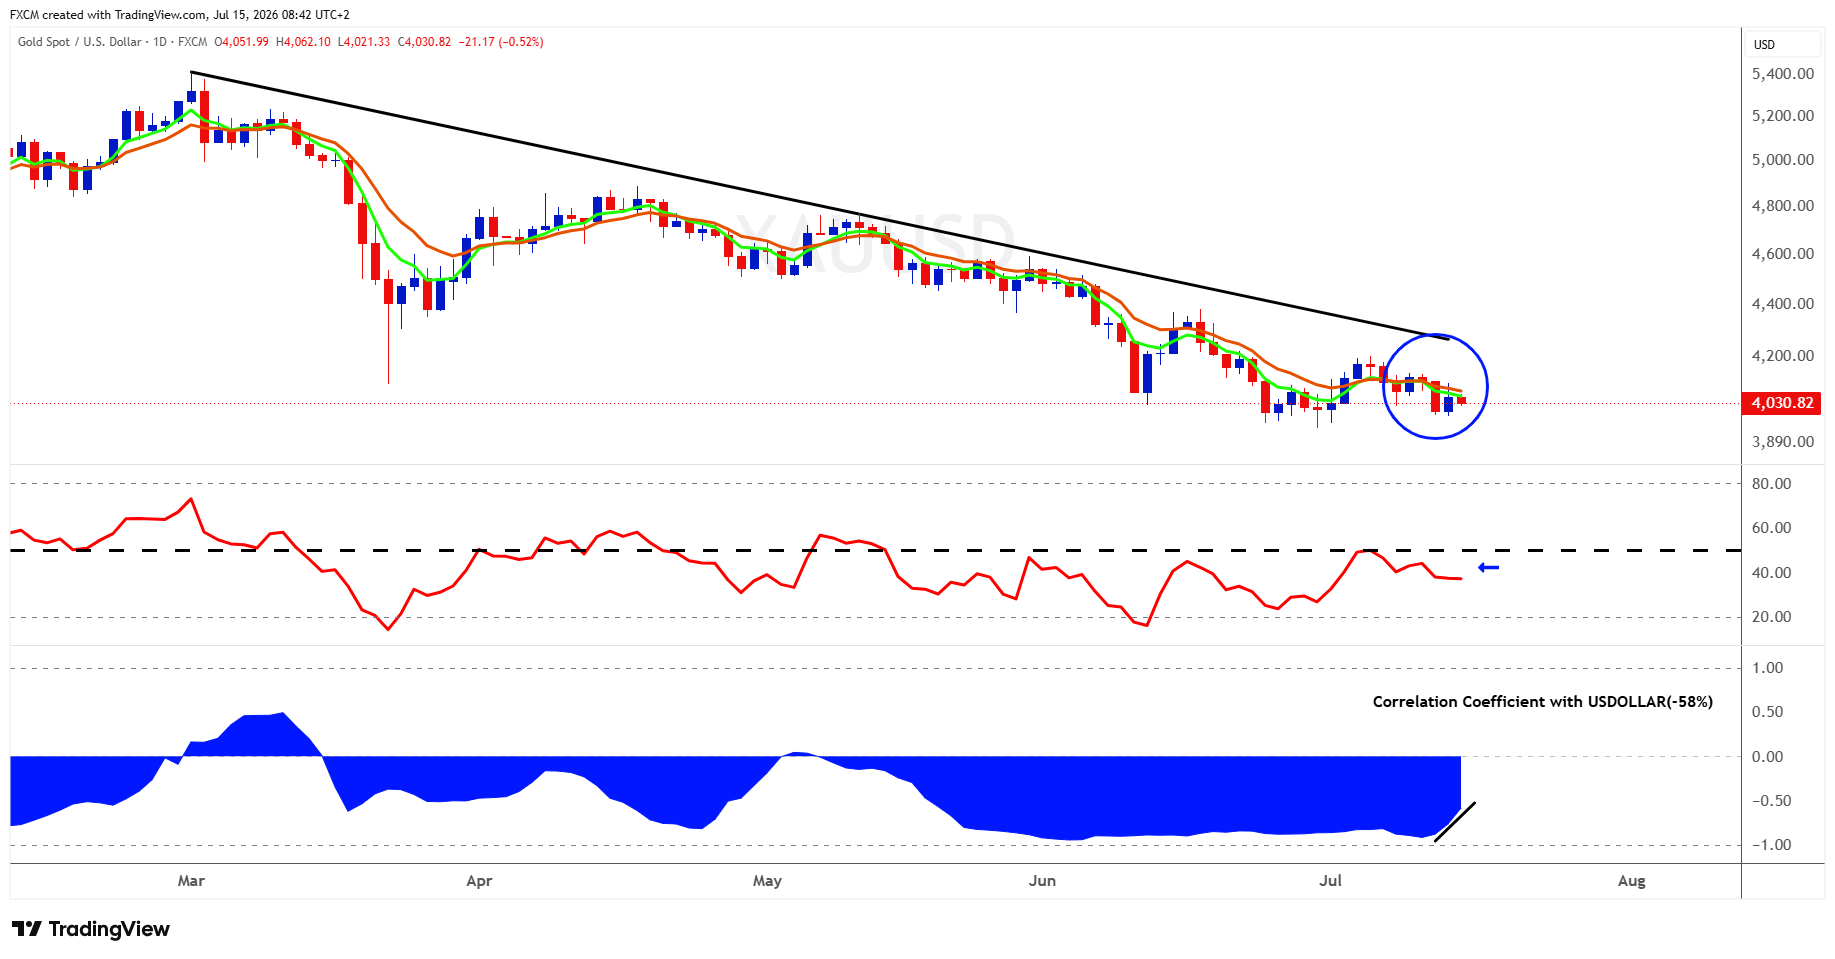
XAUUSD remains technically fragile despite the recent weakening in the USDOLLAR. Price is still trapped beneath a well-defined descending trendline, both moving averages are rolling lower, and the latest rebound has stalled around the 4,190 area before slipping back towards $4,030. RSI remains below 50, confirming that sellers still control momentum without the market yet being deeply oversold. The most striking feature is gold's failure to rally even as its correlation with USDOLLAR remains meaningfully negative at roughly -58%, a sign that internal demand for bullion is currently weak. A decisive break below $4,000 would expose the March-area support near $3,900, while bulls need to reclaim $4,100 and then break the falling trendline around $4,200-$4,250 before the broader downtrend can be considered under serious threat.
Fundamental Perspective
Gold is caught between cooling US inflation and a renewed energy-price shock. June CPI fell 0.4% and slowed to 3.5% annually, weakening the dollar, reducing near-term Fed tightening expectations and briefly lifting bullion above $4,100. However, escalating US-Iran tensions, the blockade of Iranian ports and reduced traffic through the Strait of Hormuz have driven oil higher, reviving fears that energy costs could keep inflation and interest rates elevated. Fed Chair Kevin Warsh added to the uncertainty by warning against treating one favourable CPI report as "mission accomplished." As a result, the accompanying rate expectations is limiting the appeal of the non-yielding metal.
Considering Copper
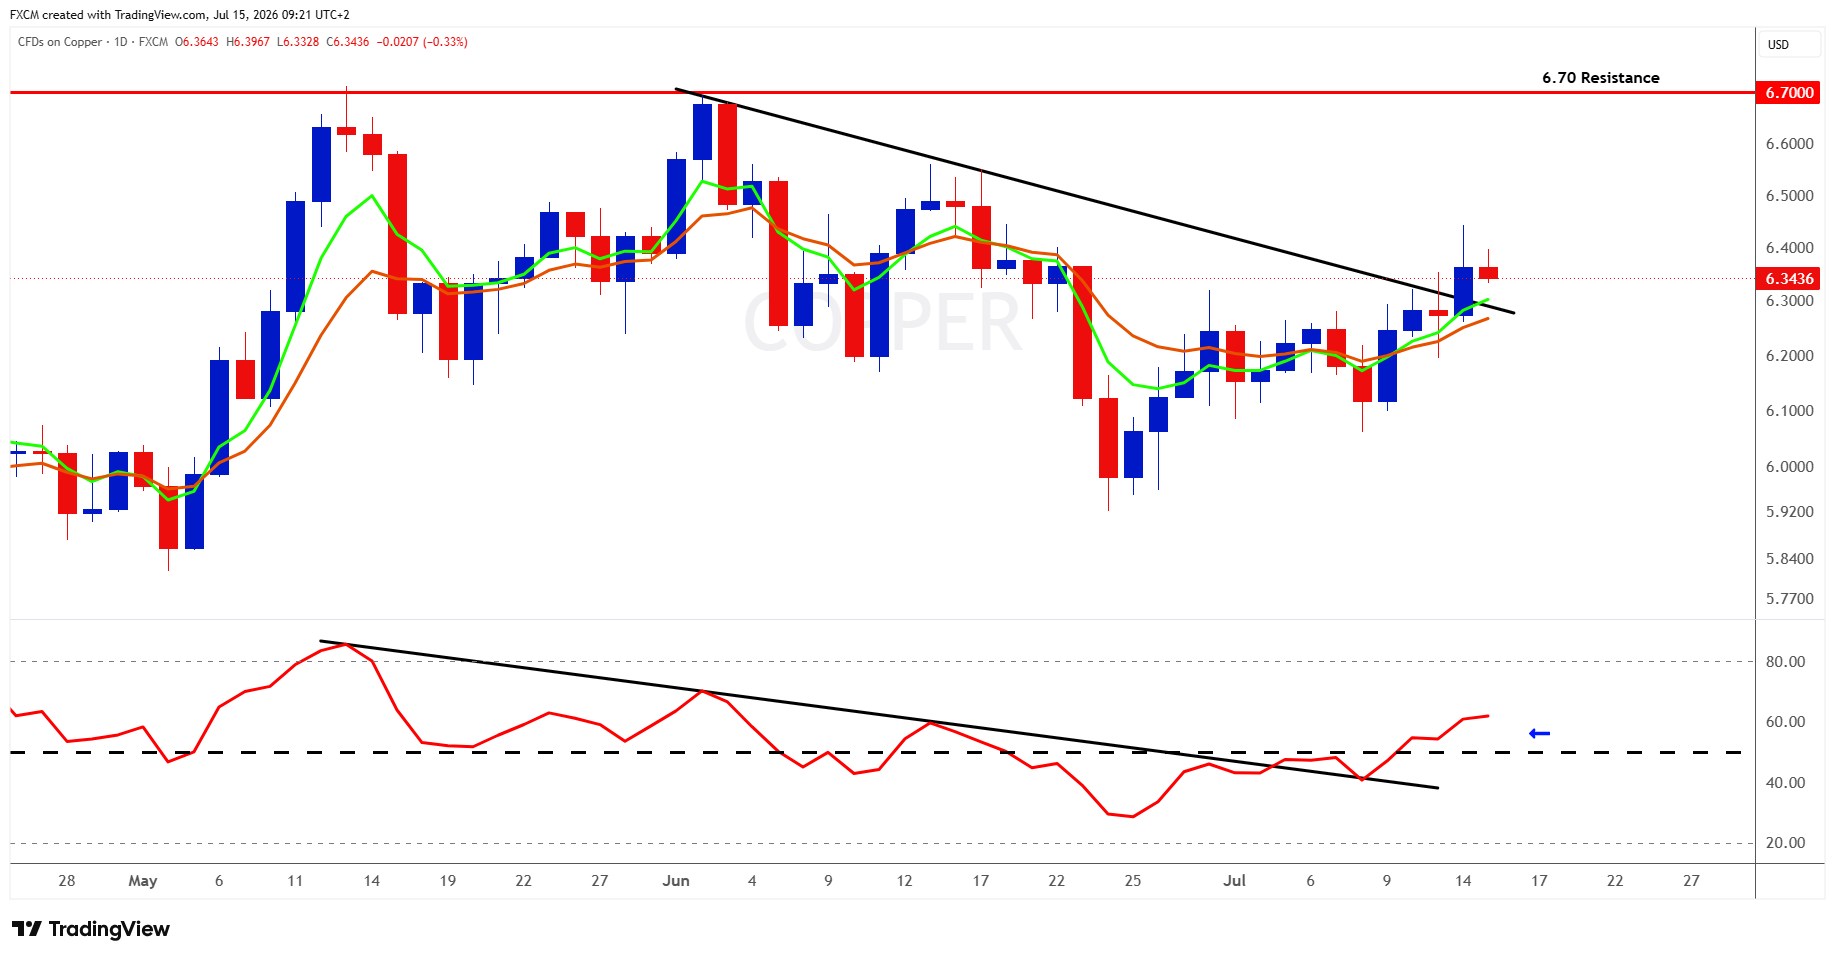
Copper is turning technically constructive, with price breaking above its descending trendline, the short-term EMAs crossing bullishly and RSI pushing above 50. Holding the $6.30 breakout area would preserve the improving momentum and bring major resistance at $6.70 back into play. The weaker dollar following softer US inflation is providing support, while constrained concentrate supply and long-term demand from power grids, electrification and AI infrastructure strengthen the broader investment case. Yet "Dr Copper" is still sending a qualified economic signal: Chinese growth slowed to 4.3% in the second quarter and the property sector remains weak, even as industrial production proved more resilient. With Hormuz tensions also raising energy and manufacturing costs, copper's next move will test whether improving technical momentum can overcome lingering doubts about global demand.
Index in Focus: JPN225
Technical Analysis
JPN225 appears to be in the midst of a bullish flag, with the recent descending channel forming after the strong advance from the May lows. Price is now pressing towards the upper boundary of the pattern near 69,000, while RSI has already broken above its own downtrend line; a sustained move above 50 would confirm that underlying momentum is turning positive. The short-term EMAs are also beginning to converge, and a bullish crossover would strengthen the case that the flag is nearing completion. A decisive close above the channel and the 69,000-70,000 resistance area would validate the breakout and bring the June high near 73,000 back into focus. Failure to break higher, however, would leave the index vulnerable to another rotation towards 67,000, with the lower channel boundary near 64,000 representing the more important support zone.
Fundamental Perspective
JPN225 is being pulled between an improving global risk backdrop and mounting domestic cost pressures. Today's rebound followed unexpectedly soft US inflation, which lowered Treasury yields, reduced expectations for near-term Fed tightening and supported technology shares, important for an index whose record second-quarter advance was helped substantially by AI and semiconductor-related companies.
The yen's position near four-decade lows remains supportive for exporters' overseas earnings, but it is increasingly double-edged: Japanese wholesale inflation accelerated to 7.1% in June as the weak currency and elevated commodity costs raised import prices. Further disruption around the Strait of Hormuz could intensify those pressures, keeping the BOJ alert to additional tightening even as expensive energy threatens economic growth. The bullish case therefore depends on softer US rates and renewed technology strength outweighing energy costs, further BOJ tightening and the risk of official action to support the yen.

Russell Shor
Senior Market Strategist
Russell Shor is a Senior Market Strategist at FXCM, having been promoted to the role in 2025 in recognition of his depth of insight and consistent delivery of high-impact market analysis. He originally joined FXCM in October 2017 as a Senior Market Specialist.
Russell holds an Honours Degree in Economics from the University of South Africa, is a certified FMVA®, and a full member of the Society of Technical Analysts (UK). With over 20 years of experience in financial markets, his work is renowned for its clarity, precision, and strategic value across asset classes.


Any opinions, news, research, analyses, prices, other information, or links to third-party sites contained on this website are provided on an "as-is" basis, as general market commentary and do not constitute investment advice. The market commentary has not been prepared in accordance with legal requirements designed to promote the independence of investment research, and it is therefore not subject to any prohibition on dealing ahead of dissemination. Although this commentary is not produced by an independent source, FXCM takes all sufficient steps to eliminate or prevent any conflicts of interests arising out of the production and dissemination of this communication. The employees of FXCM commit to acting in the clients' best interests and represent their views without misleading, deceiving, or otherwise impairing the clients' ability to make informed investment decisions. For more information about the FXCM's internal organizational and administrative arrangements for the prevention of conflicts, please refer to the Firms' Managing Conflicts Policy. Please ensure that you read and understand our Full Disclaimer and Liability provision concerning the foregoing Information, which can be accessed here.