
Is the US2000 Trying to Tell Us Something?


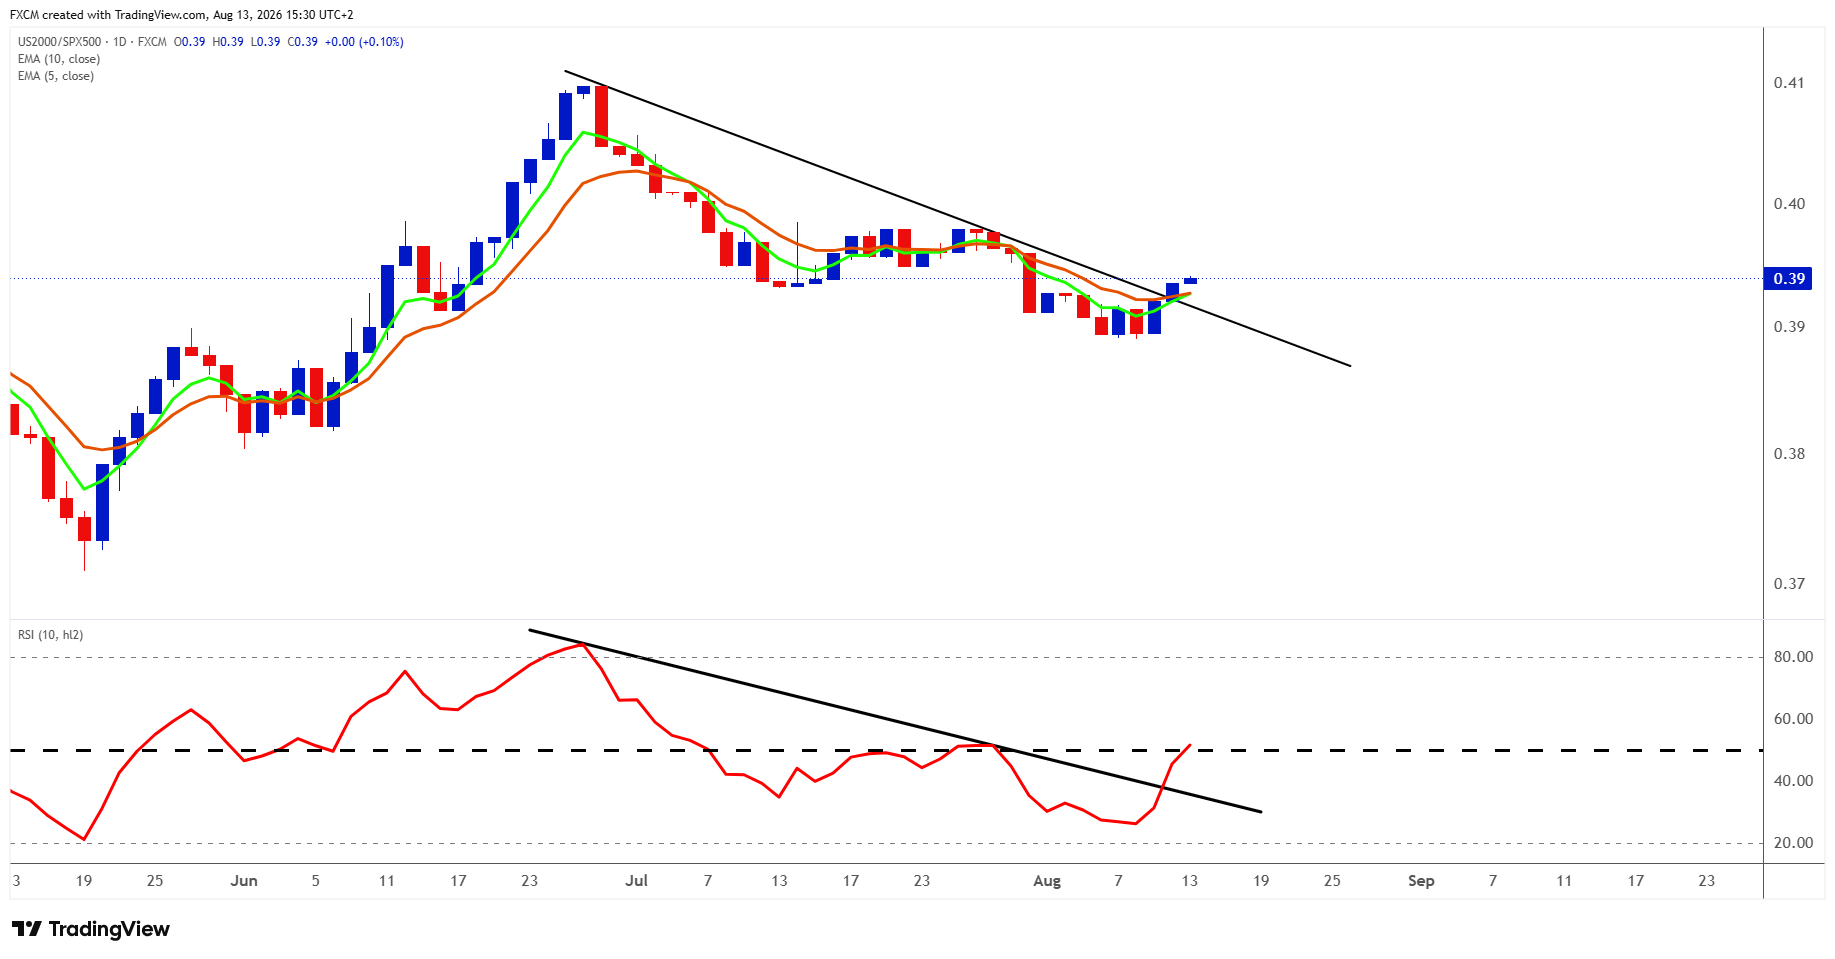
For much of the recent US equity rally, investors have become used to looking in the same direction. Mega-cap companies have dominated the headlines, AI has driven much of the excitement and the SPX500 has become unusually concentrated in a relatively small group of enormous stocks. But beneath the surface, another development is starting to look interesting. The US2000, which tracks US small-cap shares, is showing the first signs of improving relative strength against the SPX500.
That matters because the US2000 can sometimes tell us something that the headline index cannot. It gives us a better sense of what is happening further down the market-cap spectrum, where companies are generally more domestically focused and more sensitive to the condition of the US economy.
The chart is beginning to change
Technically, we are not looking at a confirmed reversal yet, but the picture is improving.
The US2000/SPX500 ratio has trended lower since its late-June peak as small caps continued underperforming their larger peers. That decline is now losing momentum: the ratio is breaking above its descending trendline, and the five-day EMA has turned higher, looking to cross bullishly above the ten-day EMA.
The momentum picture is arguably more interesting. The RSI has already broken above its own declining trendline and recovered towards the neutral 50 level. Momentum can improve before the price trend itself fully turns, so that is an encouraging early sign rather than proof that the trend has changed.
The important test now sits around the 0.39 area on the ratio. A sustained move through that level would break the recent sequence of lower highs and provide much stronger evidence that the Russell is beginning to outperform rather than simply enjoying another temporary bounce.
In other words, the chart is whispering something interesting. It has not started shouting yet.
Why small-cap leadership would matter
A sustained turn in US2000 relative strength could carry an important fundamental message.
Small-cap companies are much more closely tied to the US domestic economy than their larger counterparts. FTSE Russell estimates that only around 15-20% of US2000 revenues are generated outside the US. If investors begin favouring small caps, it can therefore reflect greater confidence in US demand, earnings growth and the broader domestic economic outlook.
Small caps are also more exposed to changes in financial conditions. They have relatively greater exposure to floating-rate debt, making financing costs more responsive to changes in interest rates. That does not mean US2000 outperformance automatically tells us that the Federal Reserve is about to cut rates, or that credit conditions have suddenly become easy. Small caps can outperform for several reasons, including stronger growth, improving earnings expectations, attractive valuations or investors simply rotating away from expensive large-cap winners.
That distinction is important. The relative strength here is a signal, not a crystal ball.
Perhaps the most interesting implication would be for market breadth. The SPX500 has become unusually concentrated, meaning strong headline index performance can look very different from the experience of the average stock underneath it. If the US2000 begins to outperform sustainably, it would suggest that leadership is spreading further down the market-cap spectrum.
That would make the rally broader and less concentrated.
There is still a long way to go before we can say that has happened. The relative trend has not yet decisively broken, and the 0.39 resistance area still needs to be cleared. But the combination of improving momentum, a challenge to the downtrend and the fundamental significance of stronger small-cap participation makes this one of the more interesting charts to watch.
Sometimes the most useful market signal is not whether the SPX500 is going higher.
It is who is finally starting to catch up.

Russell Shor
Senior Market Strategist
Russell Shor is a Senior Market Strategist at FXCM, having been promoted to the role in 2025 in recognition of his depth of insight and consistent delivery of high-impact market analysis. He originally joined FXCM in October 2017 as a Senior Market Specialist.
Russell holds an Honours Degree in Economics from the University of South Africa, is a certified FMVA®, and a full member of the Society of Technical Analysts (UK). With over 20 years of experience in financial markets, his work is renowned for its clarity, precision, and strategic value across asset classes.

Any opinions, news, research, analyses, prices, other information, or links to third-party sites contained on this website are provided on an "as-is" basis, as general market commentary and do not constitute investment advice. The market commentary has not been prepared in accordance with legal requirements designed to promote the independence of investment research, and it is therefore not subject to any prohibition on dealing ahead of dissemination. Although this commentary is not produced by an independent source, FXCM takes all sufficient steps to eliminate or prevent any conflicts of interests arising out of the production and dissemination of this communication. The employees of FXCM commit to acting in the clients' best interests and represent their views without misleading, deceiving, or otherwise impairing the clients' ability to make informed investment decisions. For more information about the FXCM's internal organizational and administrative arrangements for the prevention of conflicts, please refer to the Firms' Managing Conflicts Policy. Please ensure that you read and understand our Full Disclaimer and Liability provision concerning the foregoing Information, which can be accessed here.