International equities are outperforming US equities

Source: www.tradingview.com
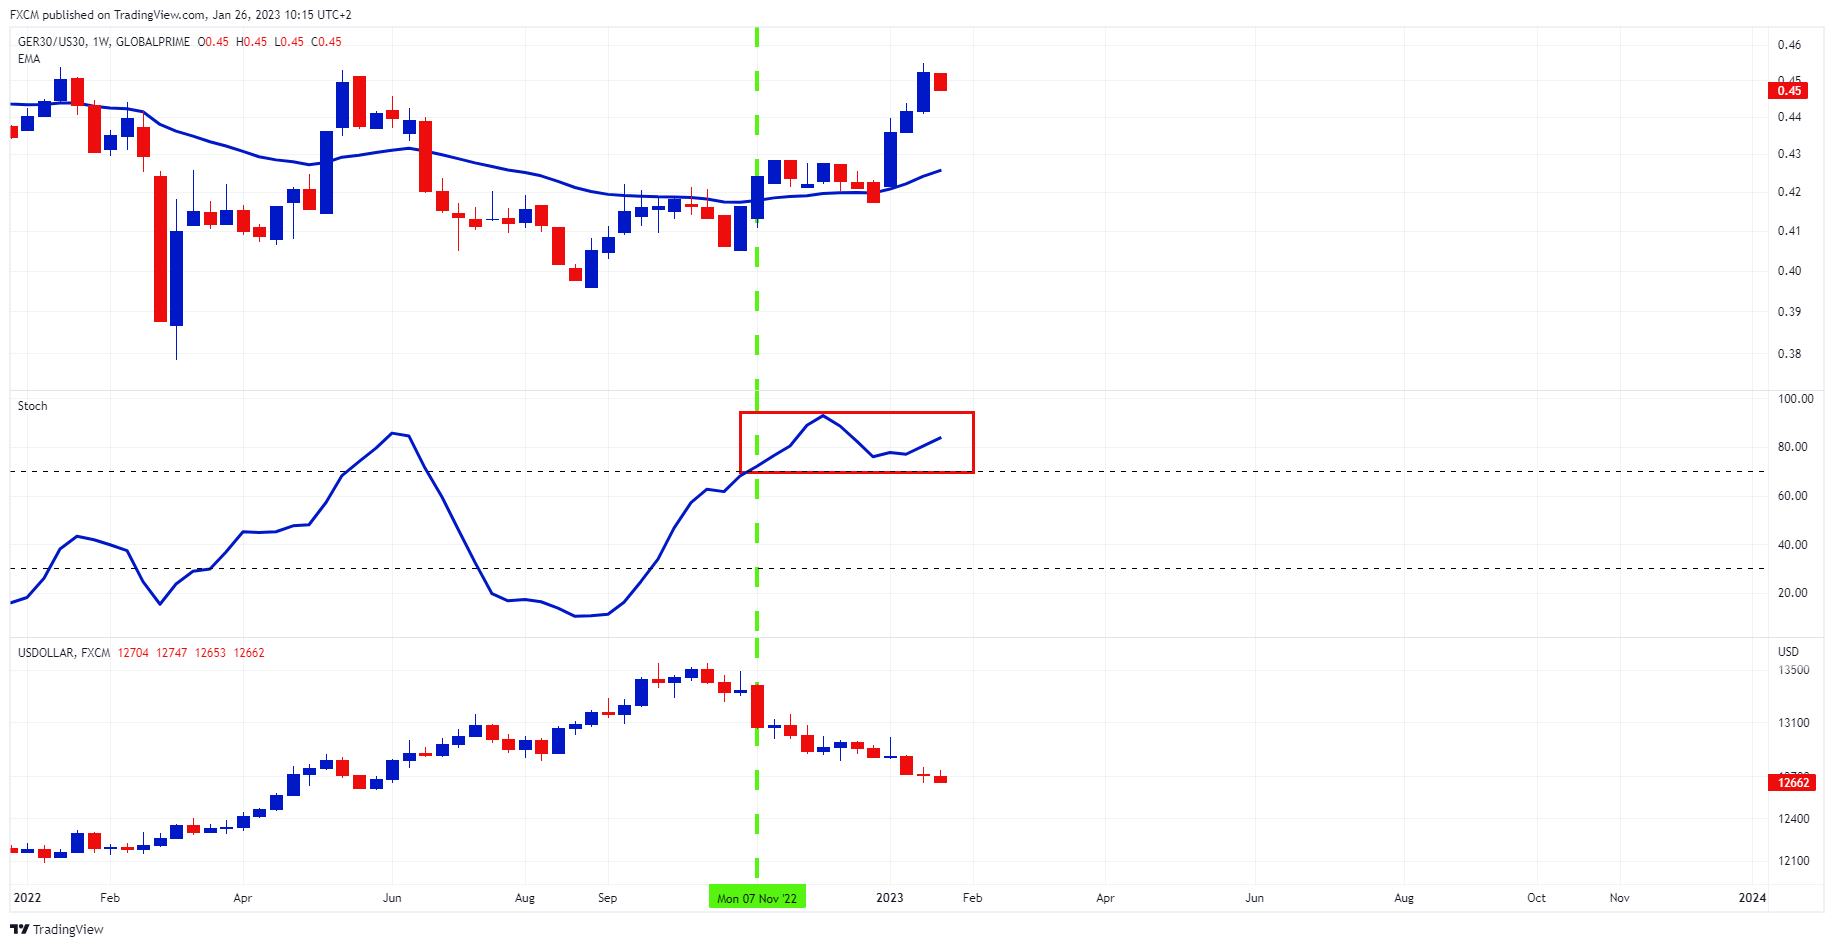
International stocks are performing better than their US counterparts. This outperformance has been since Q4 last year. In this article, we use GER30 as a proxy for international equities and refer to the US30, the best performing US large-cap index.
The top chart shows the relative strength (RS) between the GER30 and the US30. RS is above its 30-week exponential moving average (EMA), and the EMA has turned up in trend confirmation.
The middle chart shows the RS's stochastic, a measure of momentum. It is in its upper quintile and holding (red rectangle). I.e., there is an underlying momentum that is accompanying the RS. The longer this maintains, the more probable that international equities continue to outperform US equities.
The bottom chart shows the USDOLLAR, which is regarded as a haven. As the greenback broke down during the week of Mon, 7 Nov, the GER30 outperformed. This is because money was reallocated to international markets, as money retreated from the safety of the greenback, seeking value in risk markets.
The lower dollar supports companies that derive revenues outside the US.
Russell Shor
Senior Market Strategist
Russell Shor is a Senior Market Strategist at FXCM, having been promoted to the role in 2025 in recognition of his depth of insight and consistent delivery of high-impact market analysis. He originally joined FXCM in October 2017 as a Senior Market Specialist.
Russell holds an Honours Degree in Economics from the University of South Africa, is a certified FMVA®, and a full member of the Society of Technical Analysts (UK). With over 20 years of experience in financial markets, his work is renowned for its clarity, precision, and strategic value across asset classes.
Any opinions, news, research, analyses, prices, other information, or links to third-party sites contained on this website are provided on an "as-is" basis, as general market commentary and do not constitute investment advice. The market commentary has not been prepared in accordance with legal requirements designed to promote the independence of investment research, and it is therefore not subject to any prohibition on dealing ahead of dissemination. Although this commentary is not produced by an independent source, FXCM takes all sufficient steps to eliminate or prevent any conflicts of interests arising out of the production and dissemination of this communication. The employees of FXCM commit to acting in the clients' best interests and represent their views without misleading, deceiving, or otherwise impairing the clients' ability to make informed investment decisions. For more information about the FXCM's internal organizational and administrative arrangements for the prevention of conflicts, please refer to the Firms' Managing Conflicts Policy. Please ensure that you read and understand our Full Disclaimer and Liability provision concerning the foregoing Information, which can be accessed here.