
AlphaTrack – SPX500 bulls face a critical test


Thoughtful insights and approachable analysis.
- JPMorgan tests critical $325 support ahead of earnings. Could strong results spark a bullish turnaround?
- Citigroup's bullish momentum is building ahead of earnings. Could strong results ignite a sustained rally?
- Wells Fargo's recovery gathers pace ahead of earnings. Could strong results trigger a breakout above $85?
Quick Market Overview
US stocks were mixed as investors positioned cautiously ahead of a crucial third-quarter earnings season, with technology shares leading the weakness. The key issue for markets is whether earnings can justify current valuations, with S&P 500 profits expected to rise nearly 30% and estimates having been revised higher. Strong results could help offset pressure from elevated bond yields, while disappointment would leave highly valued stocks vulnerable. For investors, earnings quality, forward guidance and the durability of AI-related spending are likely to matter more than the headline numbers alone.
General Equity Market Health (SPX500)
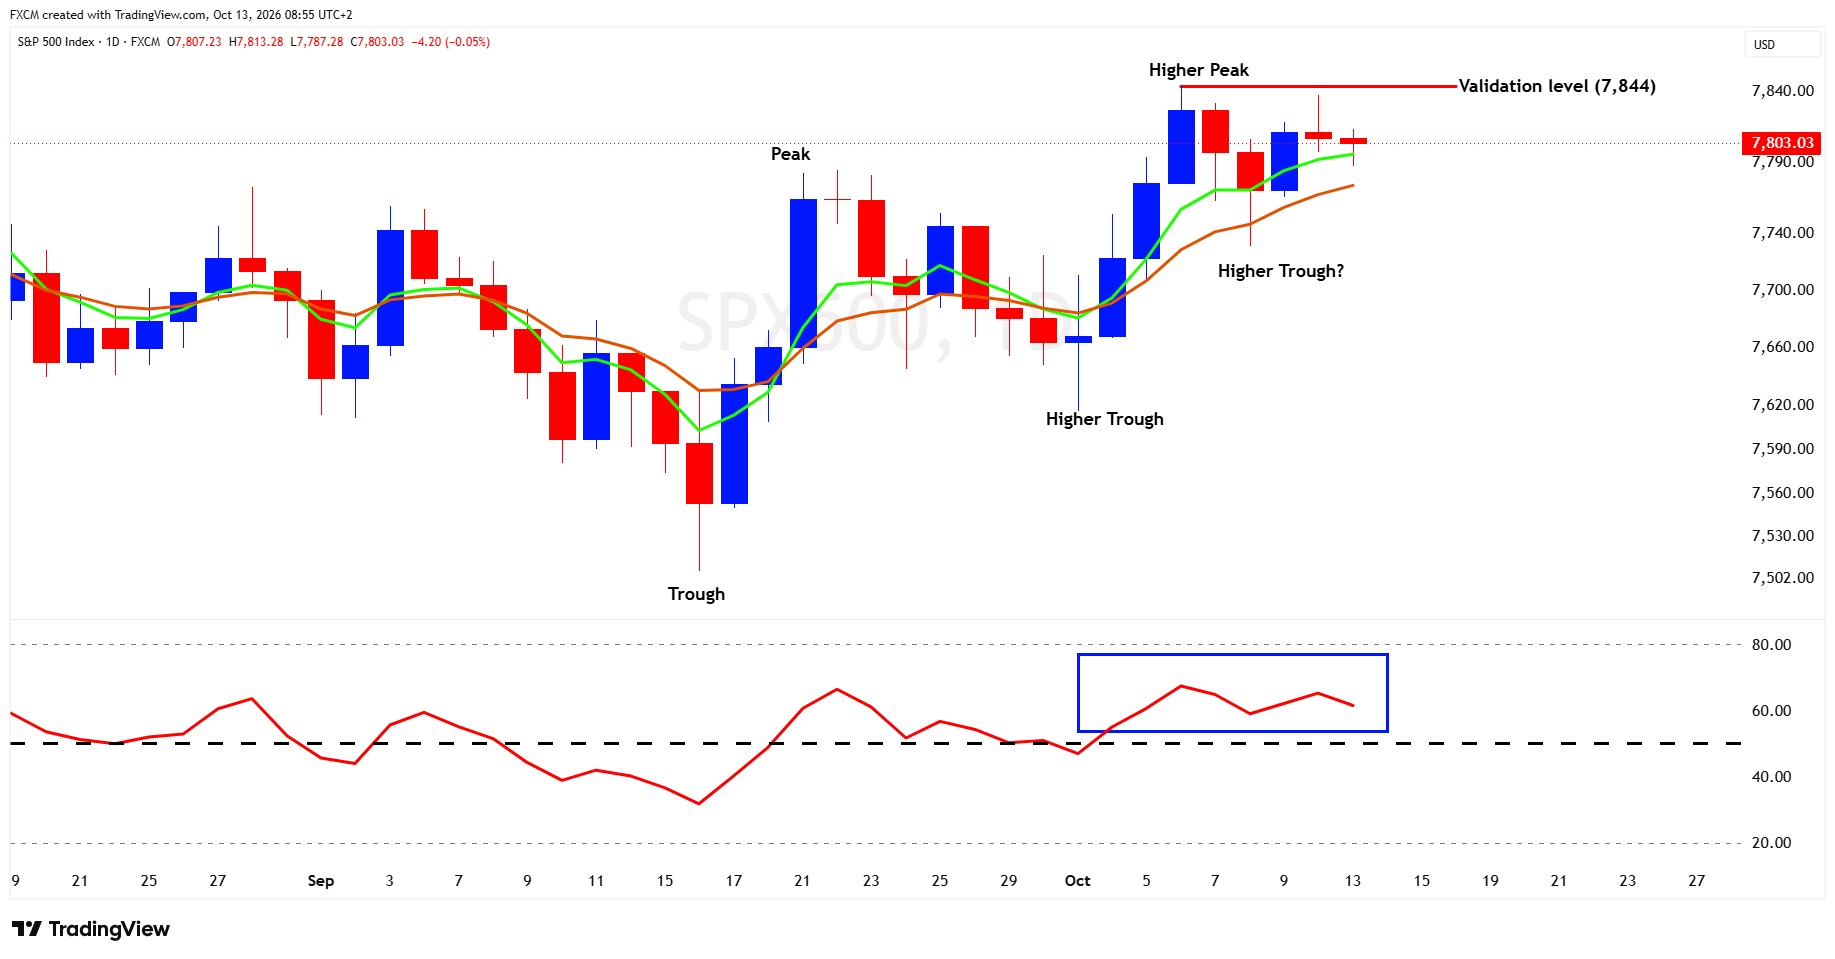
The SPX500's technical structure remains constructive, with a higher trough followed by a higher peak, suggesting that the bulls retain control of the broader trend. Attention now turns to the latest pullback, which could be laying the foundations for another higher trough. However, confirmation is still required. A decisive break above 7,844 would validate the developing pattern and strengthen the case for further upside. Momentum is also worth watching closely. The RSI has recovered above the neutral 50 level and continues to hold in bullish territory, despite some recent moderation. As long as the indicator remains above 50, the prospect of another higher trough being confirmed remains alive. For now, the market appears to be consolidating rather than reversing, with the next move potentially providing an important clue about the sustainability of the advance.
There is still plenty for the bulls to feel encouraged about, particularly with another US earnings season getting underway. S&P 500 companies are expected to deliver third-quarter earnings growth of around 30% year on year, helped by continued strength in technology and spending on artificial intelligence. That is an impressive number, but investors have other things to worry about. September's employment report showed just 29,000 jobs added, well below the 90,000 expected.
While the weaker figure has strengthened expectations that the Federal Reserve will leave interest rates unchanged in October, it also raises questions about the underlying health of the economy. Inflation is another concern, with Brent crude above $106 a barrel and the US 10-year Treasury yield recently reaching 5.24%. There is also the question of market breadth, with more than 40% of S&P 500 constituents in negative territory for the year, despite the index's strong performance.
This leaves quite a bit riding on the earnings season and this week's inflation figures. If companies deliver on expectations and inflation shows signs of easing, the bulls may have enough ammunition to extend the rally. That would fit neatly with the improving technical picture, where a break above 7,844 would confirm the developing higher trough and strengthen the case for further gains.
Potential Trade Setups
With the US banking earnings season getting underway, JPMorgan Chase, Citigroup and Wells Fargo are presenting some interesting potential trade setups. All three have experienced selling pressure in recent weeks, but emerging signs of improving momentum suggest the technical picture may be starting to shift. With earnings announcements providing a possible catalyst, key support and resistance levels could soon come into play. The question now is whether the bulls can build on these early signals or whether the recent weakness has further to run.
JPMorgan Chase & Co. (JPM.us)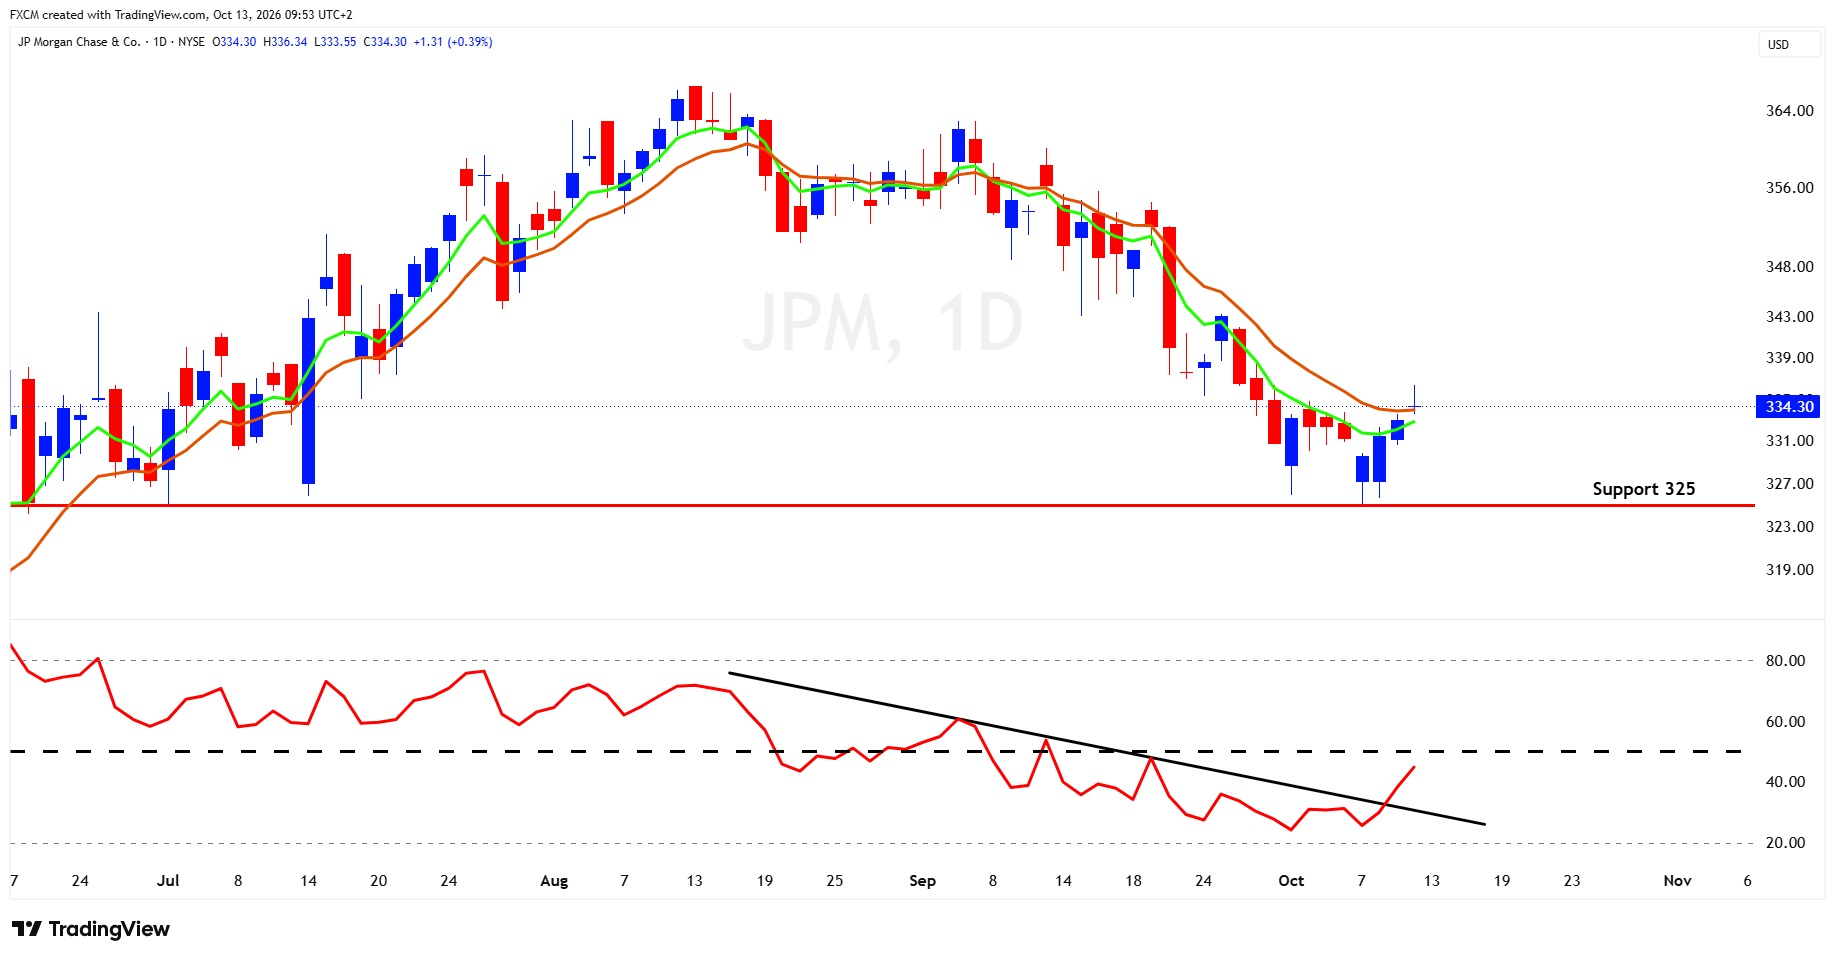
Technical Analysis
JPMorgan Chase has come under considerable selling pressure since its August peak, with a succession of lower highs and lower lows pointing to a weakening technical picture. However, buyers have recently emerged around the $325 support level, raising the possibility that the share price is attempting to establish a base. There are also some encouraging signs from momentum. The RSI has broken above its descending trendline, suggesting that bearish momentum may be losing its grip. Nevertheless, the indicator remains below the neutral 50 level, and a sustained move above this threshold would be needed to signal a more convincing shift towards positive momentum. For now, the recovery remains tentative, with the share price still needing to overcome overhead resistance around $336 and the declining longer moving average. Holding above $325 would keep the prospect of a recovery alive, while a decisive break below this level would suggest that sellers remain firmly in control.
Fundamental Perspective
JPMorgan faces an important test today as it releases its third-quarter earnings. Wall Street is expecting a strong performance, with analysts forecasting earnings of $5.93 per share on revenue of $51.23 billion. However, expectations have been rising ahead of the announcement, leaving the bank with a fairly high bar to clear. Much of the attention will be on net interest income, particularly how higher interest rates are affecting lending margins, deposit costs and demand for credit. Investors will also be watching loan-loss provisions for signs that consumers and businesses are coming under greater financial pressure. Trading and investment banking revenues should provide another interesting talking point, although the market will want to know whether recent strength in these businesses can be sustained. Perhaps most importantly, management's outlook for the coming quarters could determine how investors respond. A solid earnings beat may not be enough if it comes alongside weaker guidance or rising credit costs. On the other hand, strong results and reassuring commentary could give buyers the confidence to return, particularly with the share price attempting to find its feet around the $325 support level. For JPMorgan, today's announcement may help determine whether the recent weakness represents a buying opportunity or the beginning of a more prolonged correction.
Citigroup Inc. (C.us)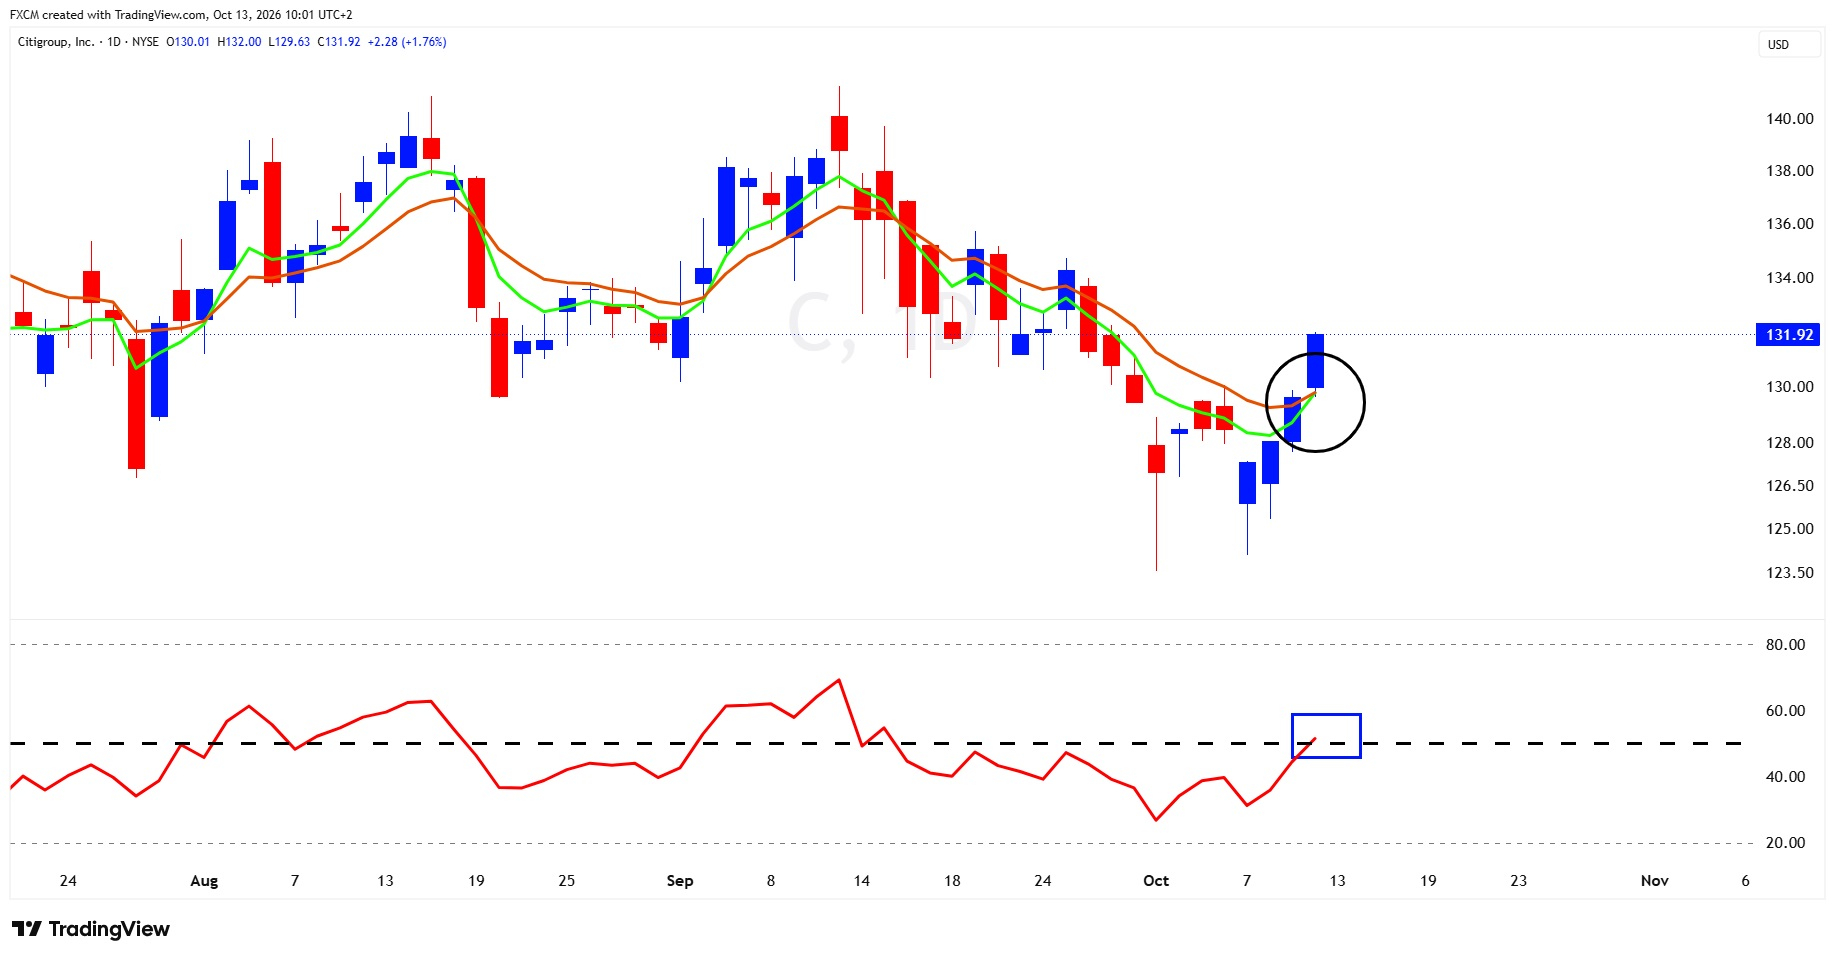
Technical Analysis
Citigroup is showing some encouraging signs of recovery after coming under sustained selling pressure since its September peak. The recent rebound from the $124–$126 area has gathered momentum, with the share price climbing back towards $132 and challenging its short-term moving averages. Of particular interest is the RSI, which is attempting to push above the neutral 50 level. This is a positive development, suggesting that buying momentum is beginning to improve, although the real test will be whether the indicator can establish itself above 50 and remain there. The exponential moving averages are also approaching a potential bullish crossover, but the signal would carry greater weight if the averages began to turn higher and separate, rather than simply crossing during a temporary rebound. Nevertheless, the broader pattern of lower highs has yet to be broken, leaving resistance around $134–$135 as an important area to watch. A sustained move above this region would strengthen the recovery argument, while a retreat below $128 could put the recent lows back into focus. For now, the technical picture is improving, but the bulls still have work to do.
Fundamental Perspective
Citigroup will be hoping to give investors something to cheer about when it reports third-quarter earnings today. Wall Street is looking for a strong showing, with analysts forecasting earnings of $2.65 per share on revenue of $23.72 billion. That would represent solid growth from a year earlier, but the headline numbers are only part of the story. Investors will be watching net interest income closely, particularly how higher borrowing costs, deposit competition and demand for loans are affecting the business. Trading and investment banking revenues will also be in focus, especially with concerns that activity across Wall Street may be losing some momentum. Perhaps the bigger question, though, is whether Citi's efforts to simplify its operations are finally delivering the improvement in profitability that shareholders have been waiting for. Expenses remain an important part of that equation, as does the bank's ability to keep credit losses under control. Management's guidance could prove particularly influential. After all, beating earnings expectations is one thing, but convincing investors that stronger profits can be sustained is quite another. With Citi's shares showing early signs of a technical recovery, encouraging results and a confident outlook could provide the spark for further gains. Any disappointment on costs, credit quality or future profitability, however, could quickly take the shine off the recent rebound.
Wells Fargo & Company (WFC.us)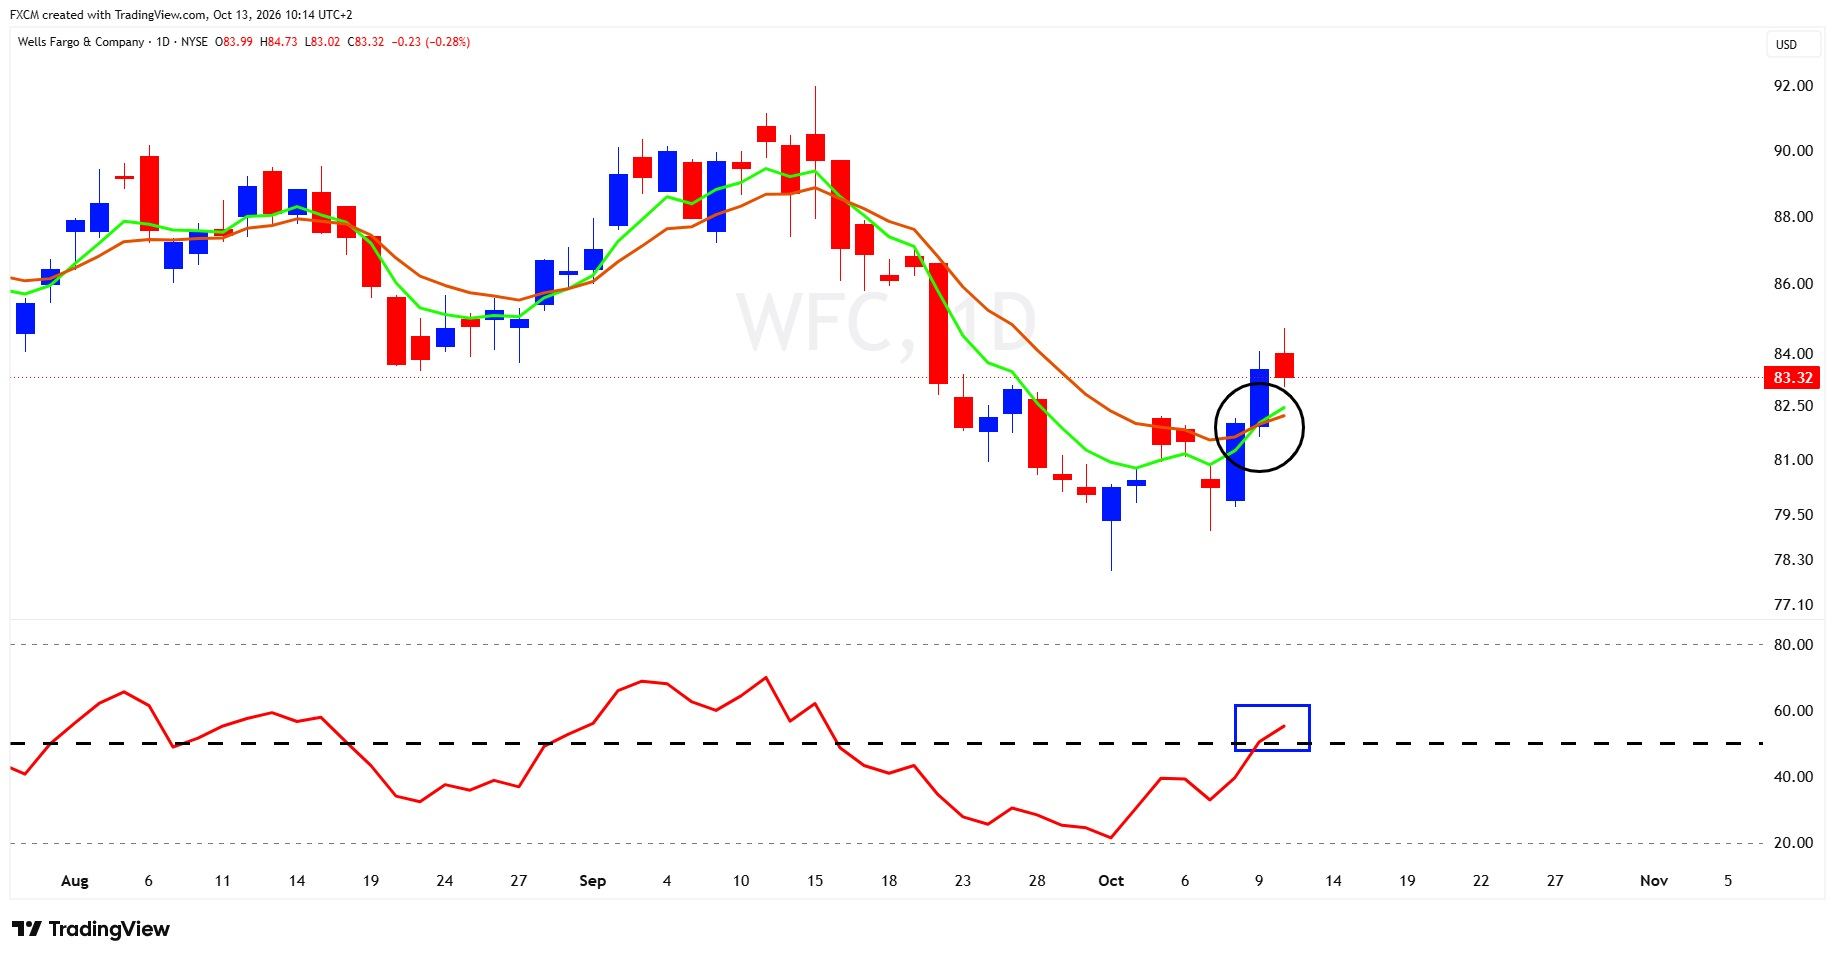
Technical Analysis
Wells Fargo is showing encouraging signs of recovery after a difficult September saw its share price retreat from around $91 to below $80. Buyers have since returned, lifting the stock back above $83 and raising the possibility that the recent sell-off is beginning to lose momentum. One of the more positive developments is the RSI's move above the neutral 50 level, suggesting that buying momentum is starting to gain traction. The key now is for the indicator to hold above this threshold, which would help lay the groundwork for further gains. The exponential moving averages have also moved into a tentative bullish formation, although a steeper upward angle and greater separation between the averages would provide more convincing evidence of an improving trend. Resistance around $84–$85 presents the next challenge, with a sustained break above this area potentially opening the way towards $86–$88. On the downside, the $81–$82 region offers near-term support, followed by the recent lows around $78–$80. For now, the technical picture is improving, but the recovery remains in its early stages and will need further confirmation before a more durable bullish reversal can be established.
Fundamental Perspective
Wells Fargo has a chance to give investors some much-needed encouragement when it reports third-quarter earnings today. Wall Street is expecting earnings of around $1.84–$1.85 per share on revenue of $22.31 billion, but the real interest will be in what sits behind those numbers. Lending has been a bright spot, with average loans growing 12% year on year in the second quarter. Investors will want to see that momentum continue, particularly if the bank can turn stronger loan demand into higher net interest income without putting too much pressure on margins. Rising Treasury yields complicate matters, as they can improve returns on lending while also pushing up funding costs. Credit quality is another area to watch, especially for signs that borrowers are finding conditions increasingly difficult. Then there is the question of expenses. Wells Fargo has been targeting approximately $50 billion in net interest income and $55.7 billion in noninterest expenses for the full year, so any changes to those forecasts could have a meaningful impact on sentiment. Ultimately, a strong earnings beat would be welcome, but what investors really want is evidence that the bank can keep growing without sacrificing profitability. Encouraging results and a confident outlook could help sustain the recent recovery in the share price, while disappointing margins, rising credit costs or weaker guidance could quickly put the sellers back in charge.
Hot News, Cold Logic
US investors are heading into a crucial earnings season with the market near record highs but increasingly dependent on strong profit growth to offset rising bond yields, oil prices and a hawkish Federal Reserve. S&P 500 earnings are expected to rise about 30%, led heavily by technology and AI-related companies, making guidance on AI returns, margins and 2027 growth especially important. With earnings momentum outside tech slowing and valuations still elevated, the key question is whether corporate profits can remain strong enough to justify current prices despite tighter financial conditions.
Final Thought
The market's biggest challenge may no longer be a shortage of growth, but how narrowly that growth is being rewarded. AI remains a powerful economic and earnings engine, yet the renewed semiconductor sell-off and weak market breadth show how little room extraordinary expectations leave for disappointment, while oil above $100 and elevated bond yields keep inflation and the cost of capital firmly in focus. The broader bull case has not been broken, but its next leg will increasingly require earnings strength to broaden beyond the same handful of AI winners.

Russell Shor
Senior Market Strategist
Russell Shor is a Senior Market Strategist at FXCM, having been promoted to the role in 2025 in recognition of his depth of insight and consistent delivery of high-impact market analysis. He originally joined FXCM in October 2017 as a Senior Market Specialist.
Russell holds an Honours Degree in Economics from the University of South Africa, is a certified FMVA®, and a full member of the Society of Technical Analysts (UK). With over 20 years of experience in financial markets, his work is renowned for its clarity, precision, and strategic value across asset classes.

Any opinions, news, research, analyses, prices, other information, or links to third-party sites contained on this website are provided on an "as-is" basis, as general market commentary and do not constitute investment advice. The market commentary has not been prepared in accordance with legal requirements designed to promote the independence of investment research, and it is therefore not subject to any prohibition on dealing ahead of dissemination. Although this commentary is not produced by an independent source, FXCM takes all sufficient steps to eliminate or prevent any conflicts of interests arising out of the production and dissemination of this communication. The employees of FXCM commit to acting in the clients' best interests and represent their views without misleading, deceiving, or otherwise impairing the clients' ability to make informed investment decisions. For more information about the FXCM's internal organizational and administrative arrangements for the prevention of conflicts, please refer to the Firms' Managing Conflicts Policy. Please ensure that you read and understand our Full Disclaimer and Liability provision concerning the foregoing Information, which can be accessed here.