AlphaTrack – Market Still looks Streched with Key Earnings This Week

Thoughtful insights and approachable analysis.
- Microsoft (MSFT.us) sets up with a bullish technical base and strong AI-driven cloud growth, but with earnings set to test whether momentum can justify a potential 20%+ upside.
- Amazon (AMZN.us) approaches earnings at highs, with AI and AWS momentum driving the case for further upside.
- Alphabet (GOOG.us) nears all-time highs into earnings, with AI and Cloud driving the next big move.
Quick Market Overview
Earnings season is accelerating, with more than a third of the S&P 500 set to report as markets hover near record highs and expectations remain elevated. Strength in the Nasdaq Composite points to renewed enthusiasm for AI-driven stocks, but the bar is high, with companies needing to beat and raise guidance to satisfy investors. Attention is shifting to forward guidance, particularly as firms begin factoring in higher input costs tied to geopolitical tensions and energy prices. With results due from Meta Platforms, Microsoft, Alphabet, Amazon and Apple, the key question is whether earnings momentum can hold up in a more uncertain macro environment.
General Equity Market Health (SPX500)
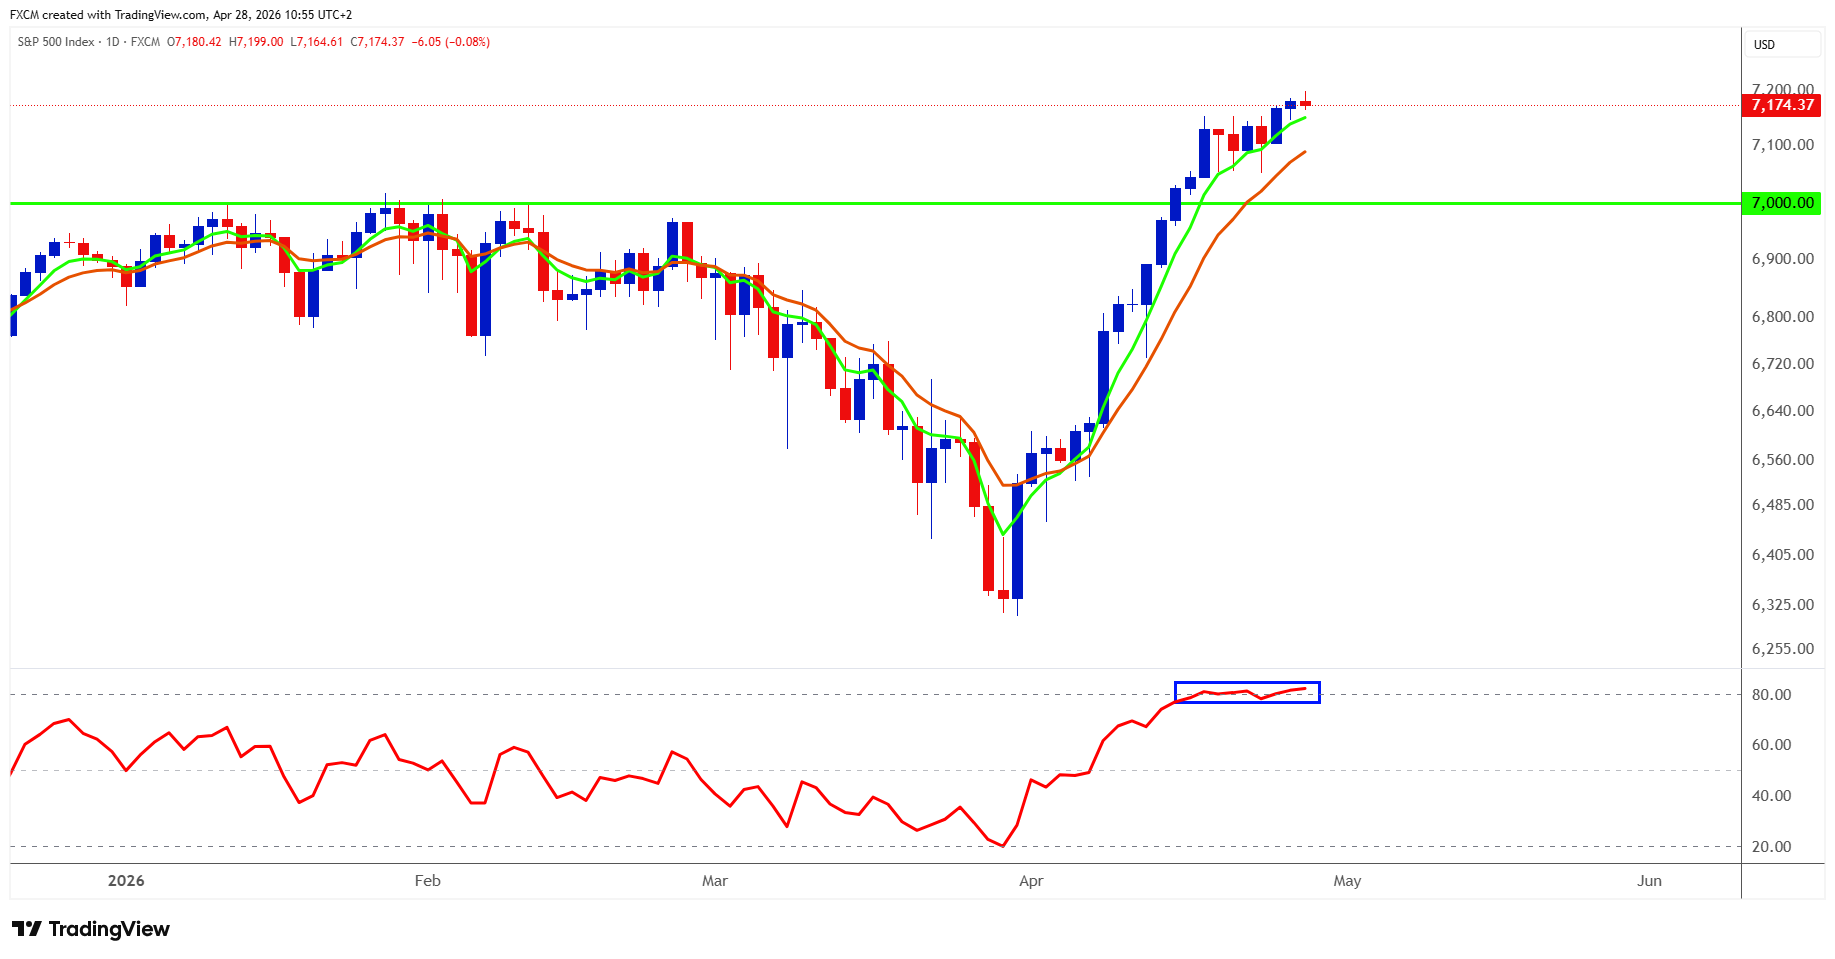
As noted in last week's AlphaTrack, the SPX500 remains in overbought territory, pointing to a potential near-term ceiling. A period of pullback or consolidation would be a natural step as the RSI resets. Big Tech has driven much of April's gains, and with key names reporting this week, the market may use earnings as an opportunity to take profits given stretched conditions. That could help normalise momentum and, if the broader trend holds, set the stage for another leg higher.
Oil remains elevated and is a clear headwind the longer it stays there, increasing the risk of demand destruction and pressure on corporate margins. However, the prevailing market view is that a broader ceasefire will materialise, meaning geopolitical risk is largely priced in unless there is a significant escalation. Against that backdrop, earnings this week become the key catalyst.
Potential Trade Setups
This is a pivotal week for earnings and could help determine whether the AI trade still has momentum. In this edition of AlphaTrack, we focus on three Big Tech names reporting this week. Two, AMZN.us and GOOG.us, are at or near all-time highs, while the third, MSFT.us, is more like a value-style opportunity. We last covered MSFT.us in the 31 March edition when it was trading around $359; it has since climbed to roughly $425, a gain of about 18%. Today, we revisit that stock from a slightly different angle.
Microsoft (MSFT.us)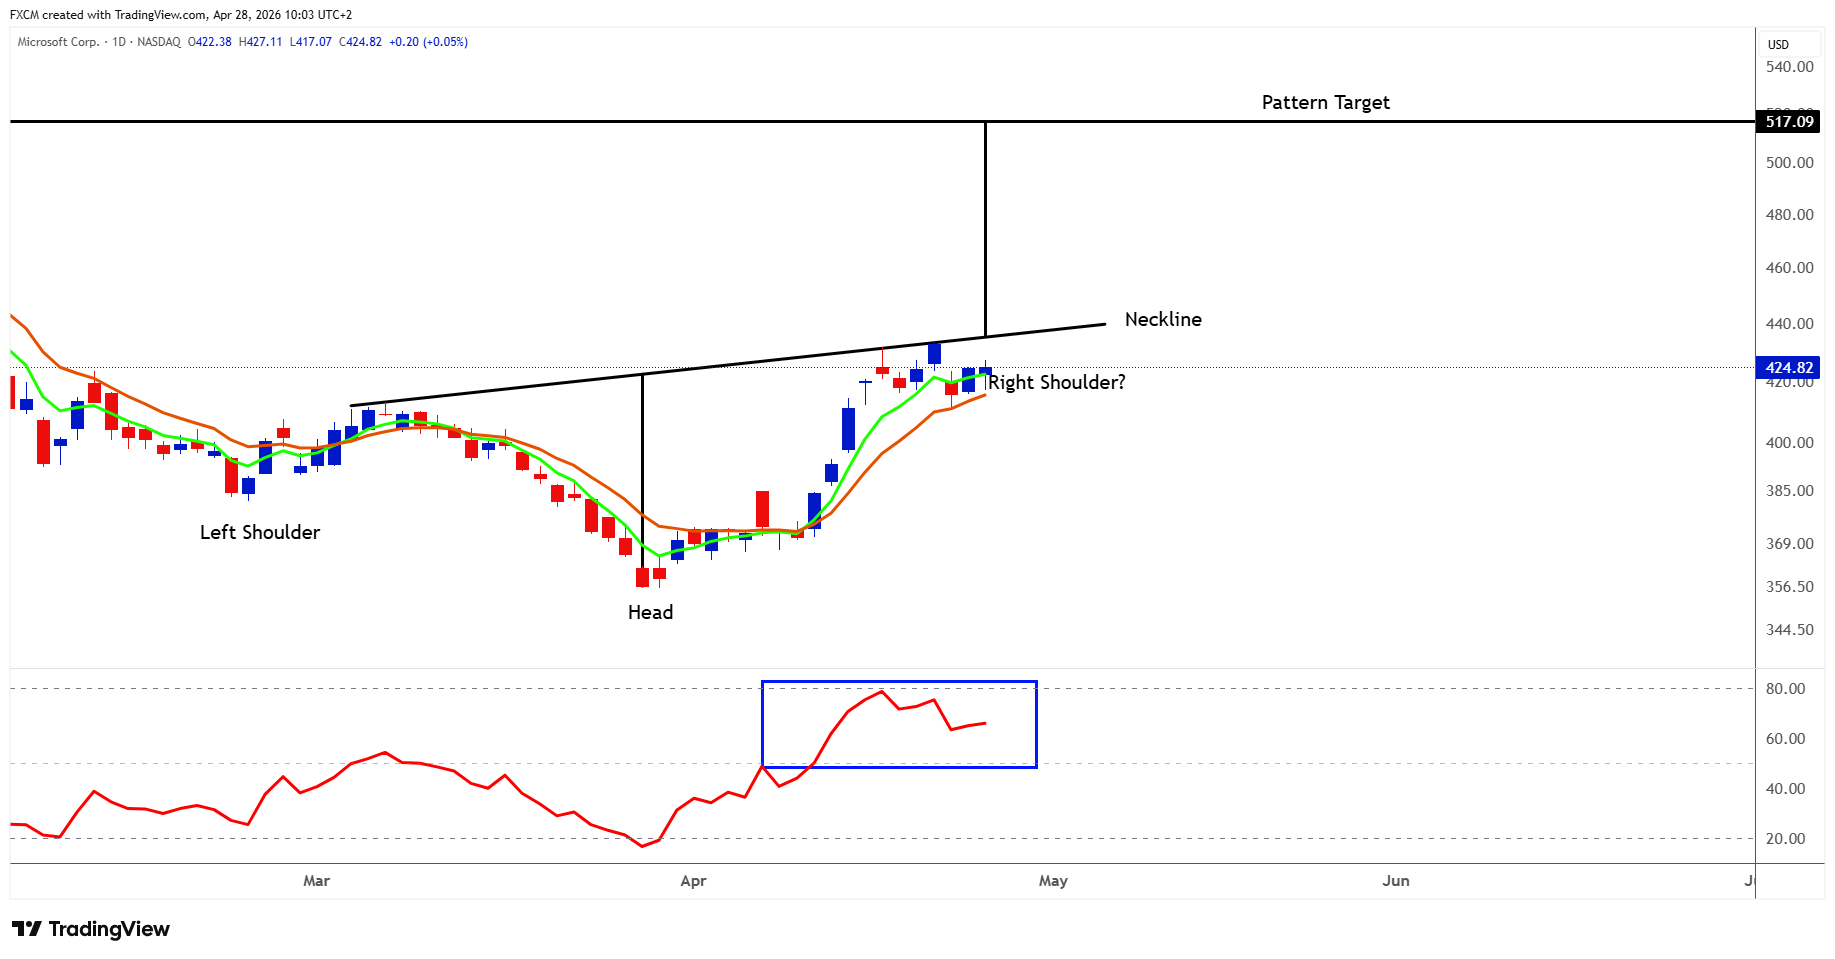
Technical Analysis
- MSFT is up close to 15% for the month and appears to be forming a bottoming pattern.
- Potentially an inverse head and shoulders.
- The right shoulder is still developing.
- The EMAs are constructive and in a bullish formation.
- The RSI is above 50 (blue rectangle).
- Holding above 50 would support positive momentum.
- The measured move from the potential pattern implies a minimum target of $517, suggesting over 21% upside.
- Measured moves are theoretical and may not be fully realised.
- Nonetheless, the setup points to a constructive bullish outlook for MSFT.
Caveat
- The right shoulder is not yet fully formed and may continue to evolve.
- Failure at the neckline would be a negative signal.
- Until the right shoulder completes, the pattern remains unconfirmed.
- A bearish EMA crossover would weaken the outlook.
- If RSI fails to hold above 50 and drops below, it would undermine the bullish case.
Fundamental Perspective
Microsoft heads into its earnings tomorrow as a high-quality AI and cloud compounder, but with a more balanced risk–reward than a straightforward bull case implies. Expectations are anchored around mid-teens growth, following a recent quarter where revenue rose roughly 17% to about $81bn and Azure expanded close to 39%.
The core of the story remains Azure, still delivering high 30% growth and supported by demand that has, at times, outstripped capacity, though investors are now watching closely for any signs of moderation. Longer term, the upside sits in AI monetisation through Copilot. Adoption is gaining traction with large enterprise rollouts, but it is still early relative to Microsoft's vast installed base, leaving both meaningful runway and execution risk.
Strategically, Microsoft's position across the AI stack has also evolved. Its partnership with OpenAI is no longer fully exclusive, enabling broader distribution while Microsoft retains access, revenue participation, and its role as a primary cloud partner. This is positive, but no longer a closed ecosystem advantage.
At the same time, rising AI capital expenditure has sharpened focus on whether spending will convert into durable revenue and margin expansion, particularly as cloud growth shows signs of easing.
Taken together, Microsoft remains one of the clearest ways to express the AI theme through a diversified, recurring-revenue model, but into earnings the stock is firmly in a "prove it" phase. Confirmation of resilient Azure growth, credible AI monetisation, and disciplined investment will be key to unlocking further upside.
Amazon.com (AMZN.us)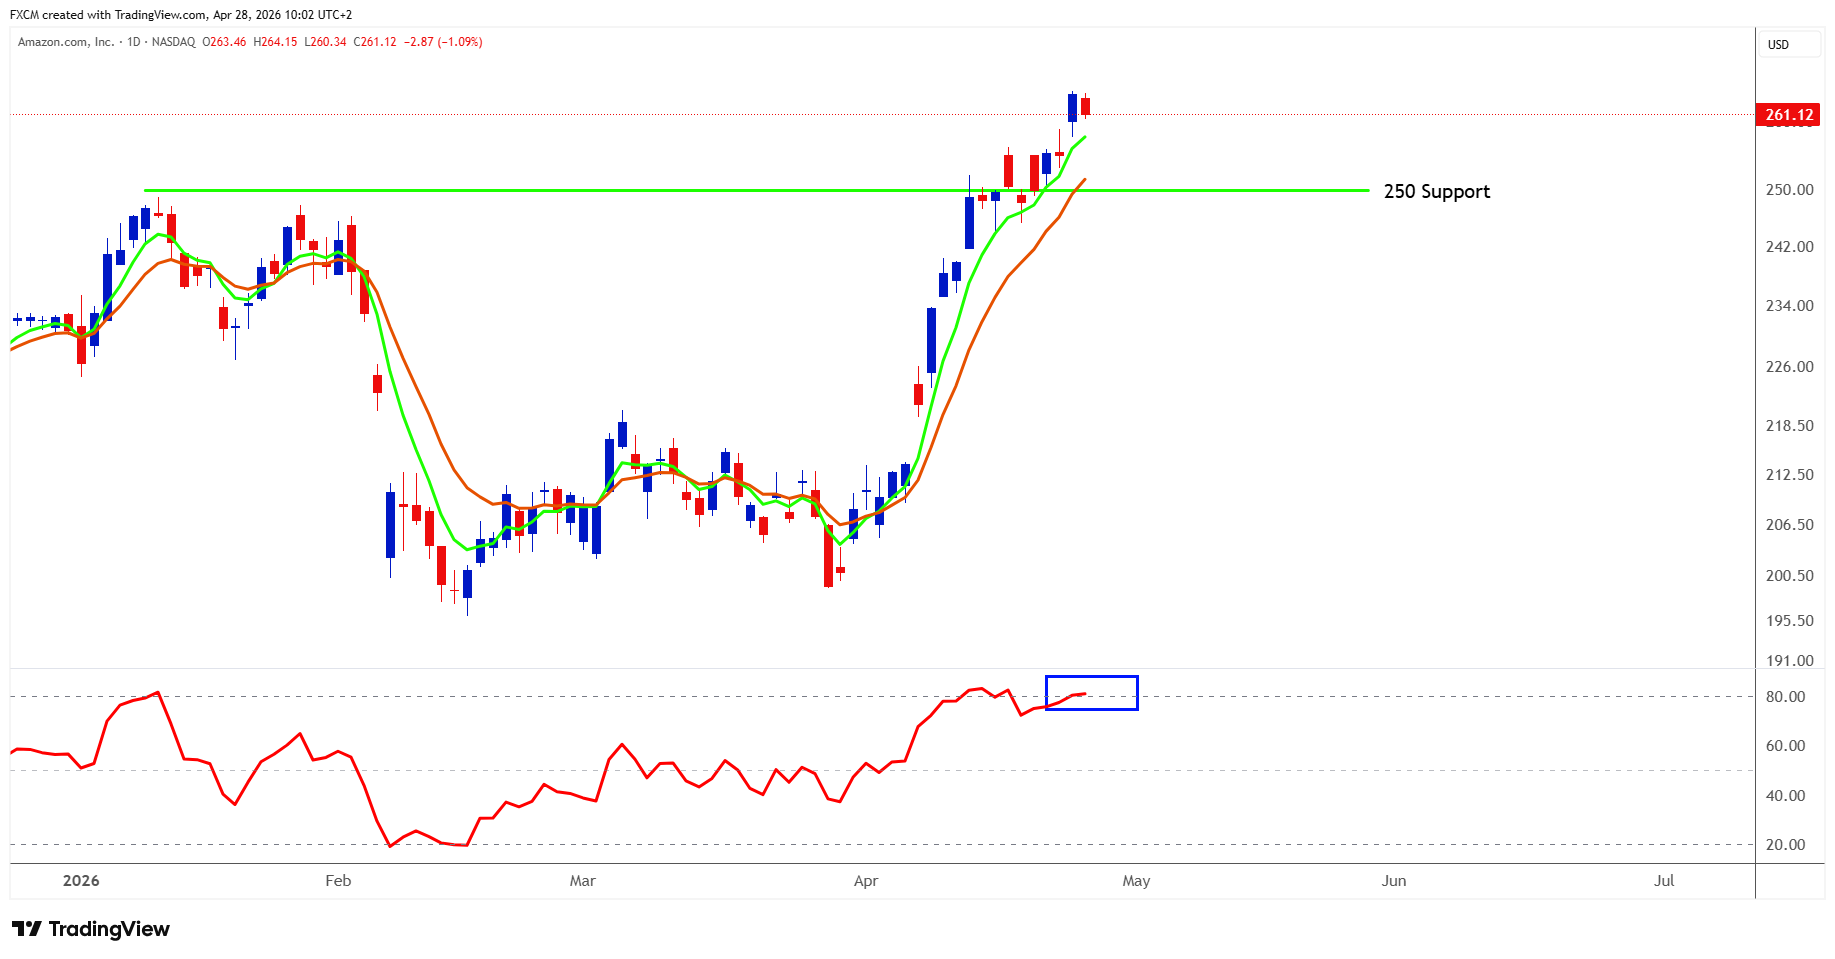
Technical Analysis
- AMZN is trading just below its all-time high.
- It has had a strong April, up over 25% for the month.
- It has broken above the key 260 level.
- The RSI is above 80 and in overbought territory (blue rectangle).
- This suggests a short-term ceiling may be forming.
- A pullback or consolidation would help reset the RSI.
- In that context, support levels become important, with the psychological 250 level a key area to watch.
- Any pullback could present a dip-buying opportunity within an uptrend.
- If RSI holds above 50, positive momentum remains intact, supporting the bullish view.
Caveat
- A move below 250 should be monitored closely.
- A negative EMA crossover, with clear slope and separation, alongside RSI falling below 50, would be a bearish development.
- Sustained trading below 50 on the RSI would undermine the bullish scenario.
Fundamental Perspective
Amazon heads into its earnings tomorrow with a strong but more balanced investment case than a simple "AI winner" narrative suggests. Expectations are centred on roughly $177bn in revenue, implying low-teens growth, and EPS of around $1.60+, making this a key near-term catalyst.
The core driver remains AWS, which continues to grow in the mid-20% range and generates a disproportionate share of profits, accounting for well over half of operating income despite representing a smaller slice of total sales. Momentum is being supported by rising AI demand, with Amazon's AI services already running at an annual revenue pace above $15bn. Strategically, the focus is on Amazon's push into AI infrastructure, highlighted by its deepening partnership with Anthropic, where it has committed up to $25bn and secured a long-term customer expected to spend heavily on AWS over the coming decade, reinforcing its position at the centre of AI workloads.
However, this strength is balanced by a growing debate around returns, as Amazon is expected to deploy roughly $200bn in capex in 2026, largely into AI infrastructure, raising the bar for execution and profitability.
Into earnings, investors are less focused on headline growth and more on whether AWS is reaccelerating, AI demand is translating into meaningful revenue and margins, and retail profitability remains resilient.
Taken together, Amazon remains one of the clearest ways to express the AI and cloud theme through a diversified model spanning AWS, advertising, and e-commerce, but it is firmly in a "prove it" phase where confirmation of AI monetisation and disciplined spending will be key to sustaining further upside
Alphabet Inc. - Class C (GOOG.us)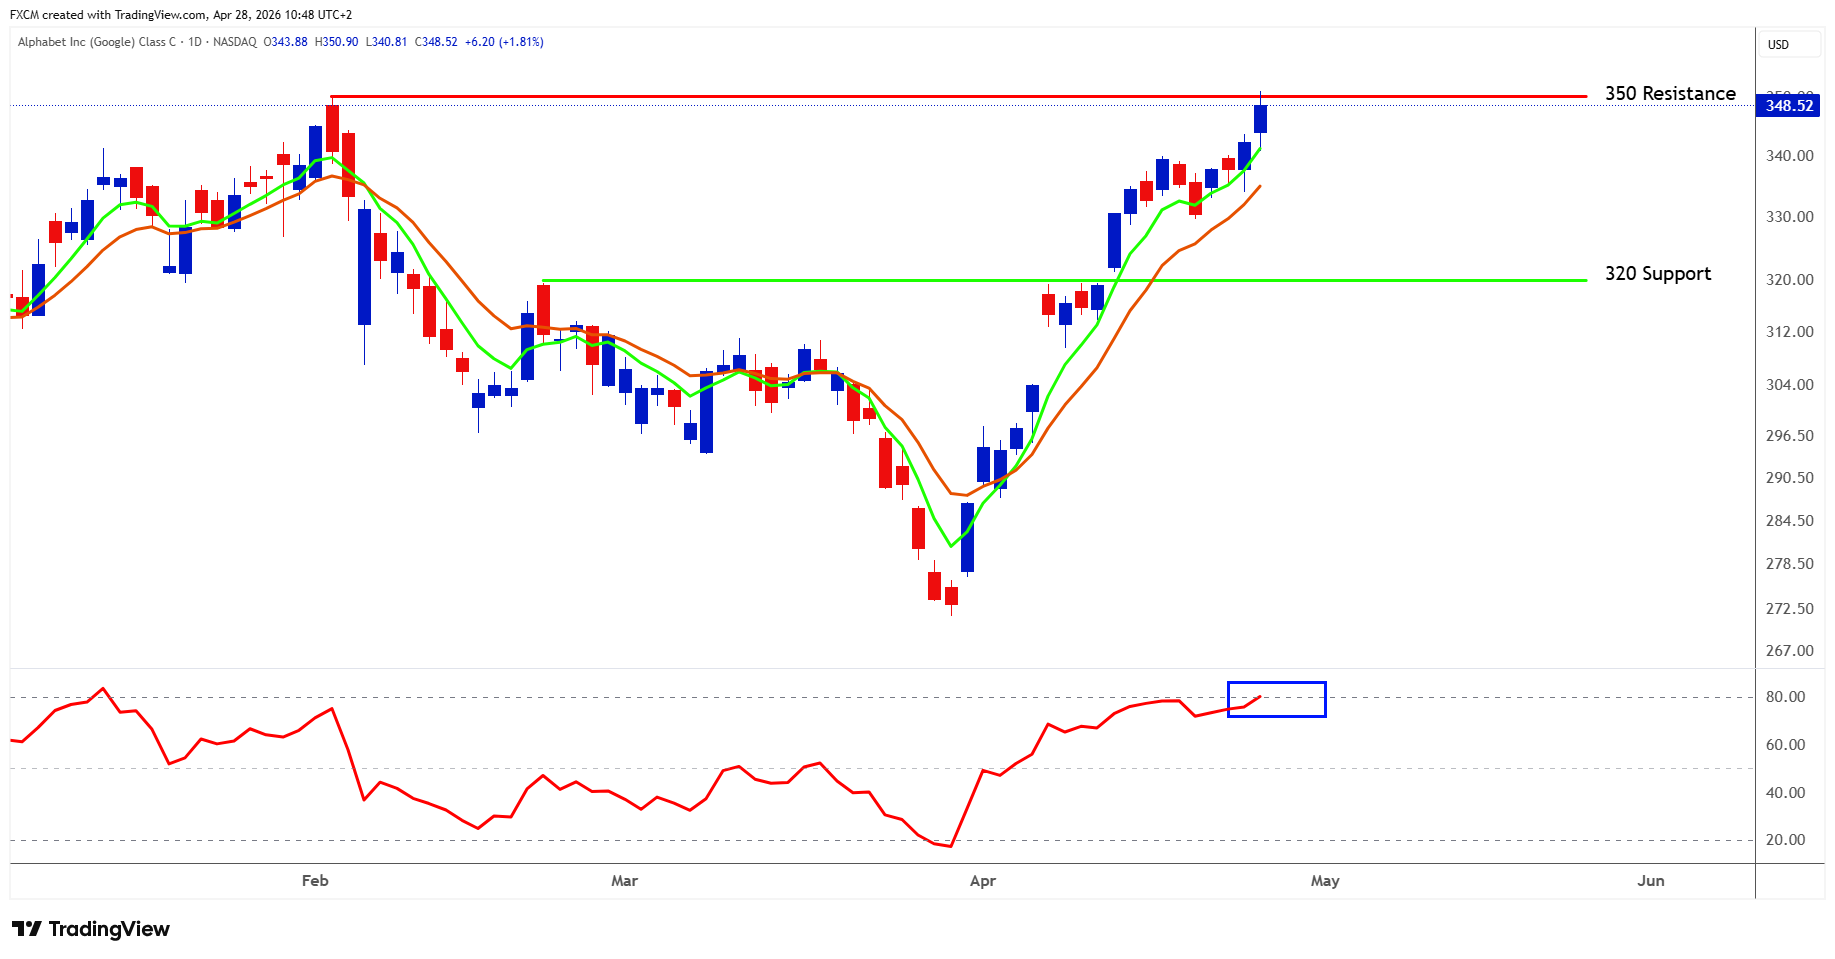
Technical Analysis
- GOOG is up around 22% for April.
- It is now trading near overhead resistance at 350.
- A break above this level would push it into all-time high territory.
- However, RSI is above 80 and in overbought territory (blue rectangle).
- This suggests the 350 level may hold as near-term resistance.
- Still, as long as RSI holds above 50, the bullish bias remains intact.
- In that context, support levels become important, with 320 as a key level to watch.
- Any pullback could offer a dip-buying opportunity within an uptrend.
Caveat
- A break below 320 needs close monitoring.
- A drop in RSI below 50 would be a negative signal.
- Sustained weakness below 50 would largely undermine the bullish outlook.
Fundamental Perspective
Alphabet heads into its earnings tomorrow with a strong but more balanced investment case, where the upside is clear but increasingly tied to execution. Expectations are centred on roughly $106–107bn in revenue, implying high-teens growth, and EPS of around $2.62–$2.68, slightly lower year-on-year due to heavy AI investment. The core strength remains Search, which continues to grow at a solid mid-teens pace and still generates the bulk of cash flow, even as investors watch for potential disruption from AI-driven alternatives.
Google Cloud is emerging as the key growth engine, with expectations for growth above 50% and strong enterprise demand supported by a sizeable backlog, providing good forward visibility. Strategically, Alphabet is pushing aggressively across the full AI stack, from its Gemini models to proprietary infrastructure. While this has already reached scale with hundreds of millions of users, monetisation remains early and under scrutiny.
This feeds into the central debate ahead of earnings, as the company is expected to spend $175-185bn on capex in 2026, nearly doubling year-on-year. That raises the bar for returns and puts near-term pressure on margins.
Taken together, Alphabet remains one of the most compelling ways to access AI at scale, supported by a dominant advertising business and a fast-growing cloud segment. However, the stock is firmly in a "prove it" phase, where confirmation of Search resilience, sustained Cloud momentum, and tangible progress in AI monetisation will be key to unlocking further upside.
Hot News, Cold Logic
Big Tech has delivered a strong April, but its earnings outlook will be crucial in shaping what comes next, particularly as AI concerns persist. A recent report by The Wall Street Journal noted that OpenAI missed key revenue and user targets, raising questions about whether demand can keep pace with heavy AI infrastructure spending. Competition from Anthropic and the growing traction of Gemini from Alphabet is also making it harder to retain users and scale revenue. With significant capital commitments and reliance on external funding, the central issue is whether usage and monetisation can justify the spend. The AI growth story remains intact, but the economics behind it are coming under increasing scrutiny.
Final Thought
Markets are increasingly defined by a coexistence of resilience and strain: oil has pushed back above $110 as the Iran conflict disrupts global supply and keeps inflation risks elevated, while equities remain steady but headline-driven rather than decisively strong.
For now, markets are proving resilient in the face of persistent shocks, but with geopolitics unresolved and the energy backdrop still unstable, this is a rally that continues to hold together while quietly carrying risks that could matter very quickly if the narrative turns.
Russell Shor
Senior Market Strategist
Russell Shor is a Senior Market Strategist at FXCM, having been promoted to the role in 2025 in recognition of his depth of insight and consistent delivery of high-impact market analysis. He originally joined FXCM in October 2017 as a Senior Market Specialist.
Russell holds an Honours Degree in Economics from the University of South Africa, is a certified FMVA®, and a full member of the Society of Technical Analysts (UK). With over 20 years of experience in financial markets, his work is renowned for its clarity, precision, and strategic value across asset classes.
Any opinions, news, research, analyses, prices, other information, or links to third-party sites contained on this website are provided on an "as-is" basis, as general market commentary and do not constitute investment advice. The market commentary has not been prepared in accordance with legal requirements designed to promote the independence of investment research, and it is therefore not subject to any prohibition on dealing ahead of dissemination. Although this commentary is not produced by an independent source, FXCM takes all sufficient steps to eliminate or prevent any conflicts of interests arising out of the production and dissemination of this communication. The employees of FXCM commit to acting in the clients' best interests and represent their views without misleading, deceiving, or otherwise impairing the clients' ability to make informed investment decisions. For more information about the FXCM's internal organizational and administrative arrangements for the prevention of conflicts, please refer to the Firms' Managing Conflicts Policy. Please ensure that you read and understand our Full Disclaimer and Liability provision concerning the foregoing Information, which can be accessed here.