USD/JPY Rebounds from Sell-off after Supportive BoJ Remarks

USD/JPY Analysis
After reaching thirty-eight year highs at the start of July, USD/JPY reversed course under the pressure of fresh FX intervention by Japanese authorities (in excess of ¥5 trillion) [1] and mounting expectations for Fed pivot and further tightening by the BoJ.
The Japanese central bank had adopted a slow and timid path away from its ultra-loose setting, which had failed to stem the Yen's demise, but bolstered its normalization efforts last week. It hiked rates again, pointed to more moves ahead and announced a sizeable reduction to its bond buying scheme.
Friday's soft US employment report stoked fears of recession, sent global markets into panic mode and led to calls for aggressive rate cuts by the Fed (of at least 100 bps in the next three meetings), which had earlier opened the door to a September pivot.
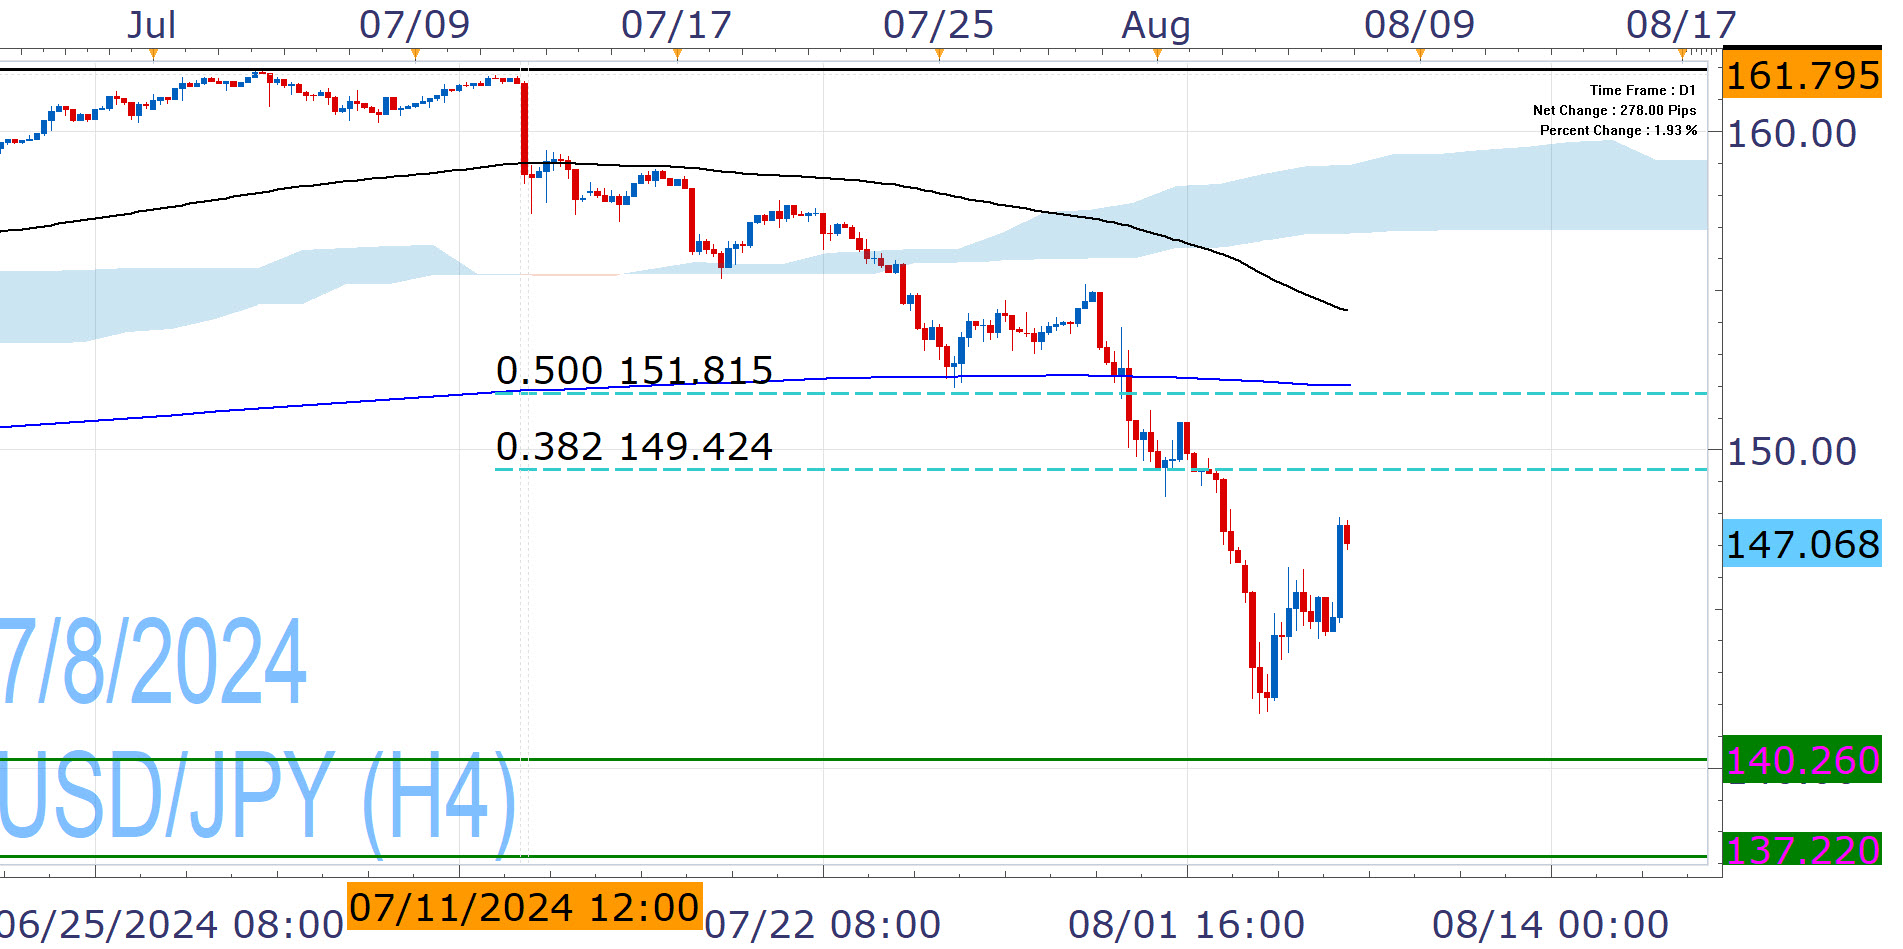
These developments accelerated the fall of USD/JPY, which lost more than 5.5% within four days and erased most of this year's gains. The shift in monetary policy dynamics can further pressure the pair towards 140.26 and beyond.
However, market recession fears and pricing around the Fed seems exaggerated. But even if the Fed slashes rates multiple times and the BoJ raises them again as indicated, the interest rate differential is still large and could continue to support the pair. Furthermore, Japanese policymakers are unlikely to become too hawkish and the market turmoil will give them pause. In fact, Deputy Governor Uchinda downplayed prospects of further hikes today, saying that the central bank "will not raise" interest rates "when financial and capital markets are unstable". [2]
This commentary helps USD/JPY rebound and give it the opportunity to tackle the 38.2% Fibonacci of the recent slump. However we are cautious around the ascending prospects, as the road ahead contains significant hurdles. Strong catalyst would be needed to surpass the resistance cluster provided 50% Fibonacci and 200Days and 200H4 EMAs (blue and black lines respectively).
Nikos Tzabouras
Senior Financial Editorial Writer
Nikos Tzabouras is a graduate of the Department of International & European Economic Studies at the Athens University of Economics and Business. With extensive experience in market analysis and a strong foundation in international relations, he brings a unique perspective to financial markets. Nikos emphasizes not only technical analysis but also on fundamentals and the growing influence of geopolitics on financial trends.
As a Senior Financial Editorial Writer, he delivers comprehensive and forward-looking insights across a wide range of asset classes, including equities, commodities, and currencies. His work explores how macroeconomic events, political developments, and global policies impact market dynamics, providing readers with a deeper understanding of both short-term movements and long-term trends.
References
| Retrieved 07 Aug 2024 https://www.mof.go.jp/english/policy/international_policy/reference/feio/monthly/20240731e.html | |
| Retrieved 01 Jul 2026 https://www.boj.or.jp/en/about/press/koen_2024/data/ko240807a1.pdf |
These materials constitute marketing communication and do not take into consideration your personal circumstances, investment experience or current financial situation. The content is provided as general market commentary and should not be construed as containing any type of investment advice, investment recommendation and/or a solicitation for any investment transactions. This market communication does not imply or impose an obligation on you to perform an investment transaction and/or purchase investment products or services. These materials have not been prepared in accordance with legal requirements designed to promote the independence of investment research and are not subject to any prohibition on dealing ahead of the dissemination of investment research.
FXCM, and any of its Affiliates, shall not in any way be liable to you for any inaccuracies, errors or omissions, regardless of cause, in the content of these materials, or for any damages (whether direct or indirect) which may arise from the use of such materials, services and their content. Consequently, any person acting on them does so entirely at their own risk. Please ensure that you read and understand our Full Disclaimer and Liability provision concerning the foregoing Information, which can be accessed here.