AlphaTrack: Suggested Signals & Set Ups – 03 February 2026

Thoughtful insights and approachable analysis.
- Gold corrected from parabolic highs, momentum reset suggests a dip within ongoing uptrend.
- Silver collapsed from parabolic highs, recovery depends on reclaiming $87.76, RSI, and EMAs.
- BNY Mellon remains technically strong, earnings beat supports momentum despite cautious 2026 growth outlook.
- Bristol Myers shows strengthening momentum, Opdivo transition supports growth, attractive valuation and dividend underpin appeal.
Quick Market Overview
Shares opened February on firmer footing, buoyed by a surprise surge in US manufacturing that has helped to calm nerves.
The Institute for Supply Management PMI vaulted back into expansion in January, delivering its strongest reading since 2022 at 52.6, well above the 48.5 forecast.
Attention is also turning to the policy outlook under Kevin Warsh, with investors debating how the Federal Reserve's direction could shift once Jerome Powell's term draws to a close.
Earnings continue to provide a broad tailwind, though fewer outright beats and uneven market reactions have sharpened the focus on upcoming results from Alphabet and Amazon for clearer signals on the path ahead.
General Market Health (SPX500)
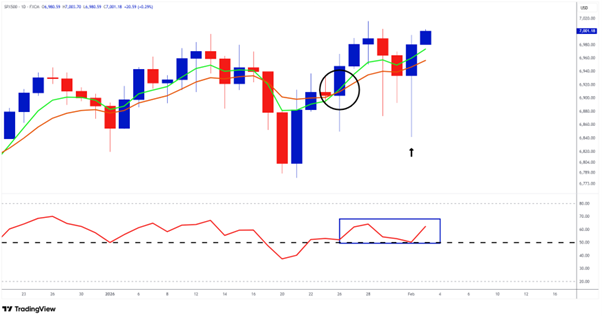
The SPX500 remains constructive, with EMAs still aligned in a bullish formation. Yesterday's price action (black arrow) adds to the positive tone: the index was aggressively sold down to the session low before selling pressure faded and buyers regained control. A strong recovery followed, lifting the index well above its open and delivering a decisive bullish close. This rapid handover from bears to bulls reinforces a constructive near-term outlook.
From Capitulation to Calm: Bullion Regains Ground
Gold and silver rebounded after an extreme sell-off, with the move appearing to correct short-term overbought conditions rather than signalling any damage to the longer-term investment case.
The decline was driven by a firmer dollar, shifting expectations around US monetary leadership following Donald Trump's nomination of Kevin Warsh, and a wave of short-term profit taking.
Gold's core structural drivers remain firmly intact: its long-term store-of-value appeal during periods of inflation, economic uncertainty or geopolitical stress, alongside sustained central bank and institutional demand for diversification.
Silver has experienced sharper swings, reflecting heavier retail participation, but industrial demand, particularly from solar and data-centre infrastructure, continues to underpin the longer-term outlook.
Potential Trade Setups
Gold Analysis (FXCM: XAUUSD)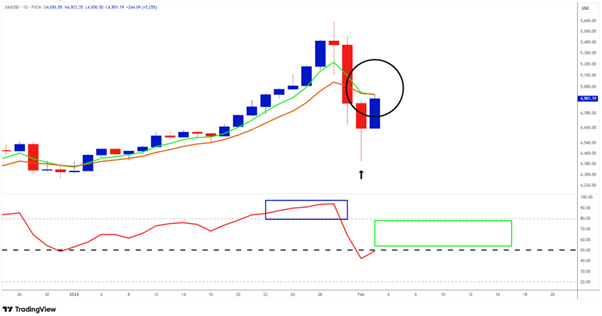
Gold sold off sharply after peaking at 5,597 on Thursday, 29 January 2026. The decline extended to a low of 4,401 yesterday before selling pressure faded and buyers stepped back in, lifting prices off the lows.
It is worth noting that the advance into Thursday's high had become increasingly parabolic, with the RSI deeply overbought, highlighted by the blue rectangle. Viewed in that context, the pullback looks more like a healthy reset than a trend break.
With bears losing control and bulls regaining ground, attention now turns to confirmation. Ideally, the RSI should reclaim and hold above 50, shown by the green rectangle, while EMAs reassert a bullish structure with improving slope and separation. If these signals emerge, the setup points to a classic "dip within an uptrend" scenario.
Silver Analysis (FXCM: XAGUSD)
Silver was hit by a brutal rout, plunging 26.8% on Friday after topping out at $121.55 on Thursday. The sell-off culminated in a low of $71.13 yesterday before volatility began to ease.
It is worth noting that silver had been deeply overbought since December, with only brief and uneven releases of pressure along the way. The advance into the highs was distinctly parabolic, and the sharp correction has returned the metal to something closer to technical equilibrium.
A move above yesterday's high of $87.76 would be an early indication that a trough may be forming. Even so, stronger confirmation would come from a bullish EMA crossover and an RSI move above 50 that is sustained, shown by the green rectangle. A failure to hold above 50 would instead point to lingering weakness rather than a renewed upswing.
The Bank of New York Mellon Corporation (NYSE: BK)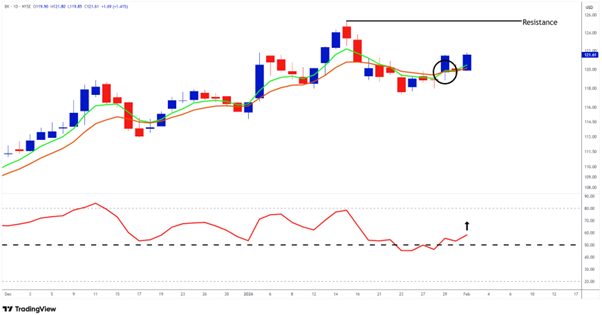
The Bank of New York Mellon has an increasingly constructive chart. The stock is up close to 47% over the past 12 months and, while it has pulled back modestly since 14 January, its daily signals remain supportive.
EMAs have crossed bullishly and, if they continue to develop greater slope and separation, this will reinforce the positive setup. The RSI is also holding above 50, pointing to underlying bullish momentum. As long as the RSI remains at these levels, BK's price action is likely to stay supported.
Bank of New York Mellon did beat its fourth-quarter earnings and revenue expectations, supported by stronger-than-anticipated fee income.
Adjusted profit topped consensus forecasts, while revenue rose 7% year on year, extending a strong run for the stock through 2025.
Looking ahead, management struck a more cautious tone, guiding to roughly 5% revenue growth in 2026 alongside higher costs.
That note of caution was tempered by an upgraded medium-term margin target, reinforcing the view that profitability can continue to improve even as growth moderates.
Bristol-Myers Squibb Company (NYSE: BMY)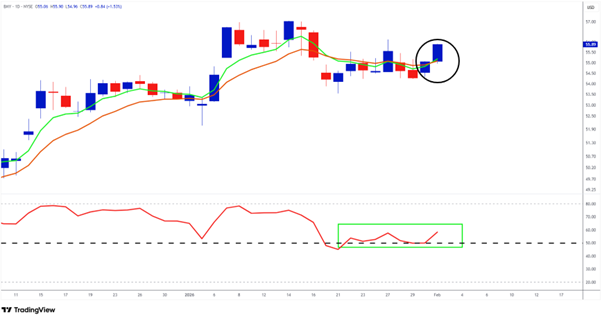
Bristol Myers Squibb's technical picture is turning more constructive. EMAs are on the verge of a bullish crossover, highlighted by the black circle, while the RSI is holding above 50, signalling underlying momentum. If the RSI remains supported and the EMAs develop greater slope and separation, the setup will strengthen further.
The shares are already up an impressive 32% since the end of October, reflecting improving sentiment.
On the fundamentals, the company said around 5% of patients using its flagship cancer drug Opdivo have transitioned to the new injectable formulation, Opdivo Qvantig, with management confident adoption will reach at least 30% within two years. Approved in late 2024, the faster-to-administer therapy has gained traction after securing a dedicated Medicare billing code, easing reimbursement and supporting uptake among physicians.
Opdivo is still expected to generate more than $10bn in sales this year, with the newer formulation offering longer patent protection and some insulation from future pricing negotiations.
From a valuation perspective, Bristol Myers Squibb screens as attractive, trading on a PE of 9.27 and offering a dividend yield of 4.51%, making it a name worth keeping on the radar.
Hot News, Cold Logic
Markets looked set to open on firmer footing, supported by upbeat economic data and strong results from Palantir Technologies, which helped steady nerves around the AI trade.
Palantir's robust revenue growth reinforced confidence that AI investment is translating into tangible earnings, easing concerns about a near-term bubble.
Treasury yields edged higher while the dollar softened again, as markets continued to assess the policy implications of Kevin Warsh's nomination to lead the Federal Reserve.
Final Thought
Despite recent volatility in commodities and precious metals, risk sentiment has stabilised with global equities bouncing back toward record territory and trade deals soothing geopolitical jitters, suggesting that while headwinds remain, resilient earnings and selective opportunities still offer a constructive backdrop for markets.
Russell Shor
Senior Market Strategist
Russell Shor is a Senior Market Strategist at FXCM, having been promoted to the role in 2025 in recognition of his depth of insight and consistent delivery of high-impact market analysis. He originally joined FXCM in October 2017 as a Senior Market Specialist.
Russell holds an Honours Degree in Economics from the University of South Africa, is a certified FMVA®, and a full member of the Society of Technical Analysts (UK). With over 20 years of experience in financial markets, his work is renowned for its clarity, precision, and strategic value across asset classes.
These materials constitute marketing communication and do not take into consideration your personal circumstances, investment experience or current financial situation. The content is provided as general market commentary and should not be construed as containing any type of investment advice, investment recommendation and/or a solicitation for any investment transactions. This market communication does not imply or impose an obligation on you to perform an investment transaction and/or purchase investment products or services. These materials have not been prepared in accordance with legal requirements designed to promote the independence of investment research and are not subject to any prohibition on dealing ahead of the dissemination of investment research.
FXCM, and any of its Affiliates, shall not in any way be liable to you for any inaccuracies, errors or omissions, regardless of cause, in the content of these materials, or for any damages (whether direct or indirect) which may arise from the use of such materials, services and their content. Consequently, any person acting on them does so entirely at their own risk. Please ensure that you read and understand our Full Disclaimer and Liability provision concerning the foregoing Information, which can be accessed here.