
AlphaTrack – SPX500 at a Crossroads as Oil and Yields Rise


Thoughtful insights and approachable analysis.
- Target's 50% rally faces its biggest test yet as earnings put the turnaround, margins and consumer strength under the spotlight.
- Walmart is coiling ahead of earnings, with Thursday's results potentially deciding whether the shares finally break free of their sideways range.
- Alibaba is approaching a defining earnings test, with AI and cloud growth potentially providing the firepower for a run at $145.
Quick Market Overview
US stocks slipped in quiet August trading as strength in semiconductors and energy failed to offset weakness across the broader market. Chip shares rebounded into a new bull market, while renewed US-Iran tensions lifted oil prices and pushed long-term Treasury yields higher, reinforcing concerns that energy costs could keep inflation elevated. With trading volumes unusually light, however, the day's market moves may say more about thin summer liquidity than a decisive shift in investor sentiment.
General Equity Market Health
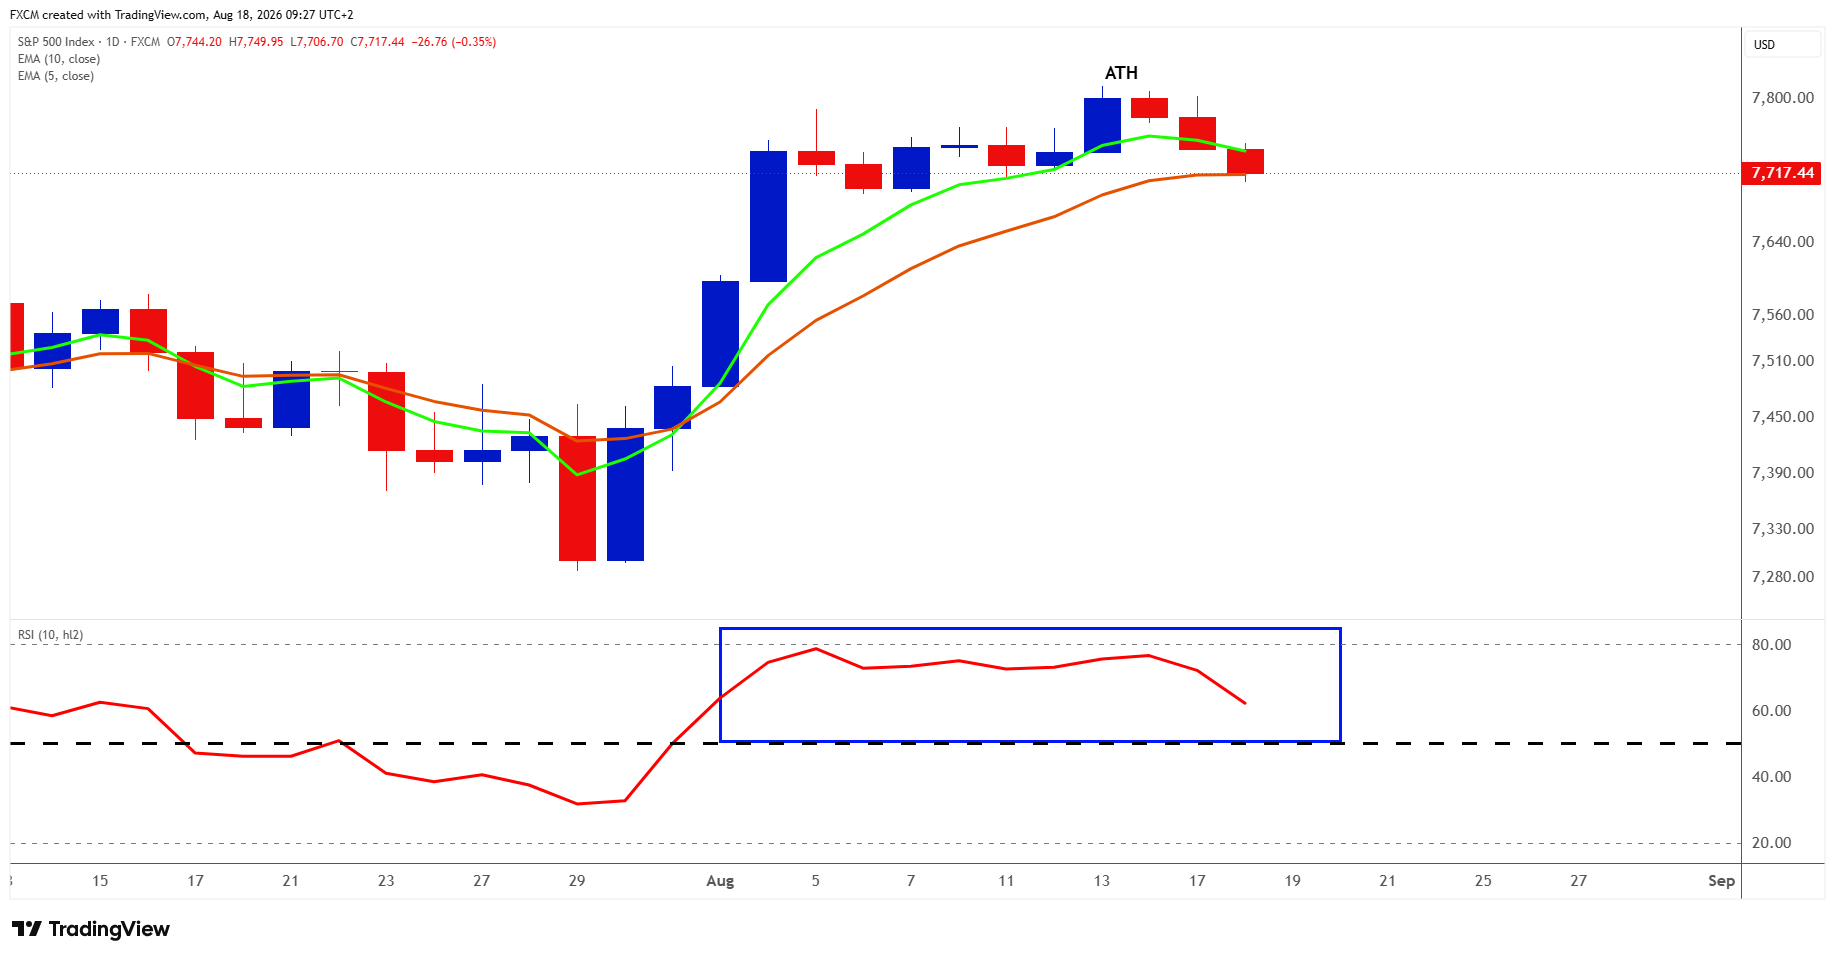
The SPX500 has lost some momentum after setting a fresh all-time high near 7,800, with the index pulling back over the past two sessions and trading lower again today. The decline has taken price below the 5-day EMA and back towards the rising 10-day EMA around 7,700, making this the first important area of support. RSI has also retreated sharply from near-overbought territory, suggesting that the recent buying impulse is fading. The 50 level now becomes important: if RSI can hold above it while the index stabilises around its 10-day EMA, the setback is more likely to remain a healthy consolidation within the broader uptrend. A decisive break below 50, particularly alongside a loss of the 10-day EMA, would instead point to growing downside pressure and raise the risk of a deeper pullback.
The SPX500's retreat from record highs is coinciding with a less comfortable macro backdrop, even as the underlying corporate earnings picture remains strong. UKOil has climbed back above $91 a barrel as hopes for a US-Iran breakthrough fade, reviving concerns that expensive energy could keep inflation elevated, while the US 10-year Treasury yield has risen towards 4.74% and the 30-year above 5.3%, its highest in 19 years. Higher long-term yields raise the hurdle rate for equities and are particularly uncomfortable when valuations are elevated. At the same time, July's surprisingly weak retail sales have introduced fresh questions about the strength of the US consumer. That leaves investors facing an awkward combination of softer growth signals, renewed energy-driven inflation pressure and rising long-term borrowing costs, providing a plausible fundamental explanation for some of the profit-taking since the SPX500 reached its latest high.
Potential Trade Setups
Target, Walmart and Alibaba each sit at interesting technical inflection points ahead of earnings, with fundamentals likely to determine whether their next moves are breakouts or deeper consolidations. Target is testing short-term support after a powerful rally, Walmart remains trapped in a broad sideways range awaiting a momentum catalyst, while Alibaba's improving trend structure leaves the $145 resistance zone in play if AI and cloud strength can offset weak Chinese consumption. Across all three, earnings quality, management commentary and RSI behaviour should provide the clearest signals on whether buyers are ready to regain control.
Target (TGT.us)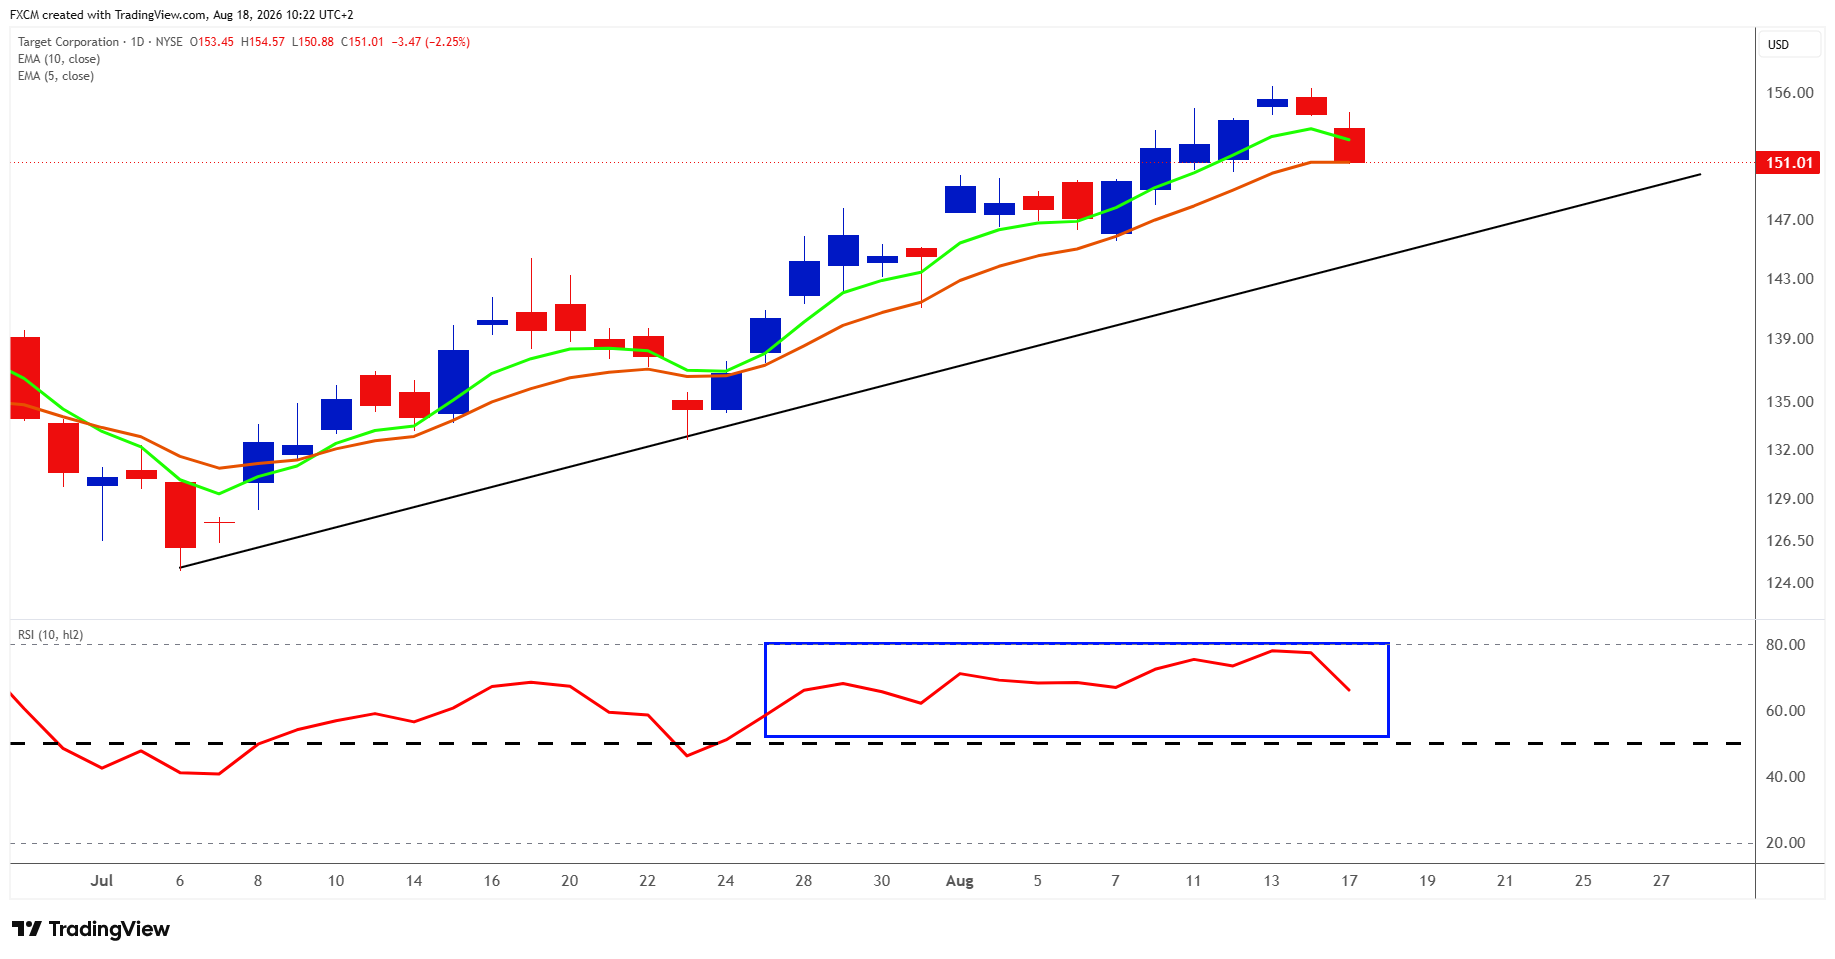
Technical Analysis
Target remains in a well-defined uptrend, but the latest price action suggests the rally is finally taking a breather after its strong run from the July lows. The stock has retreated from the $155-156 area and today's 2% decline has pushed it below the five-day EMA and back towards the rising 10-day EMA near $151, making this the first important test of short-term support. Momentum has cooled at the same time, with RSI falling sharply from near-overbought territory into the mid-60s, although it remains comfortably above 50 and therefore still supports the broader bullish trend. If Target can stabilise around the 10-day EMA, the pullback would look more like healthy consolidation before another attempt at $155-156.
Caveat
A decisive break lower would weaken the near-term technical picture, shifting attention towards the $147-149 breakout area and, below that, the rising trendline around $145-146. A drop in RSI below 50 would add to the caution, signalling that momentum has deteriorated enough to put the broader uptrend under greater pressure.
Fundamental Perspective
Target reports tomorrow with expectations high after a more than 50% share-price rise this year. Investors will focus on traffic, discretionary spending and margins after Q1 comparable sales rose 5.6%, driven by 4.4% traffic growth. The consumer backdrop remains mixed, with July US retail sales down 0.6%, although stronger clothing, furniture and health-and-personal-care spending offers some encouragement. Target also needs to show that refreshed apparel, home and beauty ranges are attracting shoppers without heavier promotions. Q1 gross margin improved to 29%, helped by supply-chain efficiencies, lower markdowns and higher-margin businesses such as Roundel and Target+. After such a strong rally, another earnings beat may not be enough; Target must show that sales, traffic and margins are improving sufficiently to justify renewed optimism and support its upgraded full-year outlook.
Walmart Inc (WMT.us)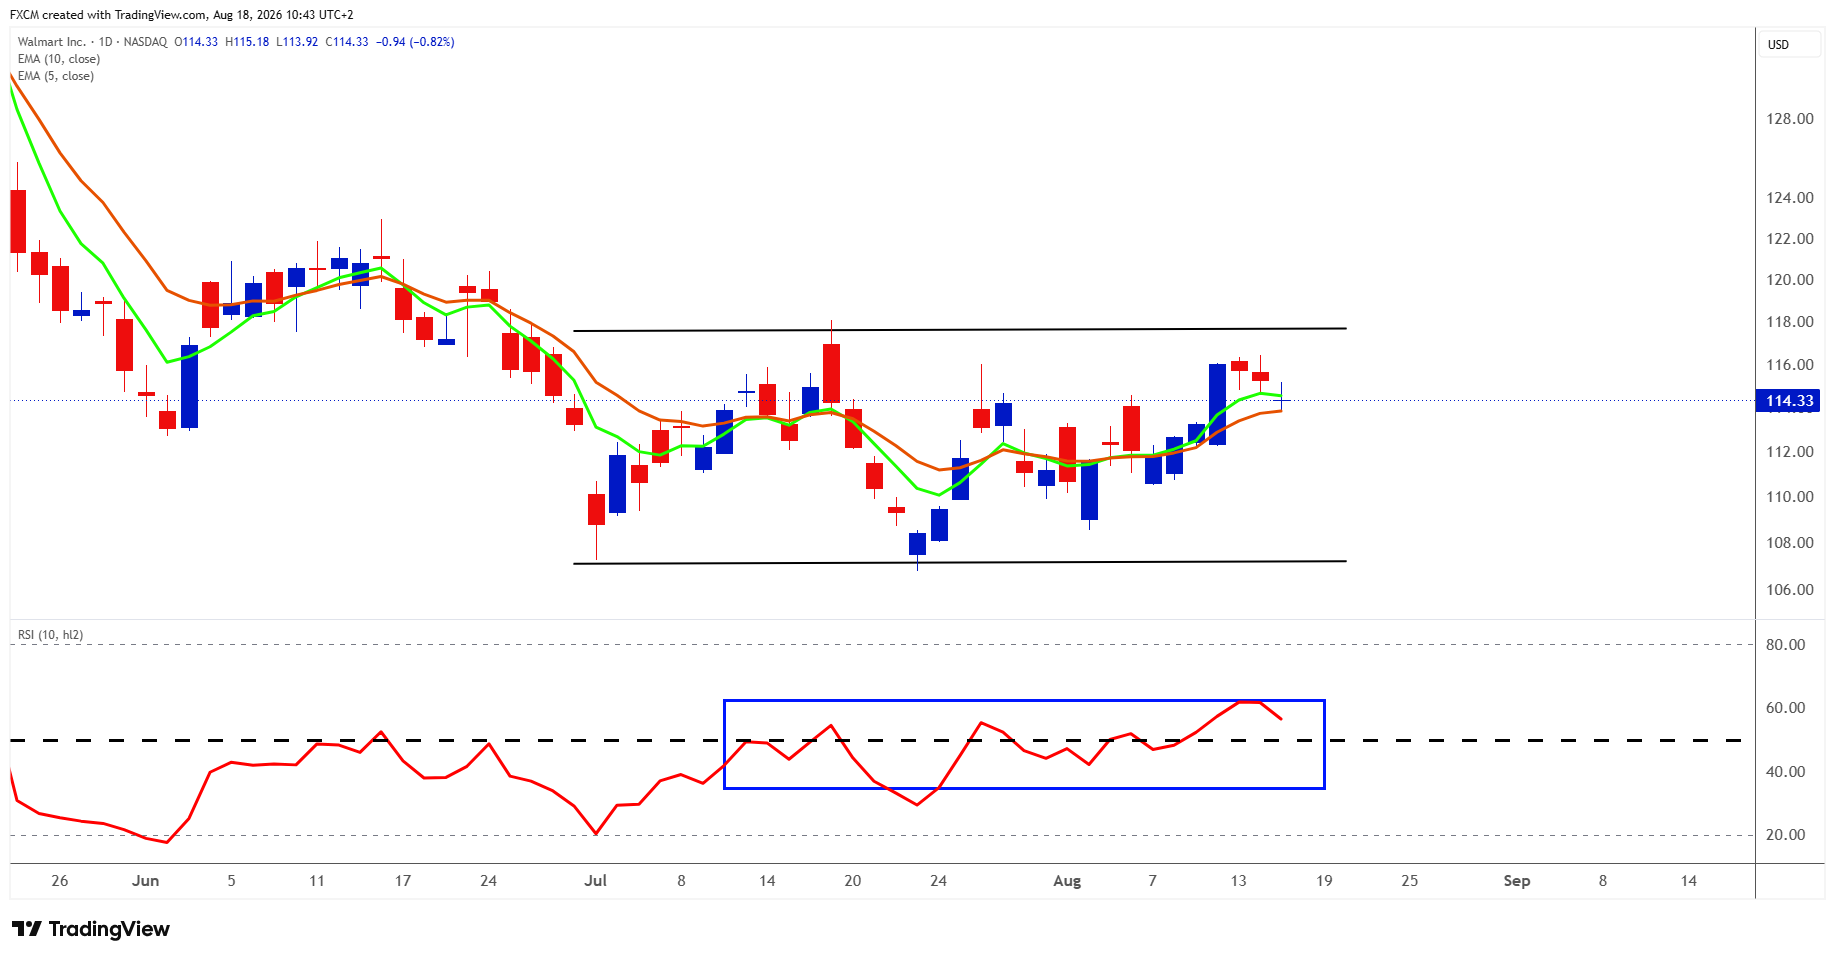
Technical Analysis
Walmart remains trapped in a broad sideways consolidation, with price oscillating between roughly $107 and $118 and neither bulls nor bears yet able to force a decisive break. The recent rebound has lifted the shares back towards the middle-upper part of that range, but the short-term moving averages are still relatively flat and momentum remains the key missing ingredient. RSI has spent much of the past month whipping around the 50 line rather than trending strongly in either direction, which neatly reflects the market's indecision. For Walmart to make meaningful headway towards the $118 ceiling, RSI needs to break above 50 and, more importantly, stay there long enough to confirm that buyers are taking control. If that happens, a challenge of range resistance becomes increasingly credible.
Caveat
If RSI slips back below 50, Walmart risks remaining trapped in its sideways range; a sustained move beneath that level would be more concerning, signalling deteriorating momentum and increasing the likelihood of renewed selling pressure.
Fundamental Perspective
Walmart's results on Thursday will test whether strong sales momentum is translating into faster profit growth as US consumers become more cautious. Expectations are for roughly $186-187 billion of revenue and $0.73-$0.74 of EPS, broadly in line with Walmart's own guidance. The bigger focus will be on the underlying trends. Q1 US comparable sales rose 4.1%, transactions increased 3% and e-commerce jumped 26%, although spending per transaction slowed to 1.1%.
With US retail sales weakening in July, investors will scrutinise traffic, basket size and general merchandise for signs of consumer strain. Profit quality will matter too, with fast-growing advertising, membership income and improving e-commerce economics steadily lifting the contribution from higher-margin businesses. Energy remains a risk, however, after elevated fuel costs weighed on Q1 operating income. Following last quarter's cautious guidance, solid headline numbers may not be enough; investors will want evidence that transactions remain resilient, digital growth is becoming more profitable and management is gaining confidence in the second half.
Alibaba (BABA.us)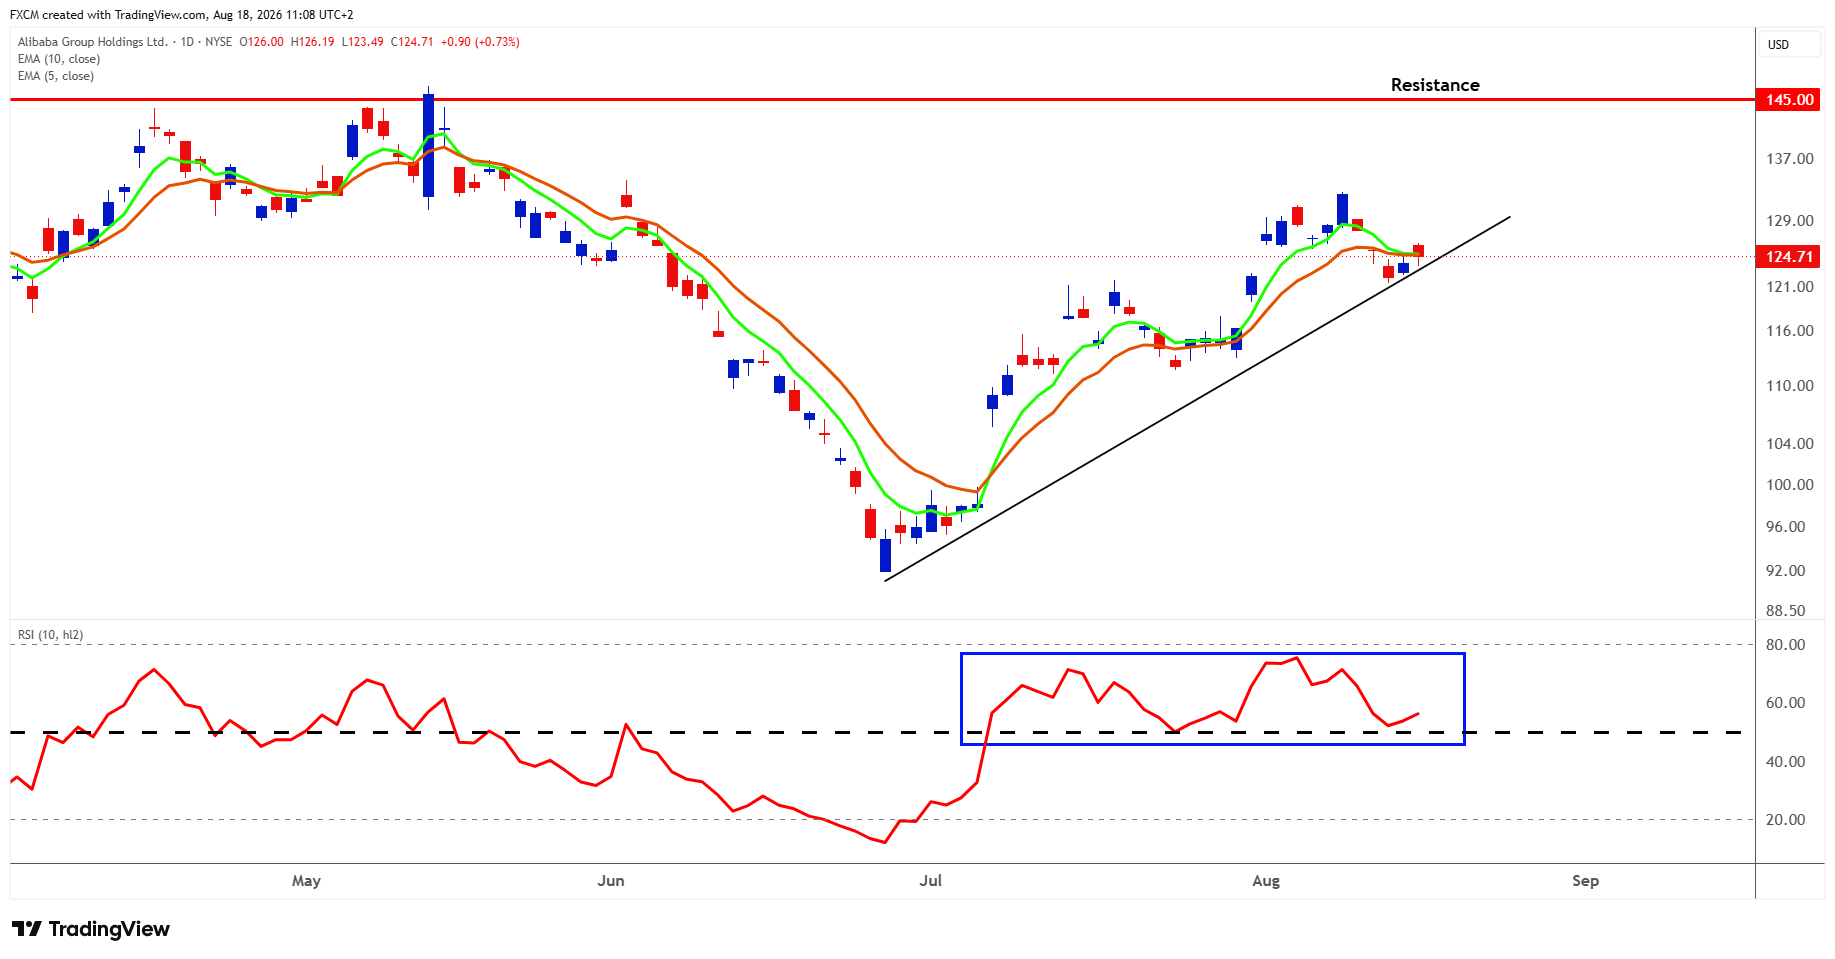
Technical Analysis
Alibaba's recovery from the June low remains technically constructive, with the latest leg producing a clear sequence of higher lows followed by higher highs and price continuing to respect the rising trendline. Momentum has cooled after the early-August push towards $130, but the pullback has so far looked more like consolidation than a breakdown, with the shares attempting to stabilise around their short-term moving averages. RSI is particularly important here. It recently tested the 50 line and has turned higher, suggesting buyers still have the upper hand. A sustained move above 50 would strengthen the case for another push through the $129–131 area and ultimately towards the much more significant $145 resistance zone, which capped the rally earlier this year. If Alibaba is going to mount a serious challenge of that level, RSI will need to remain firmly above 50 as price advances.
Caveat
A sustained break in RSI below 50 would be a notable warning sign, suggesting that bullish momentum is fading and increasing the risk of a break below the rising trendline, which would weaken the broader recovery structure.
Fundamental Perspective
Alibaba's results on Thursday will test whether its AI-and-cloud momentum can continue to outweigh a weak Chinese consumer backdrop. Cloud remains the key catalyst after revenue rose 38% last quarter, external cloud growth reached 40% and AI-related products accounted for 30% of external cloud sales, with margins expected to improve over the next one to two quarters. Commerce is the bigger challenge, with 618 gross merchandise value across major e-commerce platforms growing only marginally and Chinese retail sales rising just 0.6% year on year in July. Investors will also watch whether heavy quick-commerce spending is beginning to ease after sharply reducing EBITA last quarter. For the shares, the ideal outcome is sustained cloud and AI growth, improving margins, resilient commerce monetisation and clear evidence that Alibaba's investment cycle is beginning to generate returns rather than simply absorb capital.
Hot News, Cold Logic
Long-term government bond yields are rising sharply across major markets as investors demand greater compensation for inflation risk, heavy public borrowing and a flood of new debt linked partly to AI investment. The pressure is being amplified by weaker demand from traditional long-term buyers such as pension funds and a shift towards more price-sensitive private investors. While inflation expectations remain relatively contained, higher real yields suggest markets are increasingly concerned about fiscal sustainability and the sheer volume of debt issuance.
Final Thought
The market is seemingly entering a more demanding phase, where exceptional earnings and enthusiasm around AI are increasingly having to compete with a rising cost of capital. Oil above $90, the 30-year Treasury yield at its highest since 2007 and renewed Middle East tensions have brought inflation and financing risks back into focus, while questions persist over the scale and eventual payoff of AI spending. The bull case remains intact while profits hold up, but further gains will increasingly depend on greater stability in energy and bond markets and clearer evidence that extraordinary investment is translating into durable returns.

Russell Shor
Senior Market Strategist
Russell Shor is a Senior Market Strategist at FXCM, having been promoted to the role in 2025 in recognition of his depth of insight and consistent delivery of high-impact market analysis. He originally joined FXCM in October 2017 as a Senior Market Specialist.
Russell holds an Honours Degree in Economics from the University of South Africa, is a certified FMVA®, and a full member of the Society of Technical Analysts (UK). With over 20 years of experience in financial markets, his work is renowned for its clarity, precision, and strategic value across asset classes.
These materials constitute marketing communication and do not take into consideration your personal circumstances, investment experience or current financial situation. The content is provided as general market commentary and should not be construed as containing any type of investment advice, investment recommendation and/or a solicitation for any investment transactions. This market communication does not imply or impose an obligation on you to perform an investment transaction and/or purchase investment products or services. These materials have not been prepared in accordance with legal requirements designed to promote the independence of investment research and are not subject to any prohibition on dealing ahead of the dissemination of investment research.
FXCM, and any of its Affiliates, shall not in any way be liable to you for any inaccuracies, errors or omissions, regardless of cause, in the content of these materials, or for any damages (whether direct or indirect) which may arise from the use of such materials, services and their content. Consequently, any person acting on them does so entirely at their own risk. Please ensure that you read and understand our Full Disclaimer and Liability provision concerning the foregoing Information, which can be accessed here.