NGAS Struggles to Extend Bounce Past Key Technical Hurdles

NGAS Analysis
Natural Gas fundamentals have improved this year, helping prices into a Q2 rally. Considered a bridge fuel, it is resilient to the clean energy transition and is also used widely in electricity generation, which is boosted by AI data center demand and auto electrification. The International Energy agency expects demand to grow by 2.5% this year and outpace supply, largely driven by industrial use in Asia. [1]
However, the market remains fragile and record summer heat failed to offer substantial price boost, as we enter the September-October shoulder period, when consumption typically weakens. The supply side is also a bit mixed, with Sinopec for instance expecting similar output in H2 as last year [2] and EQT seeing a marginal increase in 2024. [3]
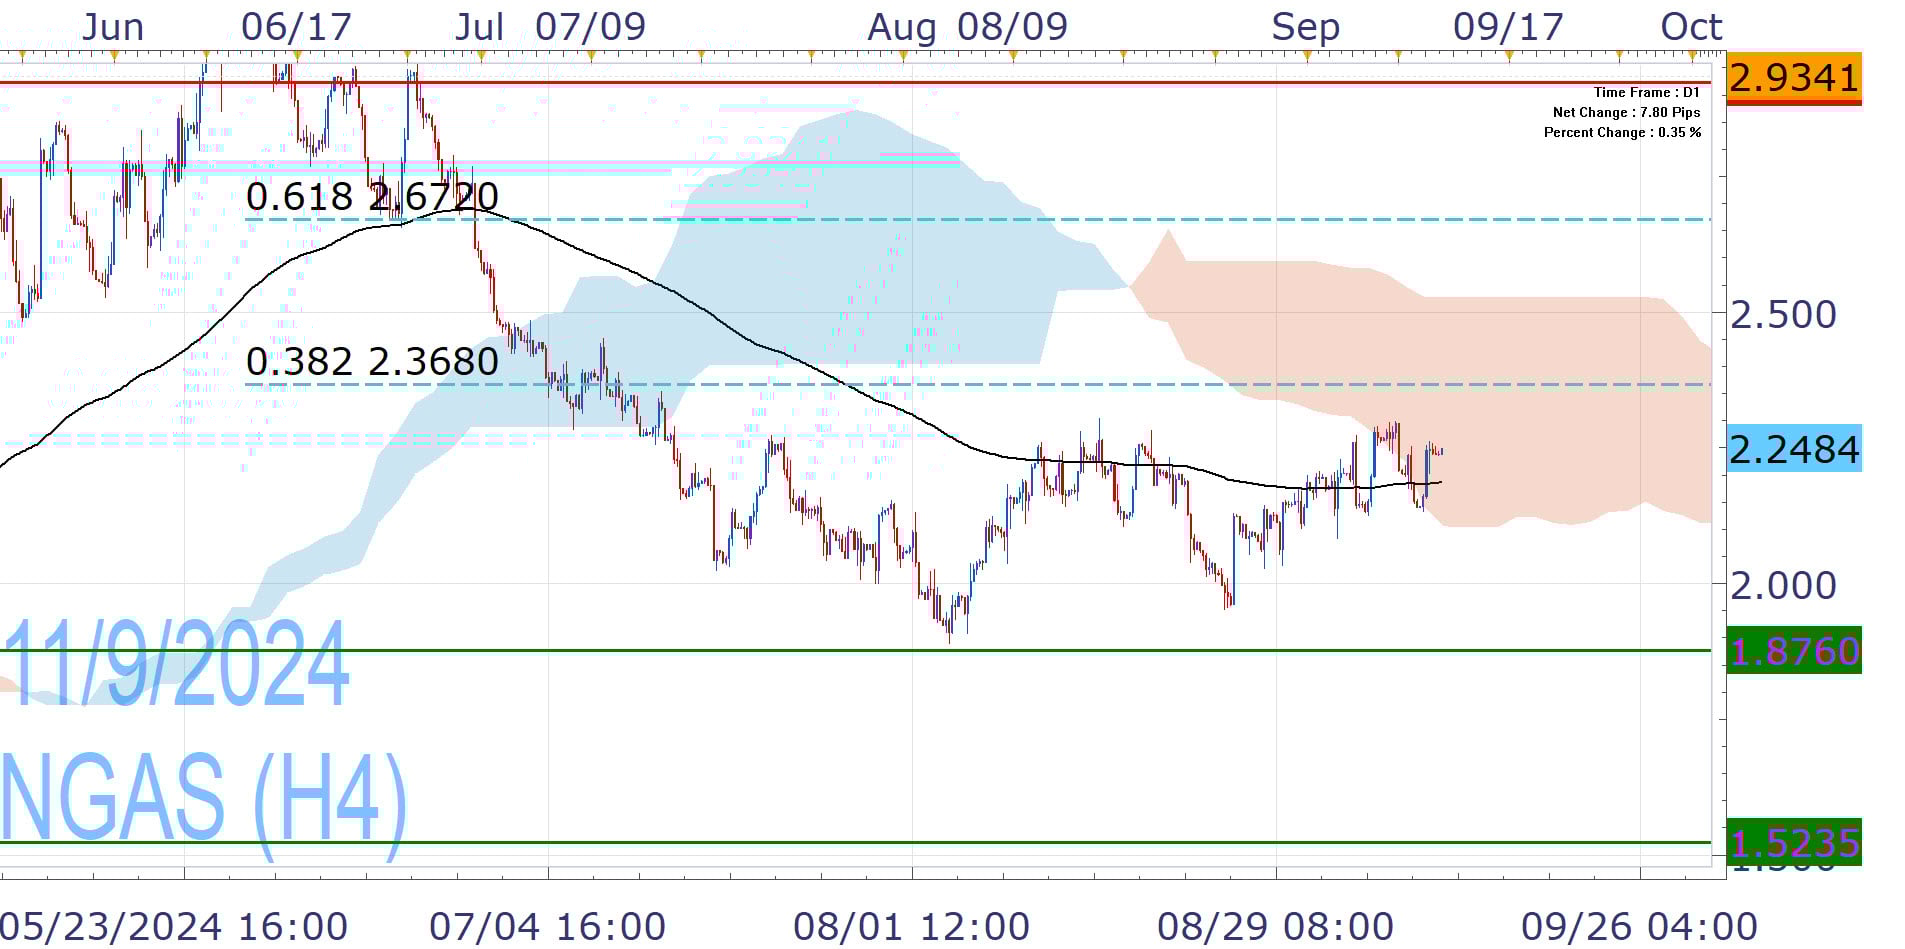
The second quarter rally faltered in in June-July and despite a recovery in recent weeks, NGAS struggles at critical technical cluster. The commodity has reclaimed the EMA200 and pierced into the daily Ichimoku Cloud, trying once again to surpass the 38.2% of the recent slump. Successful effort could pave the way for greater advance towards the 61.8% level, but the upside is unfriendly.
NGAS has faltered multiple times at the pivotal 38.2% Fibonacci, which creates risk for lower lows (1.876), although sustained weakness towards 1.523 does not look easy.
Nikos Tzabouras
Senior Financial Editorial Writer
Nikos Tzabouras is a graduate of the Department of International & European Economic Studies at the Athens University of Economics and Business. With extensive experience in market analysis and a strong foundation in international relations, he brings a unique perspective to financial markets. Nikos emphasizes not only technical analysis but also on fundamentals and the growing influence of geopolitics on financial trends.
As a Senior Financial Editorial Writer, he delivers comprehensive and forward-looking insights across a wide range of asset classes, including equities, commodities, and currencies. His work explores how macroeconomic events, political developments, and global policies impact market dynamics, providing readers with a deeper understanding of both short-term movements and long-term trends.
Any opinions, news, research, analyses, prices, other information, or links to third-party sites contained on this website are provided on an "as-is" basis, as general market commentary and do not constitute investment advice. The market commentary has not been prepared in accordance with legal requirements designed to promote the independence of investment research, and it is therefore not subject to any prohibition on dealing ahead of dissemination. Although this commentary is not produced by an independent source, FXCM takes all sufficient steps to eliminate or prevent any conflicts of interests arising out of the production and dissemination of this communication. The employees of FXCM commit to acting in the clients' best interests and represent their views without misleading, deceiving, or otherwise impairing the clients' ability to make informed investment decisions. For more information about the FXCM's internal organizational and administrative arrangements for the prevention of conflicts, please refer to the Firms' Managing Conflicts Policy. Please ensure that you read and understand our Full Disclaimer and Liability provision concerning the foregoing Information, which can be accessed here.