EUR/GBP Down After UK Inflation, Awaits Central Banks
UK Inflation
Data released this morning from the Old Albion, showed that headline Consumer Price Index (CPI) surged 5.1% y/y in November, compared to 4.2% in October.
This is way higher than the central bank's 2% target, but also far ahead of its projections. Based on its last Monetary Policy Report, the Bank of England (BoE), expected CPI Inflation to hit the 5% mark in April 2022. [1]
The Core annualized CPI jumped 4%, compared to 3.4% prior.
On the Producer side, headline PPI output showed growth of 9.1% y/y, up from 8.6% in October 2021. Headline PPI input grew 14.3% y/y, up from 13.7% last month.
Central Banks
Today, markets brace for the Fed's monetary policy decision, but on Thursday, focus will shift to the Bank of England (BoE) and the European Central Bank (ECB).
The BoE had surprised many investors with November's decision not to increase rates, despite commentary that pointed towards such a move. Omicron complication and some recent dovish comments, have made markets cautious this time around.
The ECB on the other hand, is far on the dovish side of the policy spectrum, but markets will be looking for any commentary/decisions around the future of its asset purchase programs and the updated economic projections.
The ECB runs two such schemes: the Pandemic Emergency Purchase Programme (PEPP) with a potential envelope of €1,850 billion and a horizon until March 2022 and the much smaller €20 billion/month Asset Purchase Programme (APP).
EUR/GBP Analysis
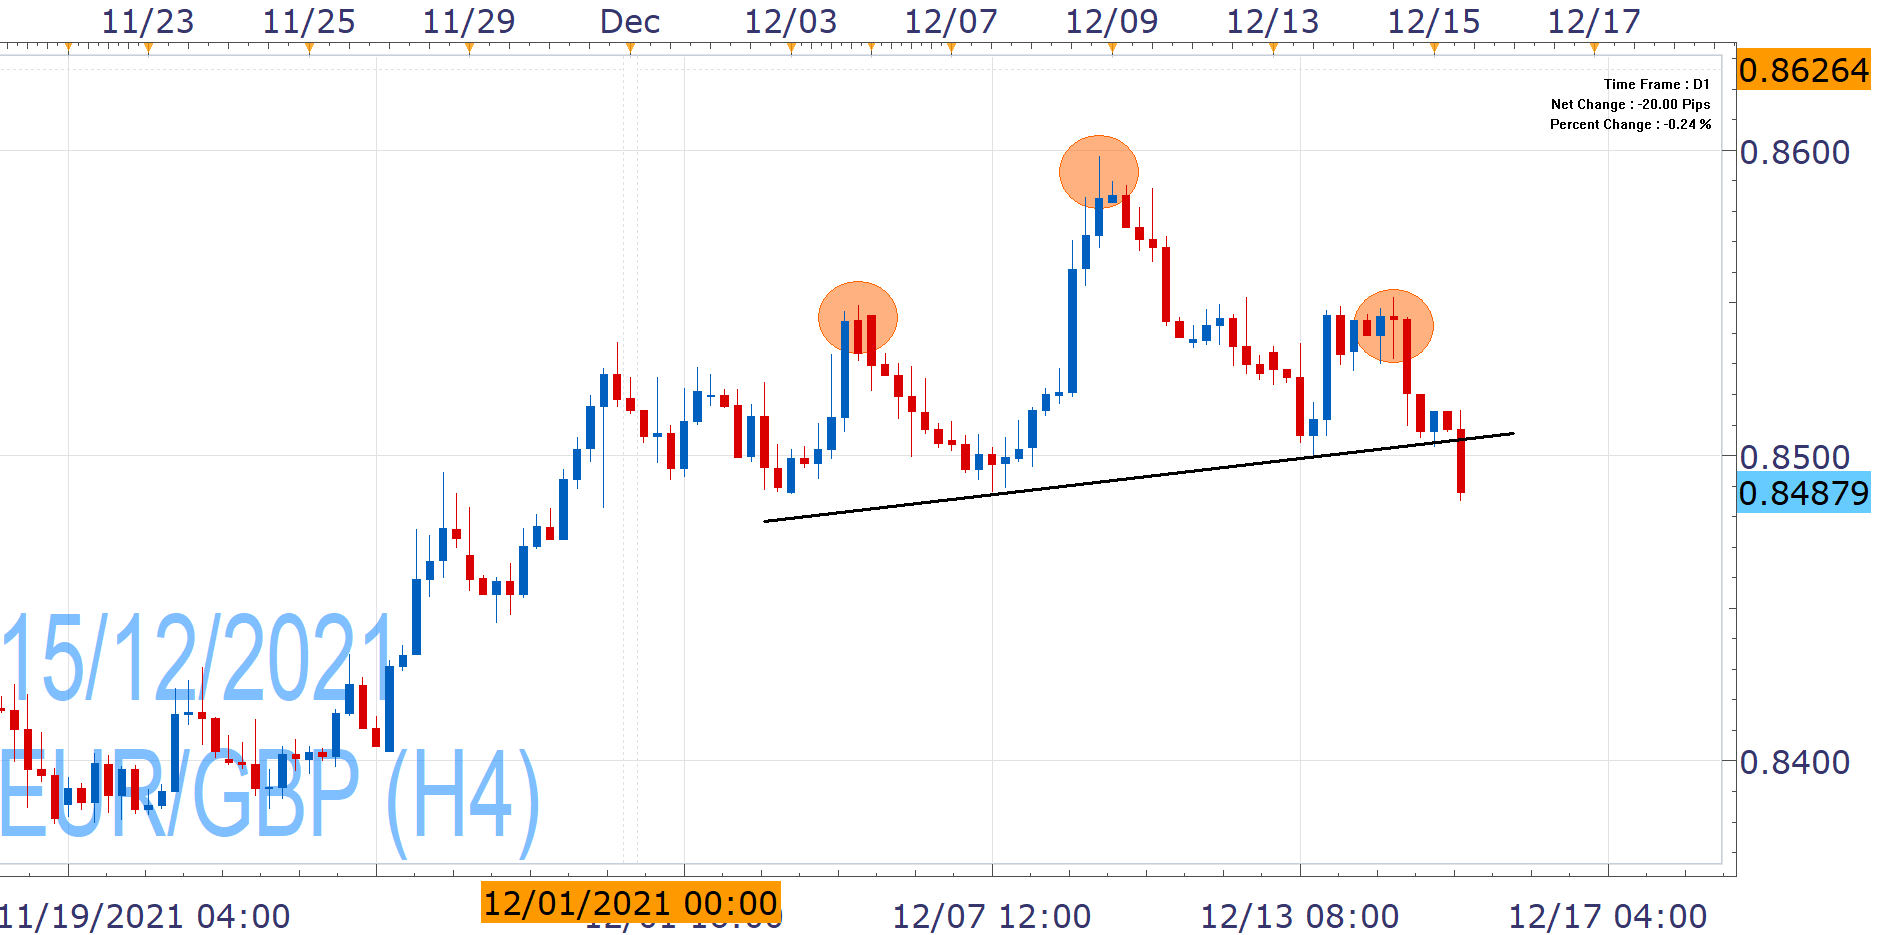
The pair drops to new December lows, following UK's CPI jump, which make it vulnerable 0.8445-31. Furthermore, the pair has formed a bearish Head and Shoulders formation and daily closes below the neck-line (black line) can provide confirmation and bring 0.8379 into the spotlight, with caution for pulls back needed.
Past Performance: Past Performance is not an indicator of future results.
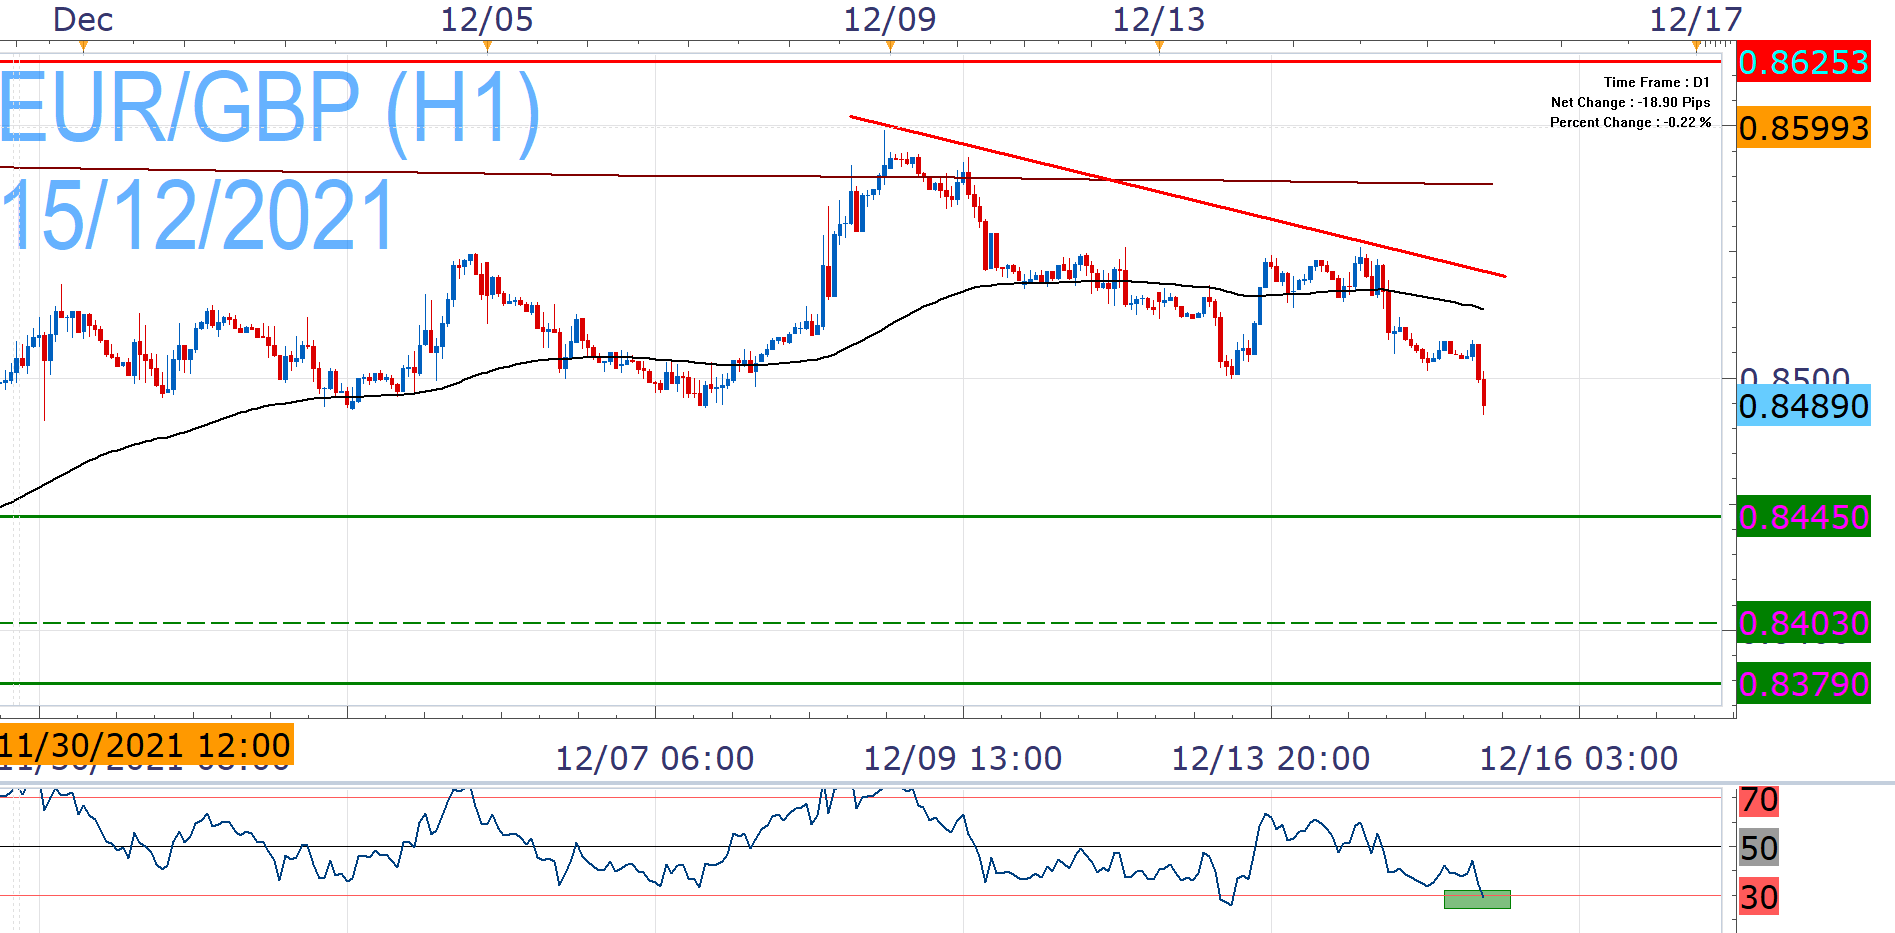
On the other hand, the Relative Strength Index (RSI) shows oversold conditions and the Euro has the ability to react higher. The broader 0.8530-51 region however, poses strong roadblocks, since it contains the EMA100, the descending trend-line from this month's high and the weekly highs. As such, a catalyst will be required for a break, that will put the common currency at the driver's seat and allow it to look again towards the 0.8590-0.8600 area.
Past Performance: Past Performance is not an indicator of future results.
The technical image may be very interesting, but the main drivers for the movement of the pair are likely going to be the central banks' decisions, that have the potential to spur volatility and produce outsized moves.
Apart from that, the economic calendar features a plethora of economic releases this week.
Nikos Tzabouras
Senior Financial Editorial Writer
Nikos Tzabouras is a graduate of the Department of International & European Economic Studies at the Athens University of Economics and Business. With extensive experience in market analysis and a strong foundation in international relations, he brings a unique perspective to financial markets. Nikos emphasizes not only technical analysis but also on fundamentals and the growing influence of geopolitics on financial trends.
As a Senior Financial Editorial Writer, he delivers comprehensive and forward-looking insights across a wide range of asset classes, including equities, commodities, and currencies. His work explores how macroeconomic events, political developments, and global policies impact market dynamics, providing readers with a deeper understanding of both short-term movements and long-term trends.
References
| Retrieved 02 Jul 2026 https://www.bankofengland.co.uk/-/media/boe/files/monetary-policy-report/2021/november/monetary-policy-report-november-2021.pdf |
Any opinions, news, research, analyses, prices, other information, or links to third-party sites contained on this website are provided on an "as-is" basis, as general market commentary and do not constitute investment advice. The market commentary has not been prepared in accordance with legal requirements designed to promote the independence of investment research, and it is therefore not subject to any prohibition on dealing ahead of dissemination. Although this commentary is not produced by an independent source, FXCM takes all sufficient steps to eliminate or prevent any conflicts of interests arising out of the production and dissemination of this communication. The employees of FXCM commit to acting in the clients' best interests and represent their views without misleading, deceiving, or otherwise impairing the clients' ability to make informed investment decisions. For more information about the FXCM's internal organizational and administrative arrangements for the prevention of conflicts, please refer to the Firms' Managing Conflicts Policy. Please ensure that you read and understand our Full Disclaimer and Liability provision concerning the foregoing Information, which can be accessed here.