UKOil Stabilises on Weekly Scale
Past performance is not an indicator of future results
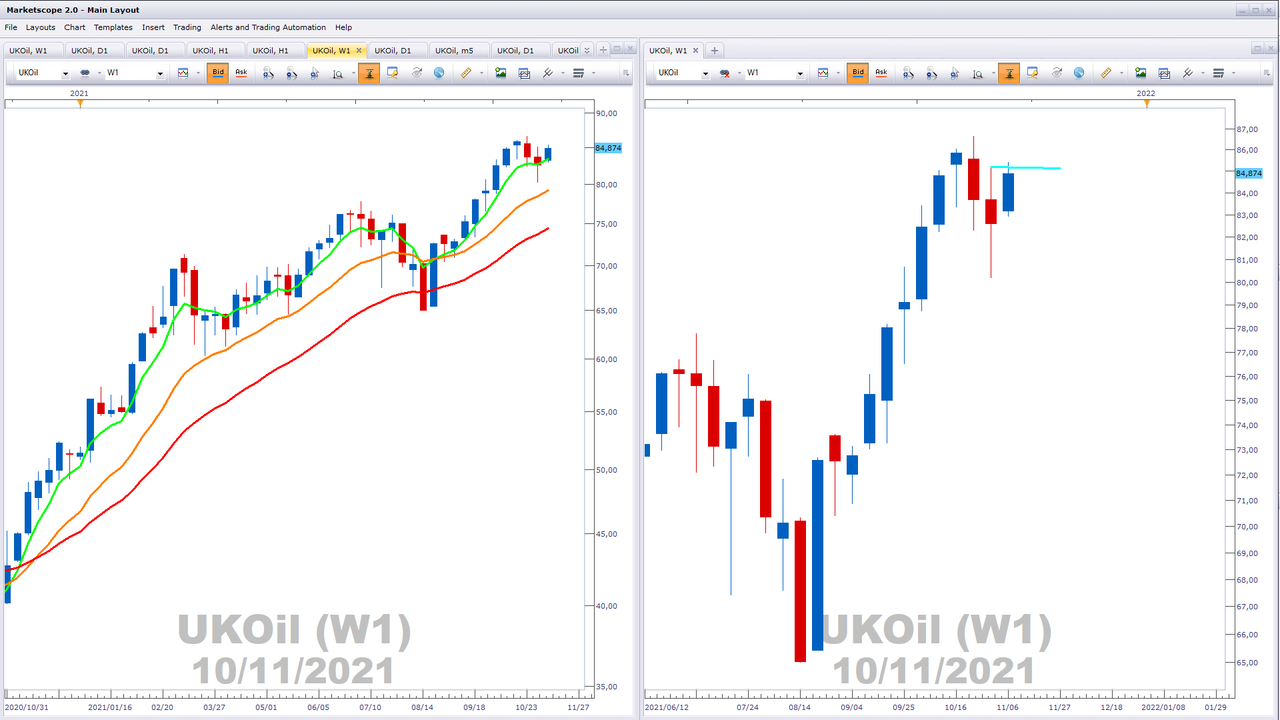
Further to our previous article, we consider UKOil's weekly scale (FXCM's proxy for Bent). After a pullback, UKOil has stabilised with the three EMAs (left chart) showing angle and separation. The right chart is also weekly, but we have zoomed in on the price action. A close above last week's high (aqua horizontal) is bullish, charting a reference low. This is foundational if an upswing is to develop, although it does not guarantee the upswing.

Past performance is not an indicator of future results
The daily chart has developed bullishly; the three moving averages shifted into a bullish formation. The shorter-term green moving average is above the orange mid-term moving average, and the orange mid-term moving average is above the red longer-term moving average. A potential "dip in the uptrend" scenario. Angle and separation will be a bullish development.
Past performance is not an indicator of future results
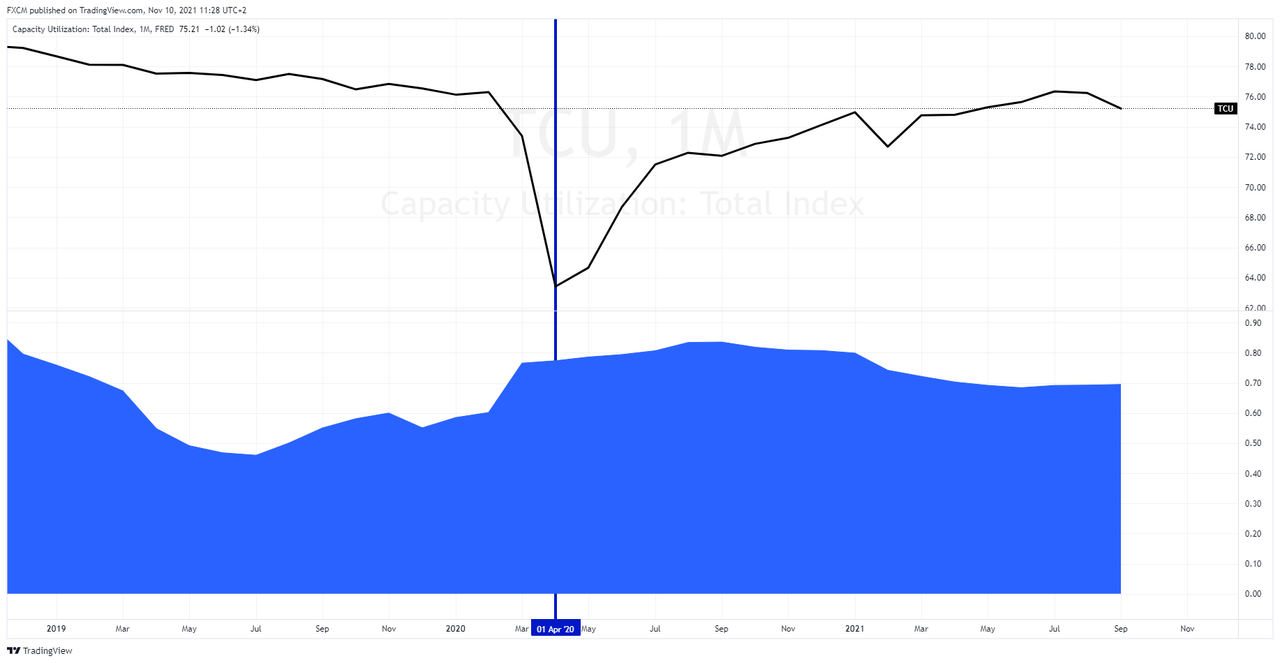
Source: www.tradingview.com
Current thinking is that energy prices are rising due to supply constraints. This is true, but it is not the entire picture. Energy prices are being driven by demand as well. Consider the above chart of total capacity utilisation for all industries ( the US series chosen as a proxy for global demand). The lower pane shows its correlation coefficient to Brent at around 0.7. The period post the pandemic low (blue vertical) shows a strong relationship between energy prices and the pick-up in demand.
Given that the activity in an industry such as airlines (and other heavy energy users) still has the capacity, pent-up demand is likely still present.
Russell Shor
Senior Market Strategist
Russell Shor is a Senior Market Strategist at FXCM, having been promoted to the role in 2025 in recognition of his depth of insight and consistent delivery of high-impact market analysis. He originally joined FXCM in October 2017 as a Senior Market Specialist.
Russell holds an Honours Degree in Economics from the University of South Africa, is a certified FMVA®, and a full member of the Society of Technical Analysts (UK). With over 20 years of experience in financial markets, his work is renowned for its clarity, precision, and strategic value across asset classes.
Any opinions, news, research, analyses, prices, other information, or links to third-party sites contained on this website are provided on an "as-is" basis, as general market commentary and do not constitute investment advice. The market commentary has not been prepared in accordance with legal requirements designed to promote the independence of investment research, and it is therefore not subject to any prohibition on dealing ahead of dissemination. Although this commentary is not produced by an independent source, FXCM takes all sufficient steps to eliminate or prevent any conflicts of interests arising out of the production and dissemination of this communication. The employees of FXCM commit to acting in the clients' best interests and represent their views without misleading, deceiving, or otherwise impairing the clients' ability to make informed investment decisions. For more information about the FXCM's internal organizational and administrative arrangements for the prevention of conflicts, please refer to the Firms' Managing Conflicts Policy. Please ensure that you read and understand our Full Disclaimer and Liability provision concerning the foregoing Information, which can be accessed here.