
Market Threads – Inflation, Oil and AI Pull Global Markets in Different Directions


Tracking important market threads across currencies, commodities, and indices.
- Oil at a crossroads, where fragile support, fading momentum and Strait of Hormuz tensions could set up the next big move.
- Can FXCM's USDOLLAR break 12,820? RSI momentum and Fed rate expectations are setting up a decisive test.
- XAUUSD's relief bounce is on trial as a bearish flag forms near $4,000 and rising rate bets keep gold under pressure.
- SPX500 faces a pivotal test at 7,615 as rising yields challenge the rebound and investors look for AI spending to deliver.
Cross-Asset View
Markets are being pulled in different directions. Hotter US inflation and hawkish Fed signals have lifted Treasury yields and kept the dollar firm, creating a headwind for gold and raising the bar for equity valuations. Oil has its own tug of war, with hopes for progress on Iran easing supply fears even as attacks on shipping keep disruption risks alive. Strong CoreWeave results have steadied some nerves about AI, but investors still want to see the industry's enormous spending translate into durable profits.
Oil
Technical Analysis
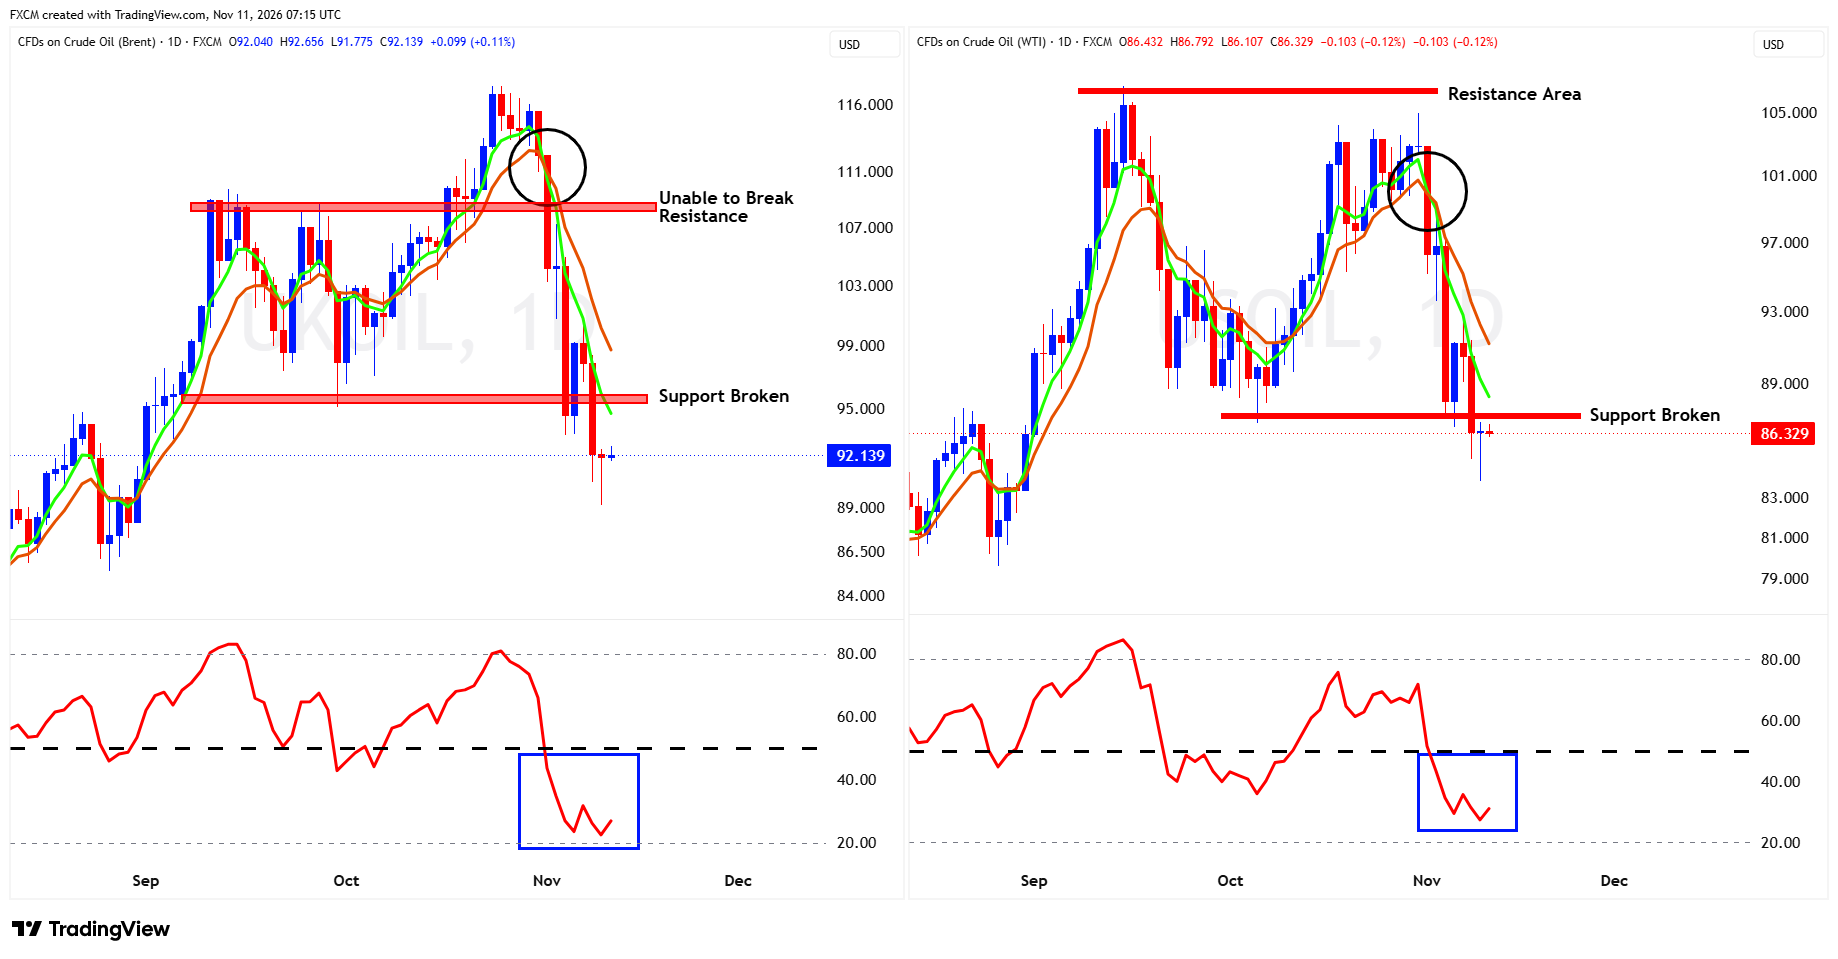
UKOil is trading near $92 after breaking below former support around $95–96, which now acts as resistance. The next visible support is around $89–90; a sustained move below that would weaken the chart further. The short-term moving averages have turned down, and RSI is well below 50. The longer the RSI stays below 50, the greater the downside pressure; a move back above 50 is needed for the bullish trend to reassert itself.
USOil is near $86.33, below the broken support area around $87–88, now a resistance zone. The chart's next visible support is roughly $83–84. Falling moving averages and an RSI below 50 keep the short-term picture bearish. As with UKOil, continued time with RSI below 50 would add to pressure on oil; a sustained bounce above 50 would be needed to signal that bullish momentum is returning.
Fundamental Perspective
Oil is being pulled in two directions. Hopes of a US Iran deal have eased some supply fears, while attacks on ships near the Strait of Hormuz keep the risk of disruption firmly in view. That uncertainty helped prices recover from Tuesday's lows. A preliminary industry estimate of a sharp rise in US crude stocks added pressure, though the EIA still points to tight inventories and ongoing supply risks. For now, diplomacy and the safety of tanker routes remain the key short-term drivers.
USDOLLAR
Technical Analysis
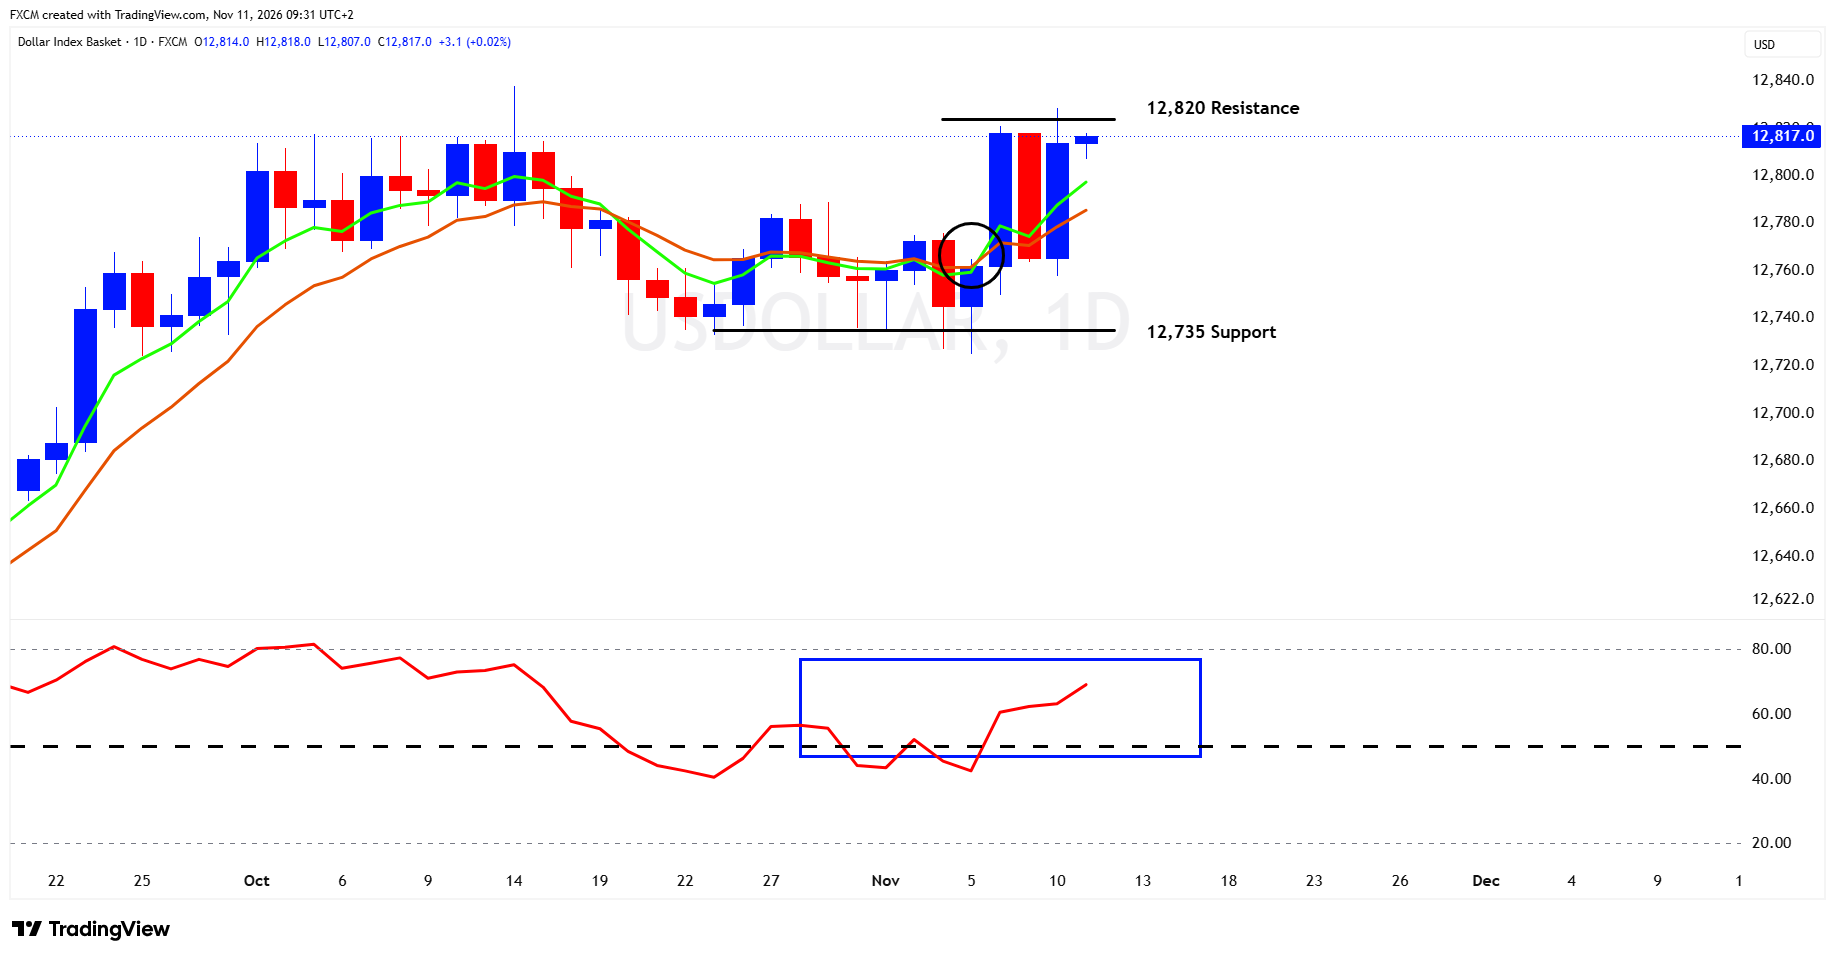
FXCM's USDOLLAR is pressing against resistance near 12,820, with the short term moving averages turning higher and RSI above 50. If resistance holds, a pullback could test support around 12,760, followed by stronger support near 12,735. The chart's support line sits around 12,735. If the RSI holds above 50, resistance is likely to be broken as momentum will support the upside.
Fundamental Perspective
The dollar has found support as investors rethink the Fed's next move. October inflation came in hotter than expected, and Fed officials have sounded uneasy about price pressures staying high. That pushed Treasury yields higher and strengthened expectations for a December rate increase, giving the dollar a lift. The next test is whether incoming data keeps those rate expectations firm.
Gold
Technical Analysis
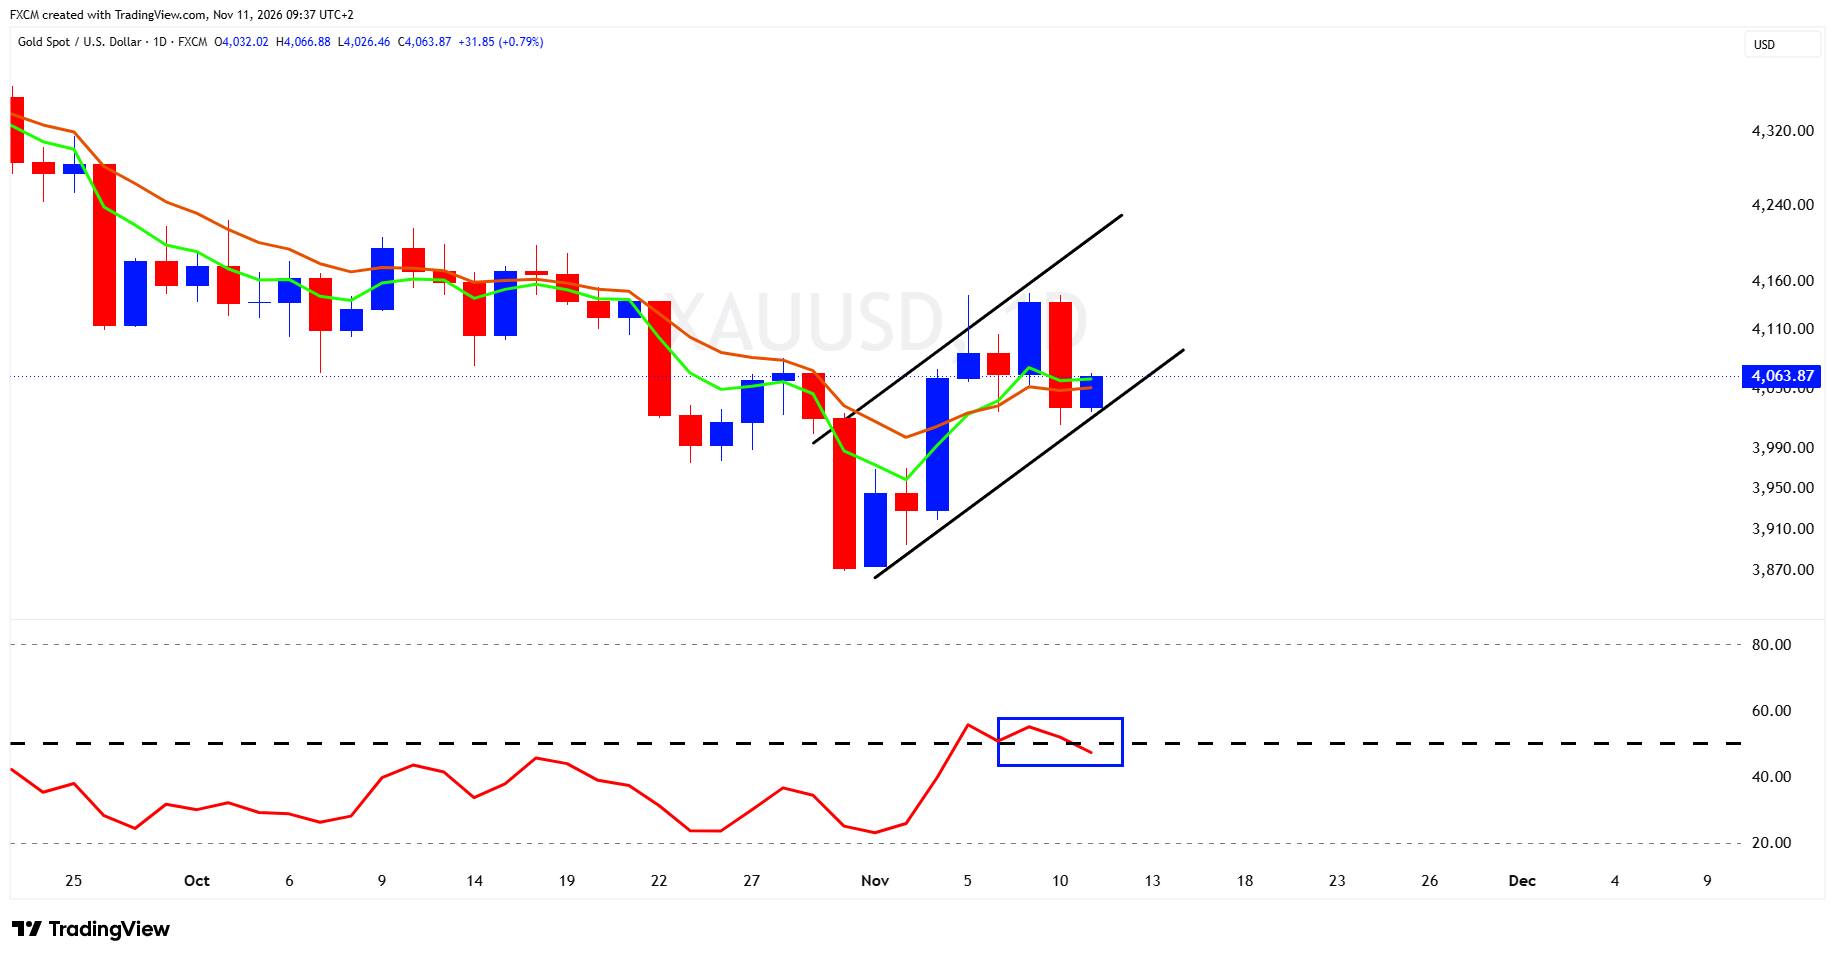
XAUUSD remains in a broader downtrend, and the recent climb is taking shape as a possible bearish flag. The pattern is not confirmed, but RSI has slipped below 50, which weakens the recovery. A decisive break below the flag's rising lower boundary near $4,000 would be a negative signal, with the recent swing low around $3,870 as a further support area. Until then, the flag remains a developing setup rather than a confirmed breakdown.
Fundamental Perspective
The main weight on gold is the changing outlook for US interest rates. October inflation came in hotter than expected, and hawkish Fed comments pushed Treasury yields and the dollar higher, making non-yielding gold less attractive. Gold has edged up today after Tuesday's sharp selloff, but that looks like a modest recovery while rate expectations remain a headwind.
Index in Focus: SPX500
Technical Analysis
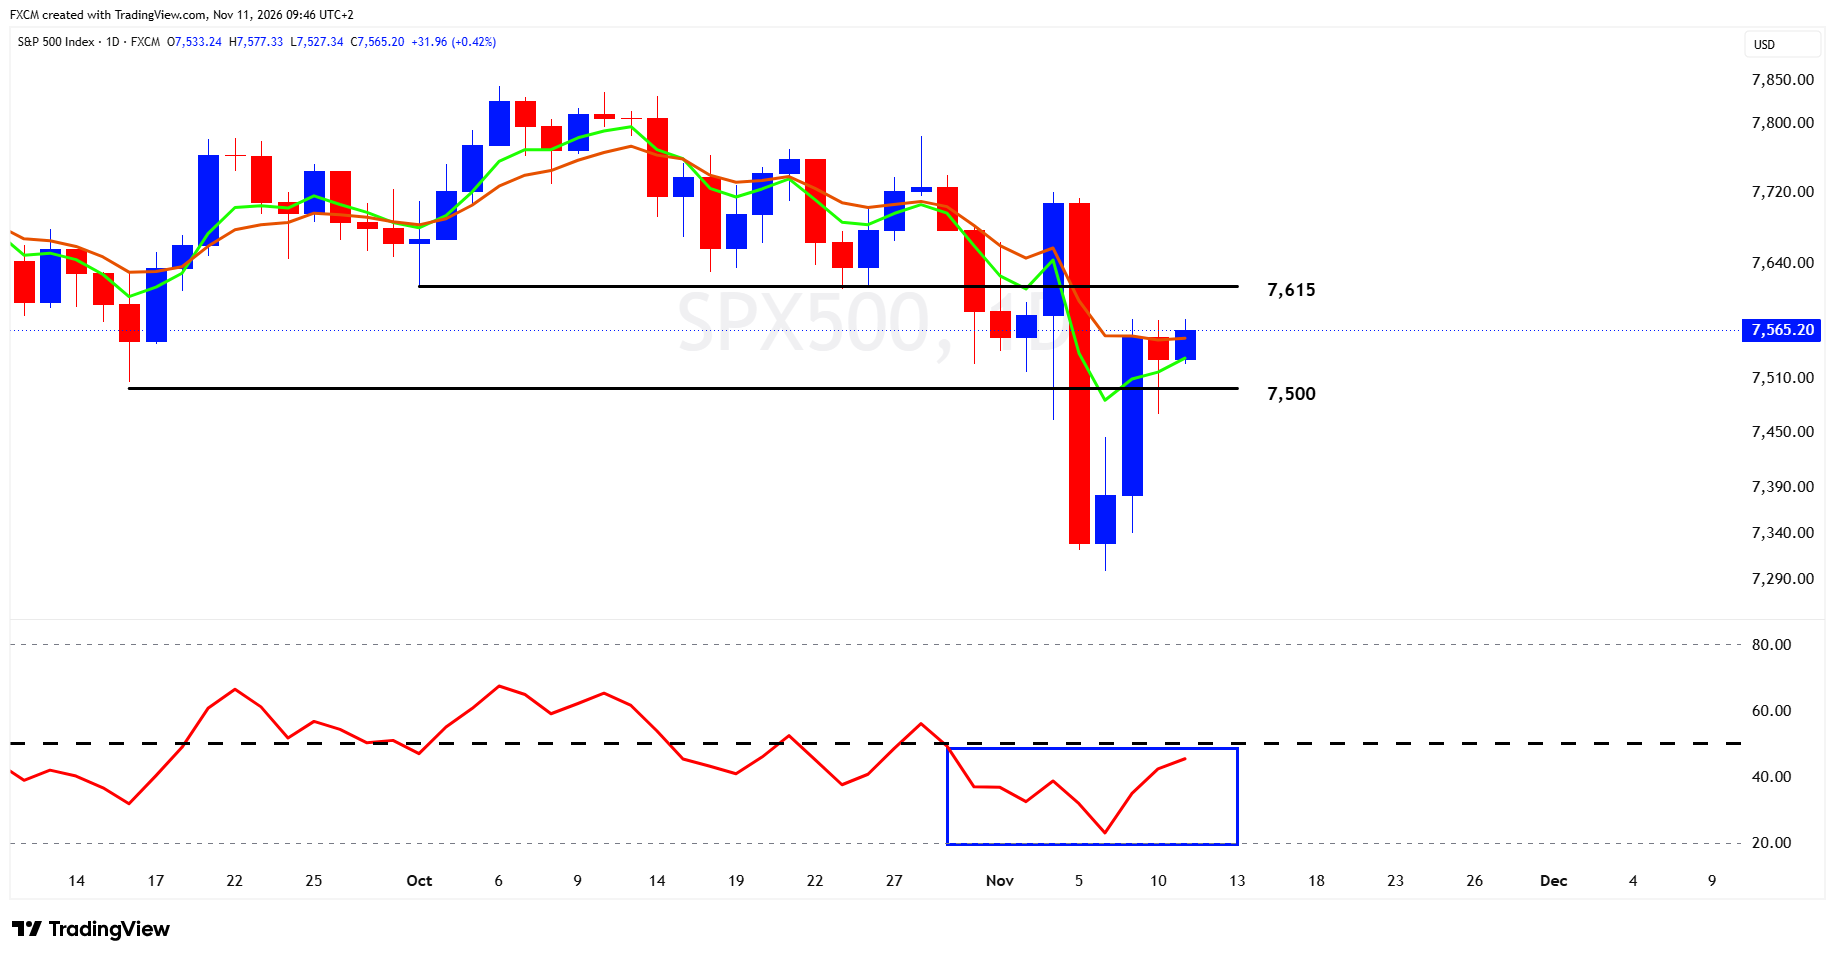
SPX500 is holding above 7,500, but at 7,565 it remains below resistance near 7,615. RSI has recovered into the mid-40s but is still under 50, while the faster EMA remains just below the slower one. A close above 7,615 would strengthen the recovery and put 7,700 in view. A fall back below 7,500 would weaken it and bring the recent low near 7,300 back into focus.
Fundamental Perspective
The immediate pressure on the S&P 500 is coming from interest rates. Hotter than expected inflation and hawkish Fed comments sent Treasury yields higher, making investors more cautious about expensive growth stocks. The AI picture is less one sided. CoreWeave's results and stronger outlook point to real demand, but Nvidia's company specific troubles and questions about the cost and payoff of AI investment are keeping the trade unsettled. For now, the market wants proof that strong AI spending can turn into lasting earnings.

Russell Shor
Senior Market Strategist
Russell Shor is a Senior Market Strategist at FXCM, having been promoted to the role in 2025 in recognition of his depth of insight and consistent delivery of high-impact market analysis. He originally joined FXCM in October 2017 as a Senior Market Specialist.
Russell holds an Honours Degree in Economics from the University of South Africa, is a certified FMVA®, and a full member of the Society of Technical Analysts (UK). With over 20 years of experience in financial markets, his work is renowned for its clarity, precision, and strategic value across asset classes.


Any opinions, news, research, analyses, prices, other information, or links to third-party sites contained on this website are provided on an "as-is" basis, as general market commentary and do not constitute investment advice. The market commentary has not been prepared in accordance with legal requirements designed to promote the independence of investment research, and it is therefore not subject to any prohibition on dealing ahead of dissemination. Although this commentary is not produced by an independent source, FXCM takes all sufficient steps to eliminate or prevent any conflicts of interests arising out of the production and dissemination of this communication. The employees of FXCM commit to acting in the clients' best interests and represent their views without misleading, deceiving, or otherwise impairing the clients' ability to make informed investment decisions. For more information about the FXCM's internal organizational and administrative arrangements for the prevention of conflicts, please refer to the Firms' Managing Conflicts Policy. Please ensure that you read and understand our Full Disclaimer and Liability provision concerning the foregoing Information, which can be accessed here.