Market Threads: Oil Holds Steady, For Now

Tracking important market threads across currencies, commodities, and indices.
- Oil momentum cooling: Bearish technicals and backwardation point to softer prices ahead, with easing geopolitical tensions likely to drive downside risk.
- USDOLLAR losing momentum: Breakdown in trend and RSI below 50 signal weakness, with easing oil prices and fading Fed hawkishness reducing safe-haven demand.
- Gold may be regaining momentum: Bullish technicals and easing yields support a constructive outlook, with RSI holding above 50 key to sustaining upside conviction.
- JPN225 breakout in focus: Bullish wedge breakout, strong momentum above RSI 50, and structural reforms support upside, with 60,000 the key level to watch.
The oil shock appears to be stabilising, at least for now. Following UKOIL's near-9% drop on 8 April and US Oil's decline of around 12.5%, prices have steadied and largely traded sideways. Although the first round of US-Iran talks over the weekend ended without agreement, both parties appear to be working towards a second round, which is lending some calm to energy markets.
Cross-Asset View
Financial markets have shifted to a risk-on stance, with risk assets performing well and havens lagging. This is largely attributable to the stabilisation in oil markets, as well as the potential for the Q1 earnings season to provide further support for equities. The broader SPX500 is now trading above the levels seen prior to the outbreak of the Iran conflict. Furthermore, the index has rallied close to 10% from its low around 31 March, making April a particularly lucrative month for shares. If this trend continues it will have an affect on the instruments we cover in Market Threads.
Oil
Technical Analysis
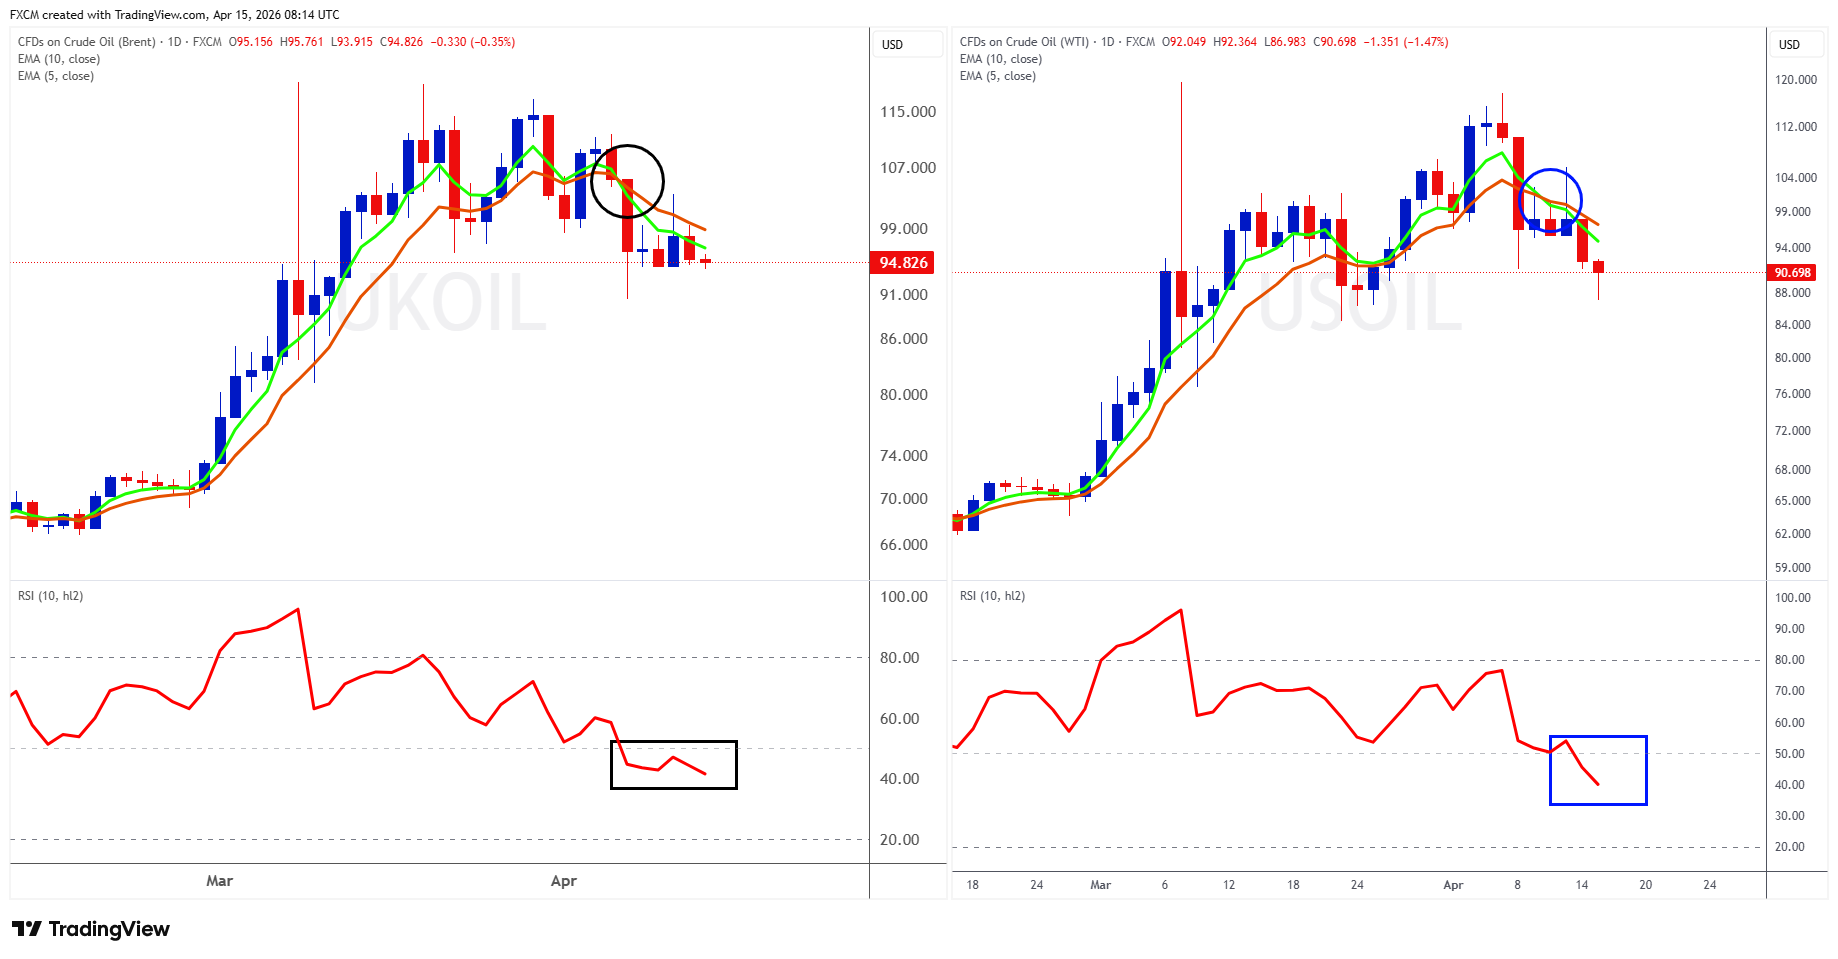
Our oil instruments have shifted their bias from an outright uptrend to a more benign technical picture. Our proxy for Brent, UKOIL, is on the left, and our proxy for WTI, USOIL, is on the right.
Both instruments have their EMAs in a bearish formation and, importantly, their respective RSIs are below 50. At the very least, this suggests that upside momentum has waned. Should the RSIs remain below 50, momentum will actually turn downwards — a significant shift from what we observed during March. If, however, the RSIs oscillate around their respective 50 levels, we would most likely expect the oil instruments to trade sideways.
Fundamental Perspective
Markets tend to be forward-looking. Interestingly, oil futures are currently in backwardation, meaning future contracts are priced lower than the current contract. This implies, though does not guarantee, that the market anticipates oil prices will fall in due course.
This does appear to make sense. The Iran conflict will end at some point and the Strait of Hormuz will reopen; the key variable here is timing. The sooner this occurs, the greater the probability of a decline in oil prices. A prolonged standoff and a blocked Strait, however, would remain supportive of prices. The fact that the US and Iran appear to be pressing ahead with another round of peace talks does lend weight to the thesis that oil prices will decline over time — though this ultimately rests on whether a sound resolution is reached. Any escalation would alter the technical picture outlined above, and we remain vigilant to this possibility.
The USDOLLAR
Technical Analysis
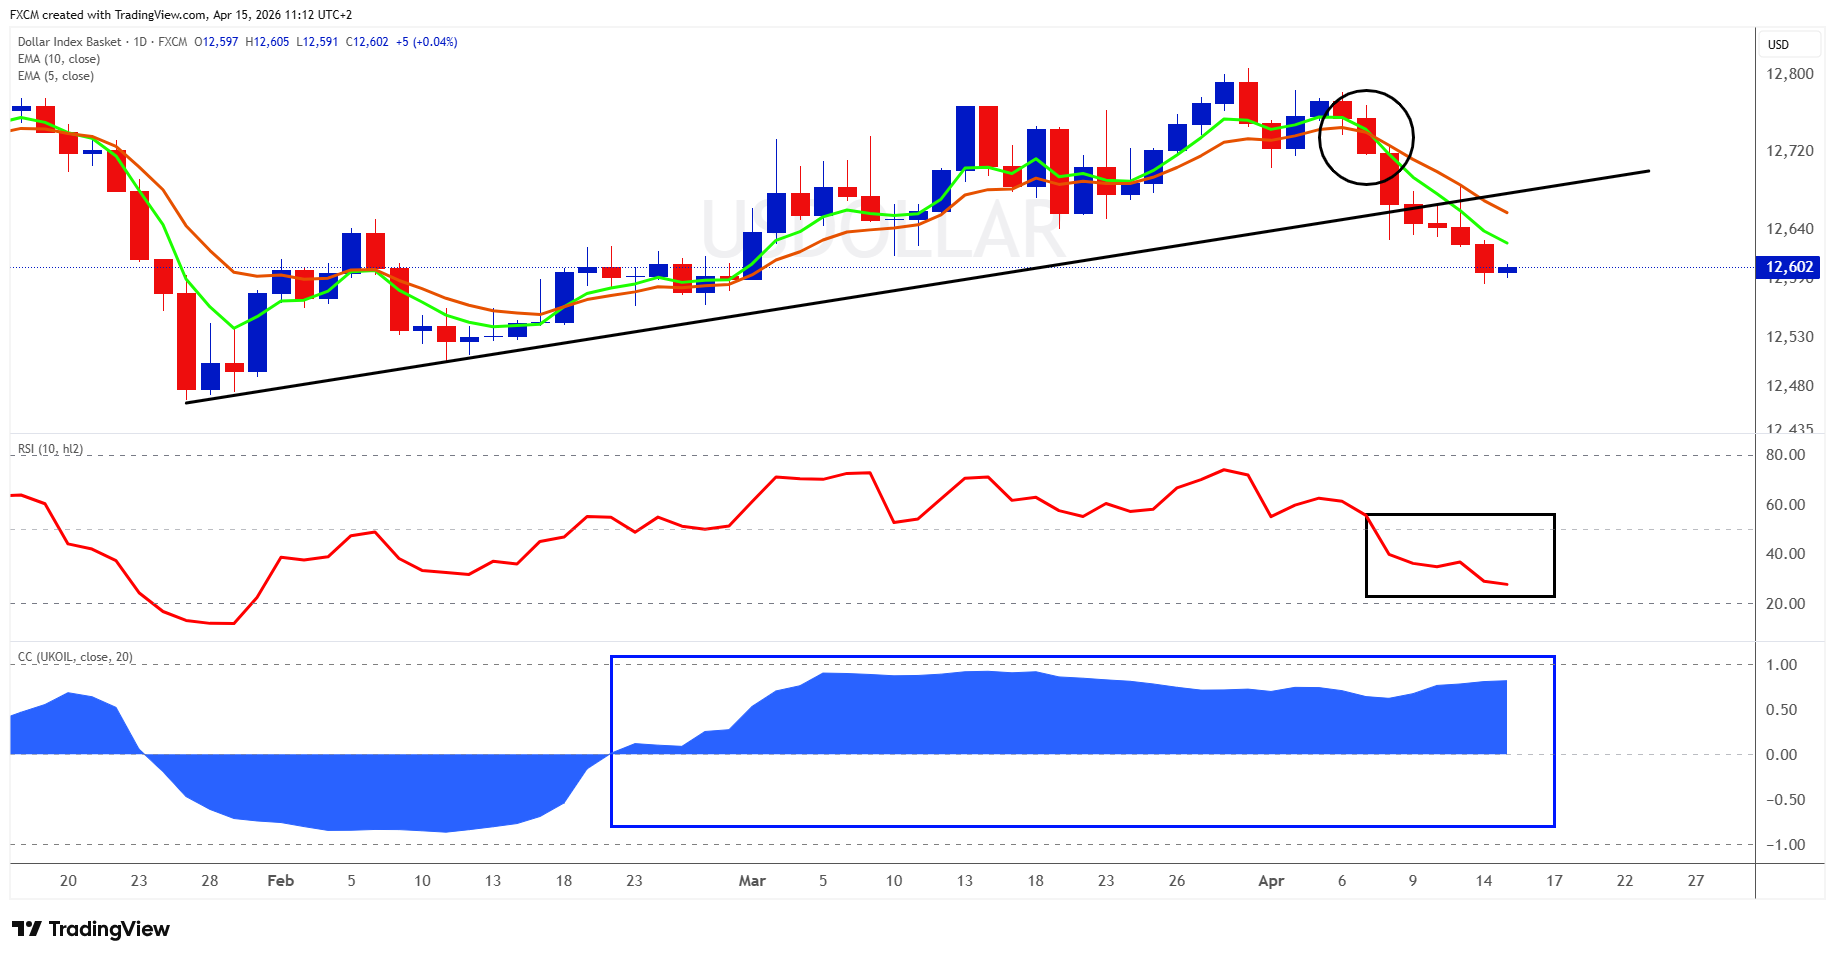
FXCM's USDOLLAR basket trended upwards from the end of January through to the end of March, before declining into April, having served as the safe-haven of choice this year. Prior to the Iran conflict, markets were concerned about the exorbitant capital expenditure being committed by the hyperscalers.
The period of the conflict itself, however, proved particularly revealing. The lower indicator displays USDOLLAR's correlation coefficient with oil, and the outbreak of hostilities saw this correlation trending towards 1 (blue rectangle), suggesting the greenback had effectively anchored itself to the price of oil.
As noted above, oil prices have since been normalising, and the greenback has weakened considerably in tandem. It has broken its black uptrend line, suggesting upside momentum has faltered; its EMAs have turned lower and, importantly, the RSI has dropped below 50 (black rectangle). As long as it remains below 50, the USDOLLAR will remain under pressure.
Furthermore, if the correlation with oil holds, any decline in oil prices should weigh on the greenback accordingly, implying that demand for the dollar as a safe haven is gradually waning. Of course, any escalation in the conflict and a subsequent rise in oil prices would likely produce the opposite effect.
Fundamental Perspective
One of the key drivers of recent USDOLLAR behaviour has been the inflationary impact of higher oil prices. Following the outbreak of the Iran conflict, the surge in oil raised inflation concerns and led markets to sharply scale back expectations for Fed rate cuts, with pricing shifting from multiple cuts to very few or none, and even briefly reflecting the risk of hikes. This repricing supported the dollar. As tensions have eased and oil prices have stabilised, those hawkish risks have faded and some easing expectations have returned, leading to a softer dollar.
In essence, the relationship is clear: the conflict pushed oil higher, which reduced the likelihood of Fed cuts and lifted the USDOLLAR, while easing tensions have partially reversed that dynamic.
Some Currencies to Keep an Eye On
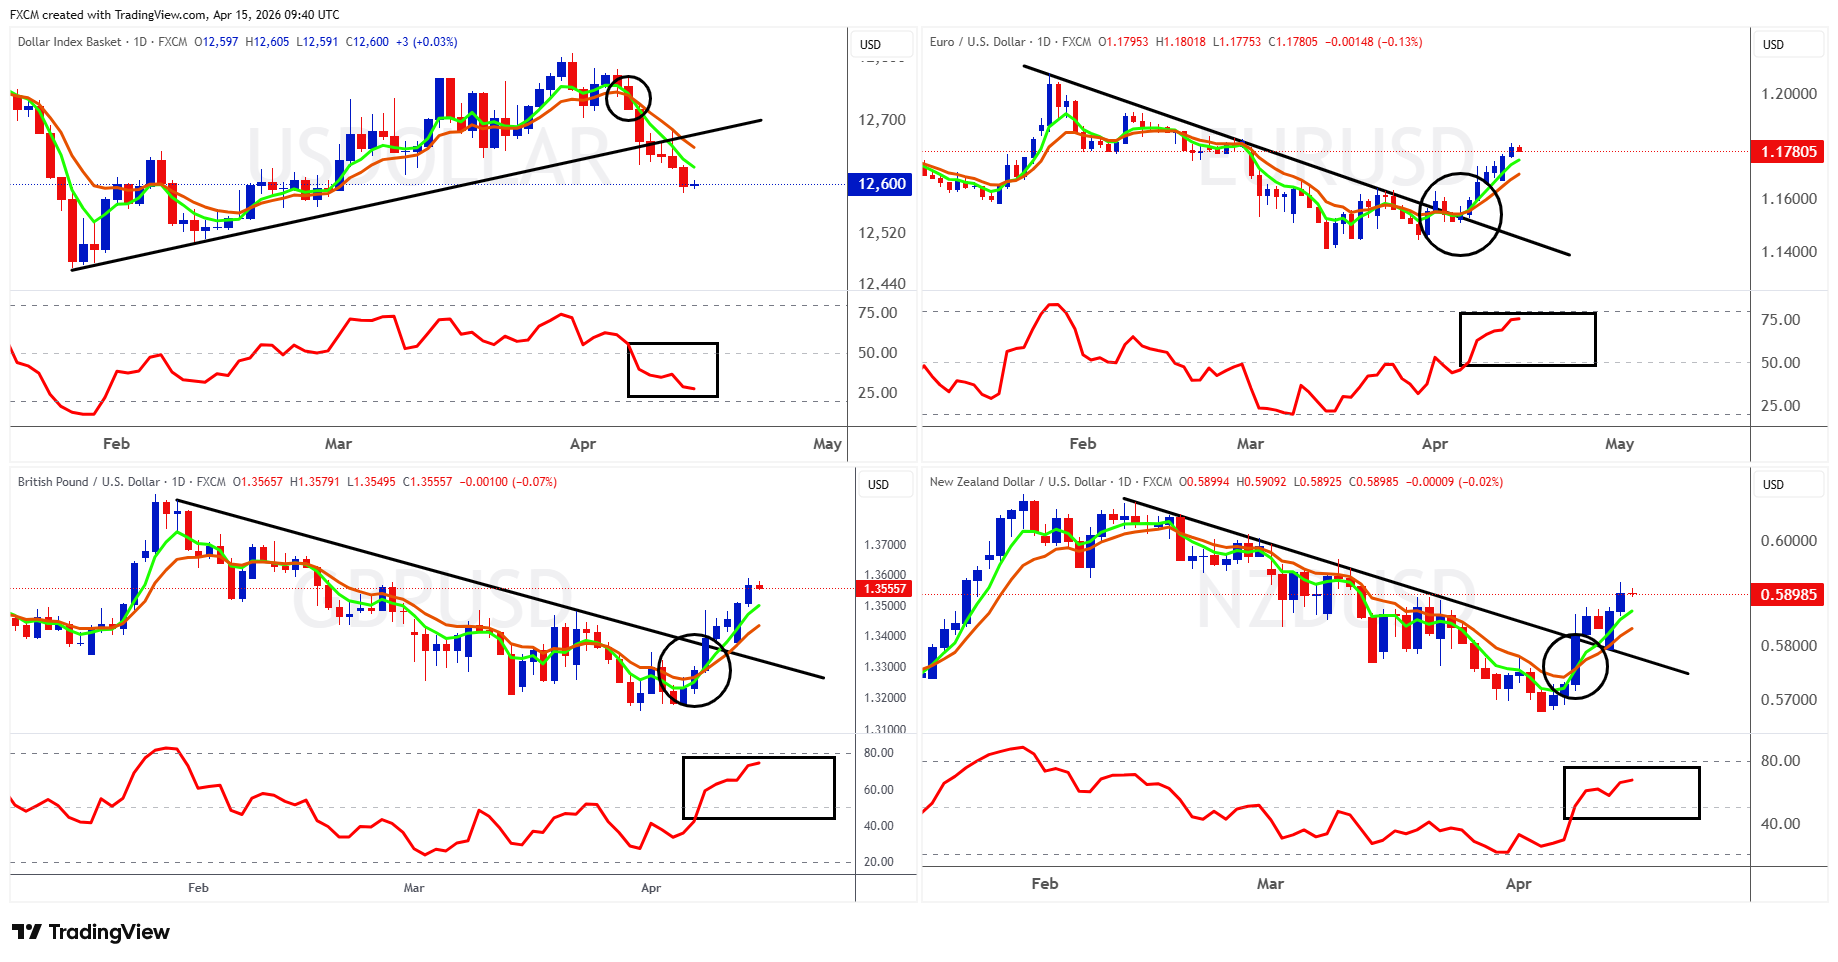
Whilst not exhaustive, the charts here highlight three currency pairs that appear to be driven by USDOLLAR dynamics. The top left shows the USDOLLAR index, while the top right, bottom left, and bottom right display EURUSD, GBPUSD, and NZDUSD respectively.
What stands out is that EURUSD, GBPUSD, and NZDUSD are effectively mirror images of the USDOLLAR, which is consistent with the dollar index being a measure of USD strength against major currencies .
All three pairs have broken above their respective downtrend lines, their EMAs have turned bullish, and their RSIs have moved above 50. As long as RSI holds above this level, the momentum in EURUSD, GBPUSD, and NZDUSD is likely to remain supported to the upside.
Gold
Technical Analysis
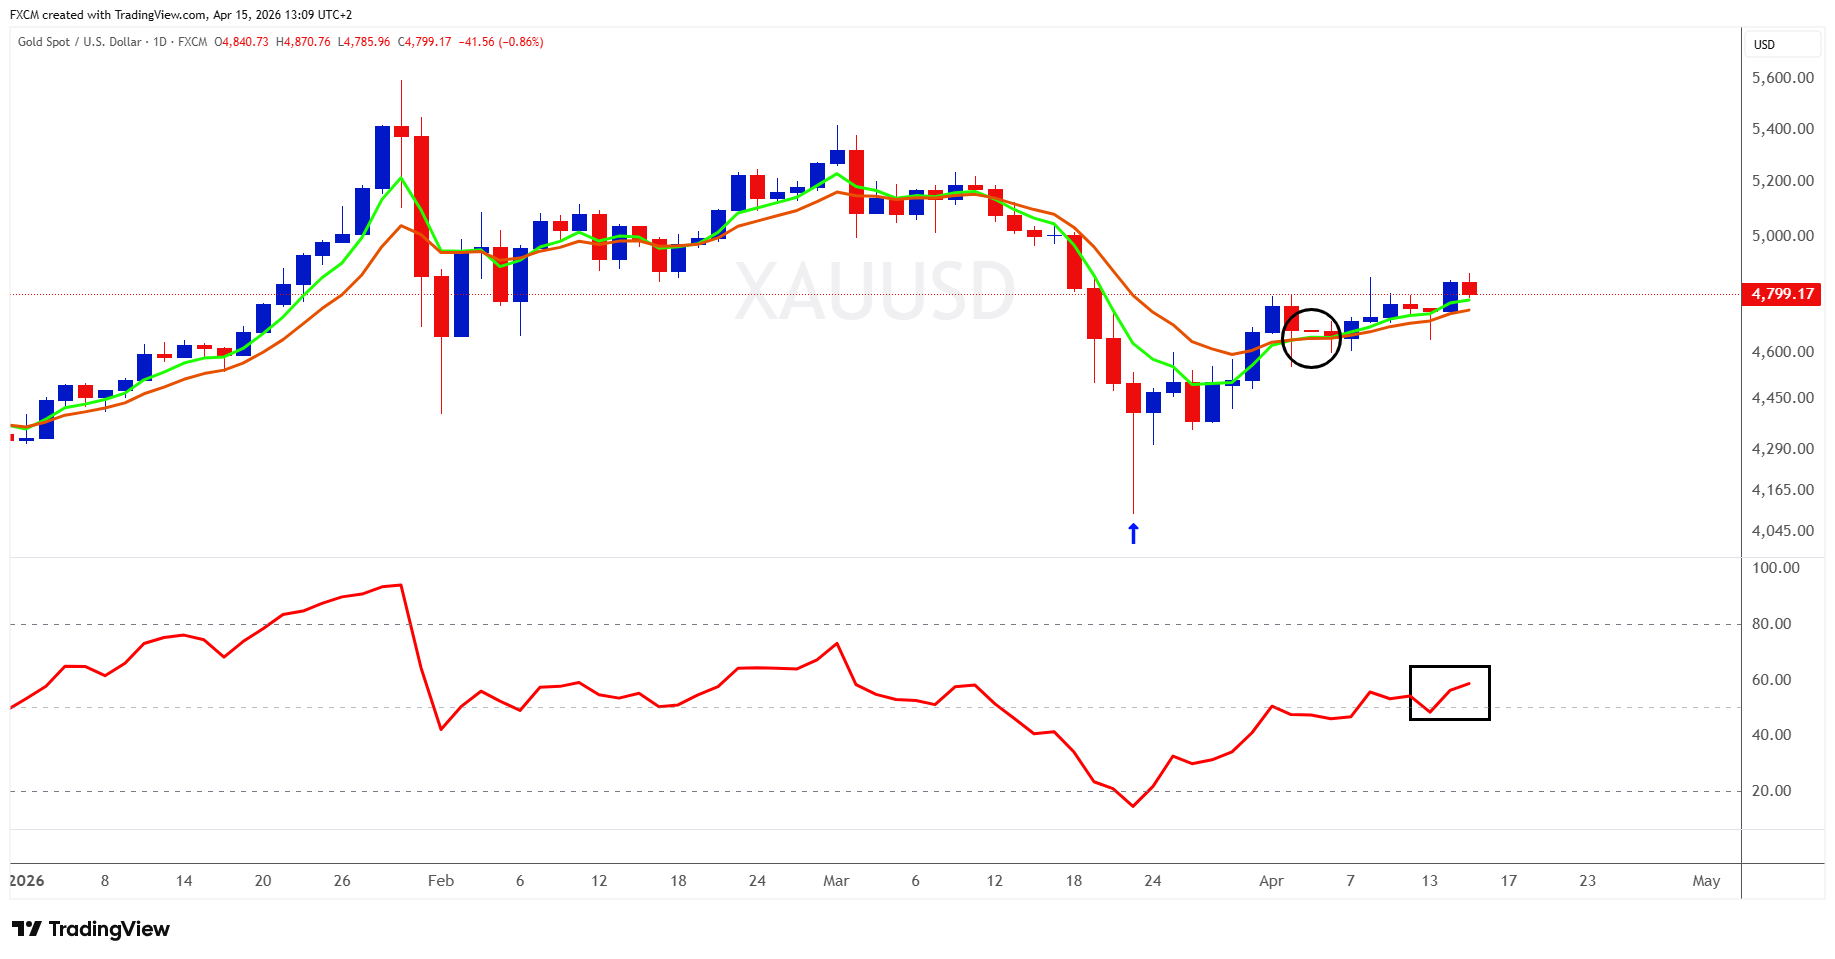
Gold's technical picture looks constructive at present, with its EMAs in a bullish formation and its RSI above 50. Should the RSI maintain this level, underlying momentum will remain positive and continue to support the yellow metal.
Gold sold off sharply throughout March, reaching its nadir on the 23rd. The candle printed on that day formed a hammer (blue arrow), a pattern in which bears lost control at the day's low, with bulls stepping in to close the price well off its lows. The bulls have continued to exert themselves since, and should the EMAs begin to show greater angle and separation in the coming days, bullish conviction would appear to be building.
Fundamental Perspective
Gold behaved somewhat unexpectedly during March. As the conflict continued, yields began to rise in anticipation of inflationary pressures; the resulting demand for the dollar gained traction and gold began to fall with a notable lag, selling off quite markedly from 18 March before reaching its low a few days later.
Nevertheless, as yields have begun to taper, a second round of peace talks edges closer to fruition, and the prospect of a more dovish monetary policy becomes increasingly apparent, gold is responding accordingly. Should this trajectory continue, the outlook for the yellow metal is likely to remain positive. As ever, the RSI will be the key indicator to watch, it must hold above 50 to suggest the market retains its conviction.
Index in Focus: JPN225
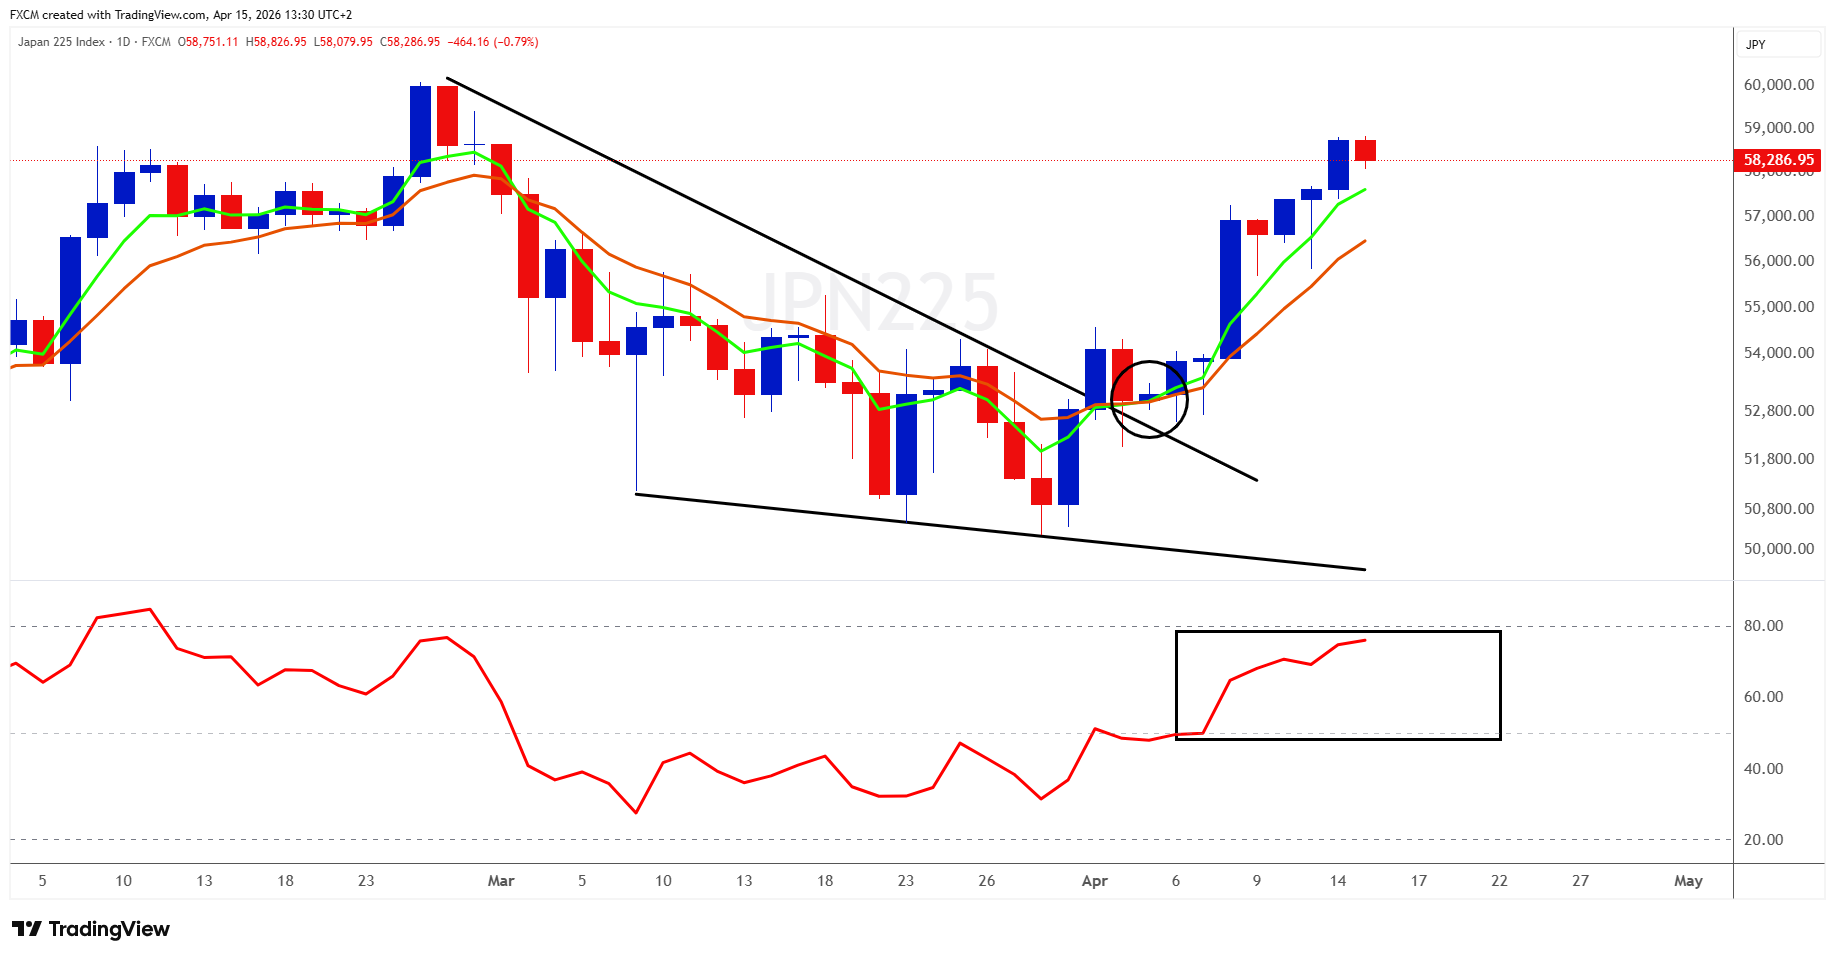
Technical Analysis
The JPN225 has broken out of a falling wedge, a bullish continuation pattern, and the EMAs have responded accordingly, crossing bullishly with good angle and separation. Importantly, the RSI has pushed above 50 and is holding; as long as it maintains this level, the index will retain underlying momentum support.
The 60,000 level will prove a significant psychological barrier, but provided momentum holds, the index looks well placed to challenge this key overhead resistance. A break above would be considered a positive development.
Fundamental Perspective
The bullish case for the JPN225 rests on structural reform, improving macro dynamics, and supportive capital flows rather than short-term geopolitics. Japanese corporates are genuinely improving capital efficiency, lifting shareholder returns, and driving stronger profitability, underpinning the market's re-rating. Meanwhile, the economy has transitioned from deflation into a sustainable inflation regime of around 2%, allowing firms to grow earnings in a manner not possible for decades.
Foreign investor interest remains strong but not fully saturated, leaving room for further inflows, with consensus expectations continuing to point to medium-term upside. Whilst the Iran conflict has weighed on sentiment through higher energy costs, particularly given Japan's reliance on oil imports, this represents a cyclical headwind rather than a structural break. The prospect of peace talks, the eventual reopening of the Strait of Hormuz, and ultimately lower oil prices would serve as potential additional tailwinds for the index.
Russell Shor
Senior Market Strategist
Russell Shor is a Senior Market Strategist at FXCM, having been promoted to the role in 2025 in recognition of his depth of insight and consistent delivery of high-impact market analysis. He originally joined FXCM in October 2017 as a Senior Market Specialist.
Russell holds an Honours Degree in Economics from the University of South Africa, is a certified FMVA®, and a full member of the Society of Technical Analysts (UK). With over 20 years of experience in financial markets, his work is renowned for its clarity, precision, and strategic value across asset classes.
Any opinions, news, research, analyses, prices, other information, or links to third-party sites contained on this website are provided on an "as-is" basis, as general market commentary and do not constitute investment advice. The market commentary has not been prepared in accordance with legal requirements designed to promote the independence of investment research, and it is therefore not subject to any prohibition on dealing ahead of dissemination. Although this commentary is not produced by an independent source, FXCM takes all sufficient steps to eliminate or prevent any conflicts of interests arising out of the production and dissemination of this communication. The employees of FXCM commit to acting in the clients' best interests and represent their views without misleading, deceiving, or otherwise impairing the clients' ability to make informed investment decisions. For more information about the FXCM's internal organizational and administrative arrangements for the prevention of conflicts, please refer to the Firms' Managing Conflicts Policy. Please ensure that you read and understand our Full Disclaimer and Liability provision concerning the foregoing Information, which can be accessed here.