Market Threads: Calm Before the Storm?

Tracking important market threads across currencies, commodities, and indices.
- Oil sits at a crossroads: UKOIL stabilising, USOIL still bearish, with Iran tensions set to decide the next move.
- Dollar downside holds for now, tightly linked to oil, with easing tensions pointing lower but escalation a clear upside risk.
- Gold is losing momentum, with technicals weakening and oil-driven macro forces set to dictate the next move.
- Above 7,000 and firmly overbought, some normalisation looks likely, with the SPX500 potentially taking its next cue from oil.
Cross-Asset View
Although correlation is not causation, oil appears to be the first link in a chain, with its direction likely to influence other financial instruments. For now, the initial shock is easing as markets digest the possibility of renewed peace talks and, ultimately, the reopening of the Strait of Hormuz. If that scenario unfolds, oil prices would likely soften, and that relief could ripple through broader markets.
Across the instruments analysed below, conditions feel relatively calm, with many effectively waiting for a clearer signal from oil. The exception is the SPX500, which has delivered a remarkably strong April, rising close to 9%. Meanwhile, both the dollar and gold are showing a notable drop in volatility, raising the question of whether this is simply a period of calm before a more decisive move.
Oil
Technical Analysis
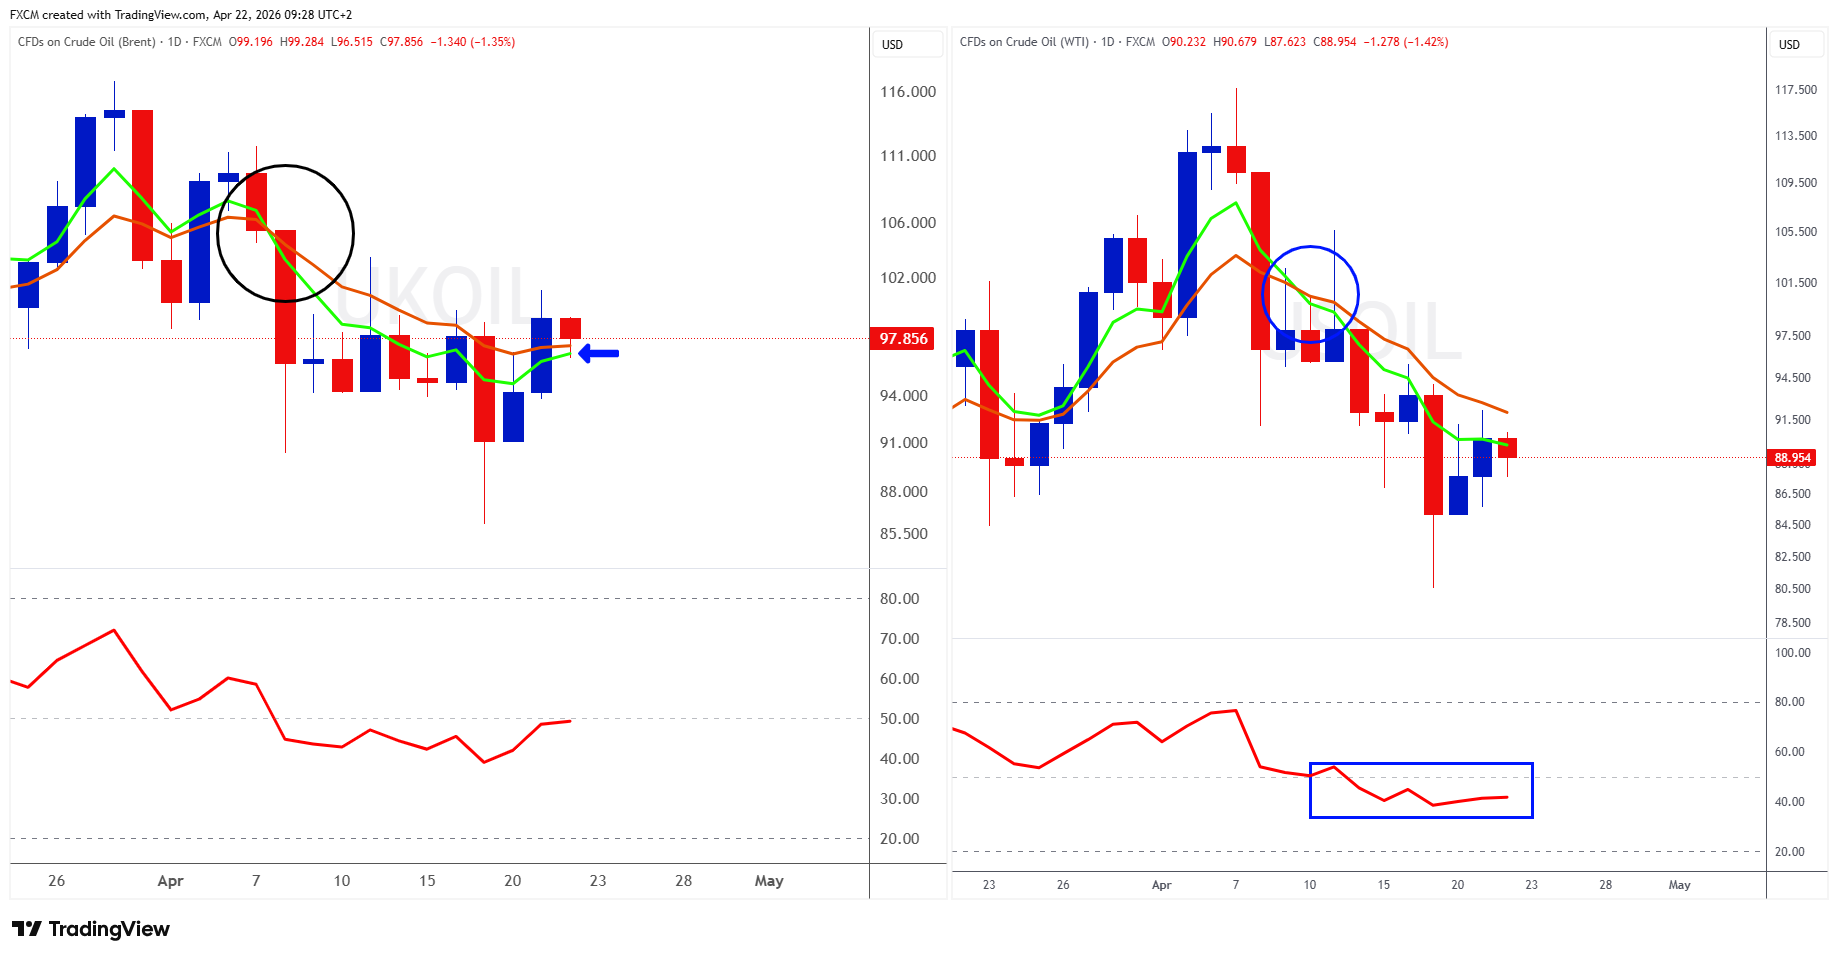
The left chart shows FXCM's Brent proxy (UKOIL), while the right displays its WTI proxy (USOIL). Both remain in bearish EMA formations, though UKOIL's averages are beginning to converge (blue arrow). Its RSI is hovering near 50, and sustained movement around that level would point to consolidation.
USOIL, by contrast, retains a clear downside bias. Its EMAs remain decisively bearish, with strong angle and separation, while the RSI is still firmly below 50, signalling continued downside momentum.
Fundamental Perspective
The Iran conflict remains the dominant driver. President Donald Trump has extended the ceasefire indefinitely, while Iran has indicated it has received "some sign" that the US may lift its blockade, potentially reopening the door to peace talks. That said, despite the ceasefire, the US continues to block Iranian ships until discussions are concluded one way or another.
This ongoing back-and-forth, and the resulting constraint on oil flows through the Strait of Hormuz, is driving the convergence in UKOIL's EMAs. Clear progress towards a lasting agreement would likely ease that pressure.
While there are signs of progress towards renewed negotiations, any escalation would almost certainly push oil prices higher.
The USDOLLAR
Technical Analysis
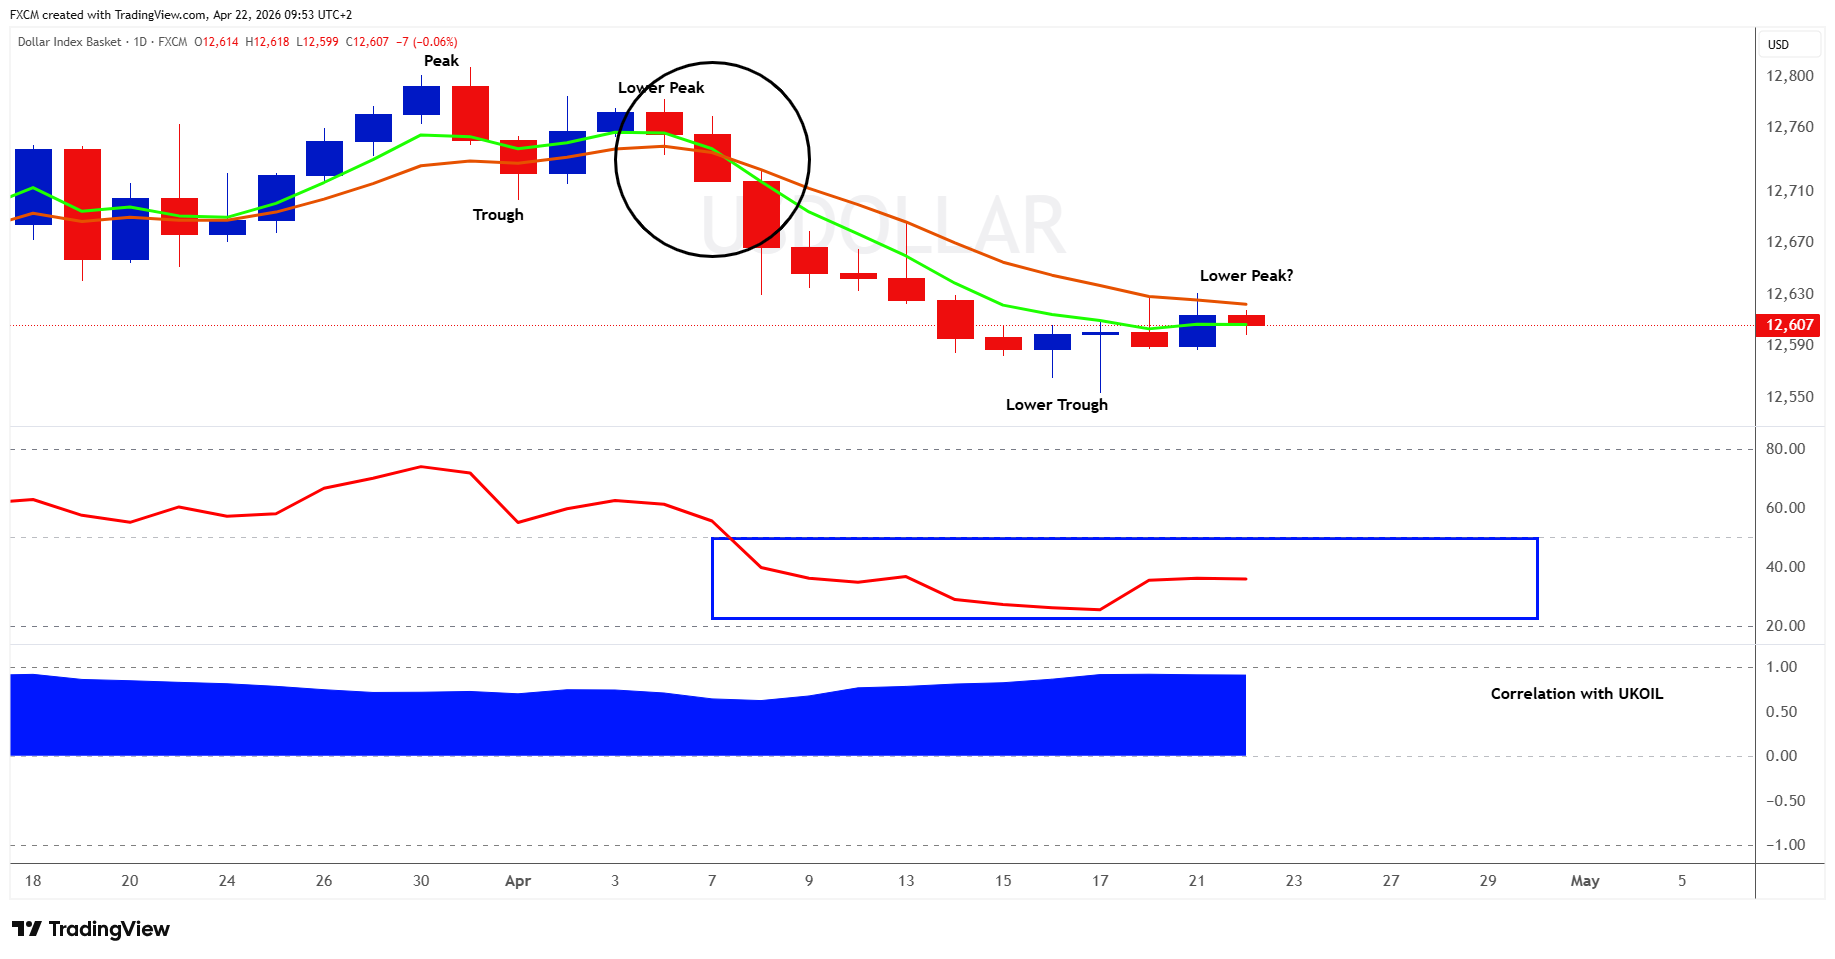
The USDOLLAR has formed a lower peak followed by a lower trough, confirming a downtrend on the daily chart. The RSI remains below 50, indicating that momentum is still skewed to the downside.
The correlation coefficient suggests the dollar remains closely tied to oil, with a strong relationship of around 91%.
Fundamental Perspective
This suggests that if momentum towards peace talks continues, which appears likely, and oil prices ease, the greenback is likely to follow, with another lower peak forming.
The key caveat remains escalation. A renewed rise in hostilities would likely push oil higher and trigger safe-haven demand for the dollar, potentially driving a bullish EMA crossover. That said, this is not the base case.
Lower oil prices tend to ease inflation, reducing pressure on the Federal Reserve. That typically feeds through to lower yields and a softer dollar.
By contrast, a spike in oil would lift inflation expectations, increasing the likelihood of tighter policy, which is supportive for the dollar.
As an aside, monetary policy is not particularly effective at addressing inflation driven by oil shocks, though that is a discussion in its own right.
Some Currencies to Keep an Eye On
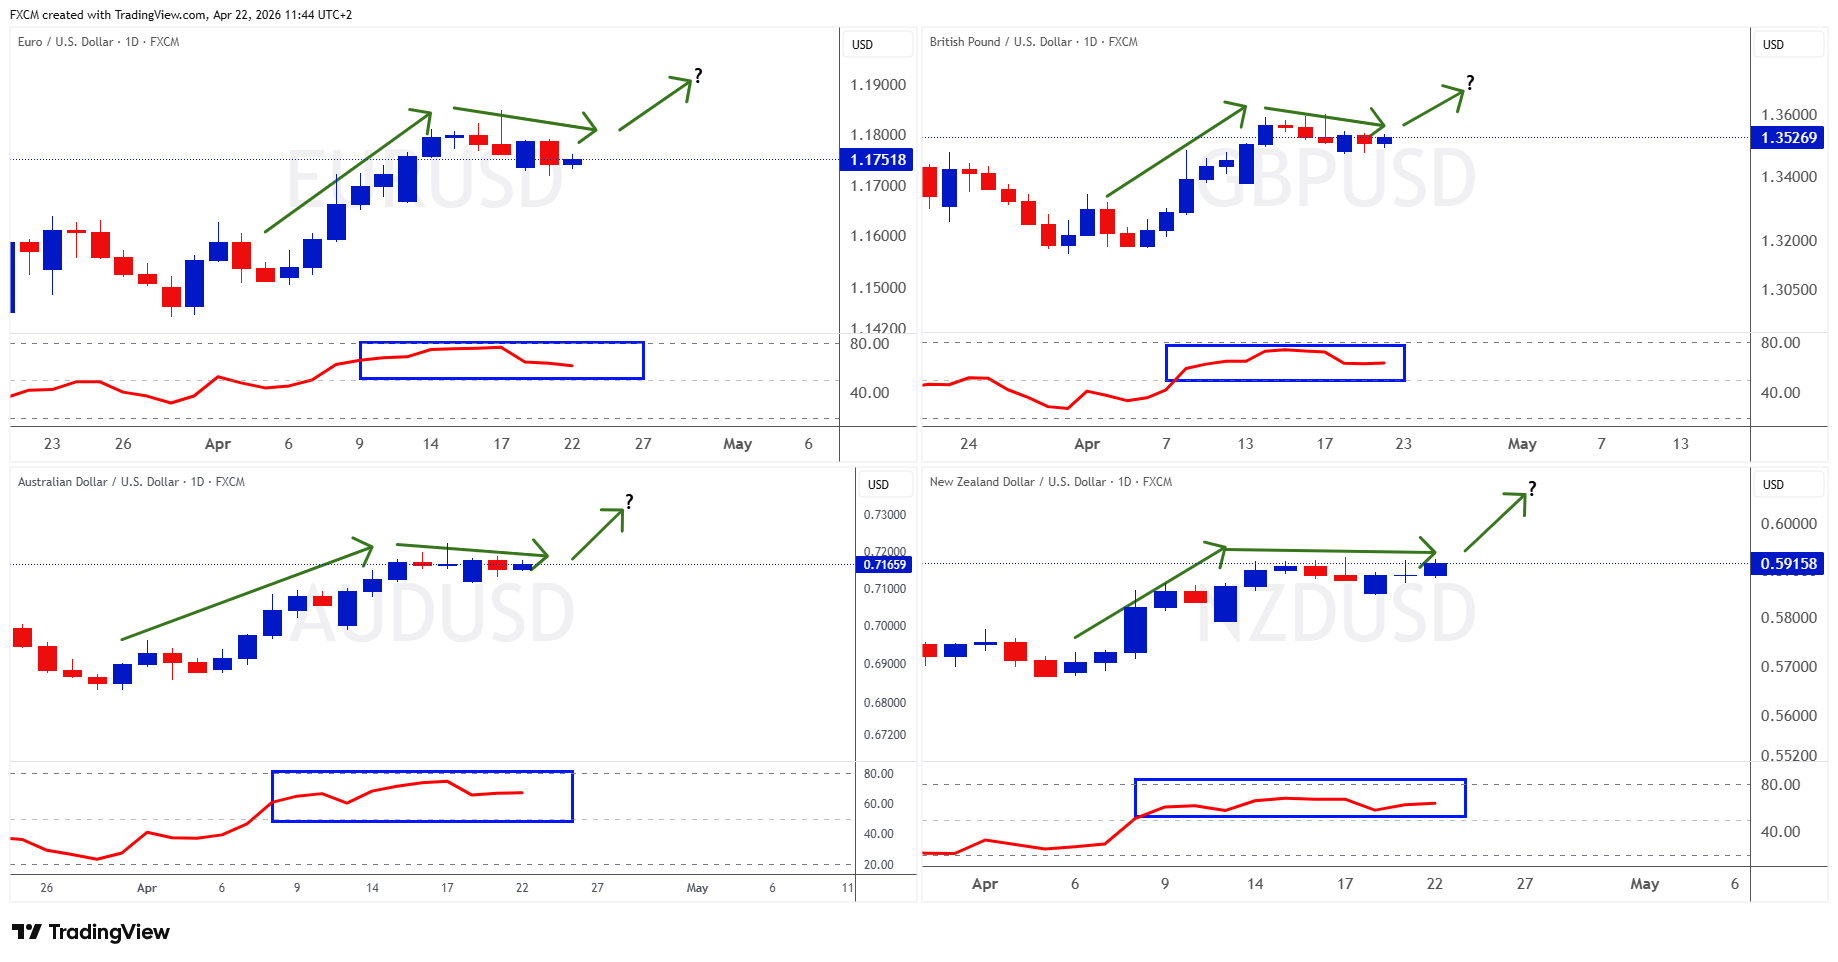
Top left is EURUSD, top right GBPUSD, bottom left AUDUSD, and bottom right NZDUSD. Based on the USDOLLAR analysis, further progress in peace talks could weigh on oil and push the dollar lower, setting the stage for these pairs to respond.
All four are tracing a similar zigzag pattern. If the dollar weakens, they are likely to move higher. Their RSIs are all above 50 (blue rectangle), indicating a positive momentum bias. As long as RSI holds above 50, the path of least resistance remains to the upside, provided peace talks progress and the correlations continue to hold.
Gold
Technical Analysis
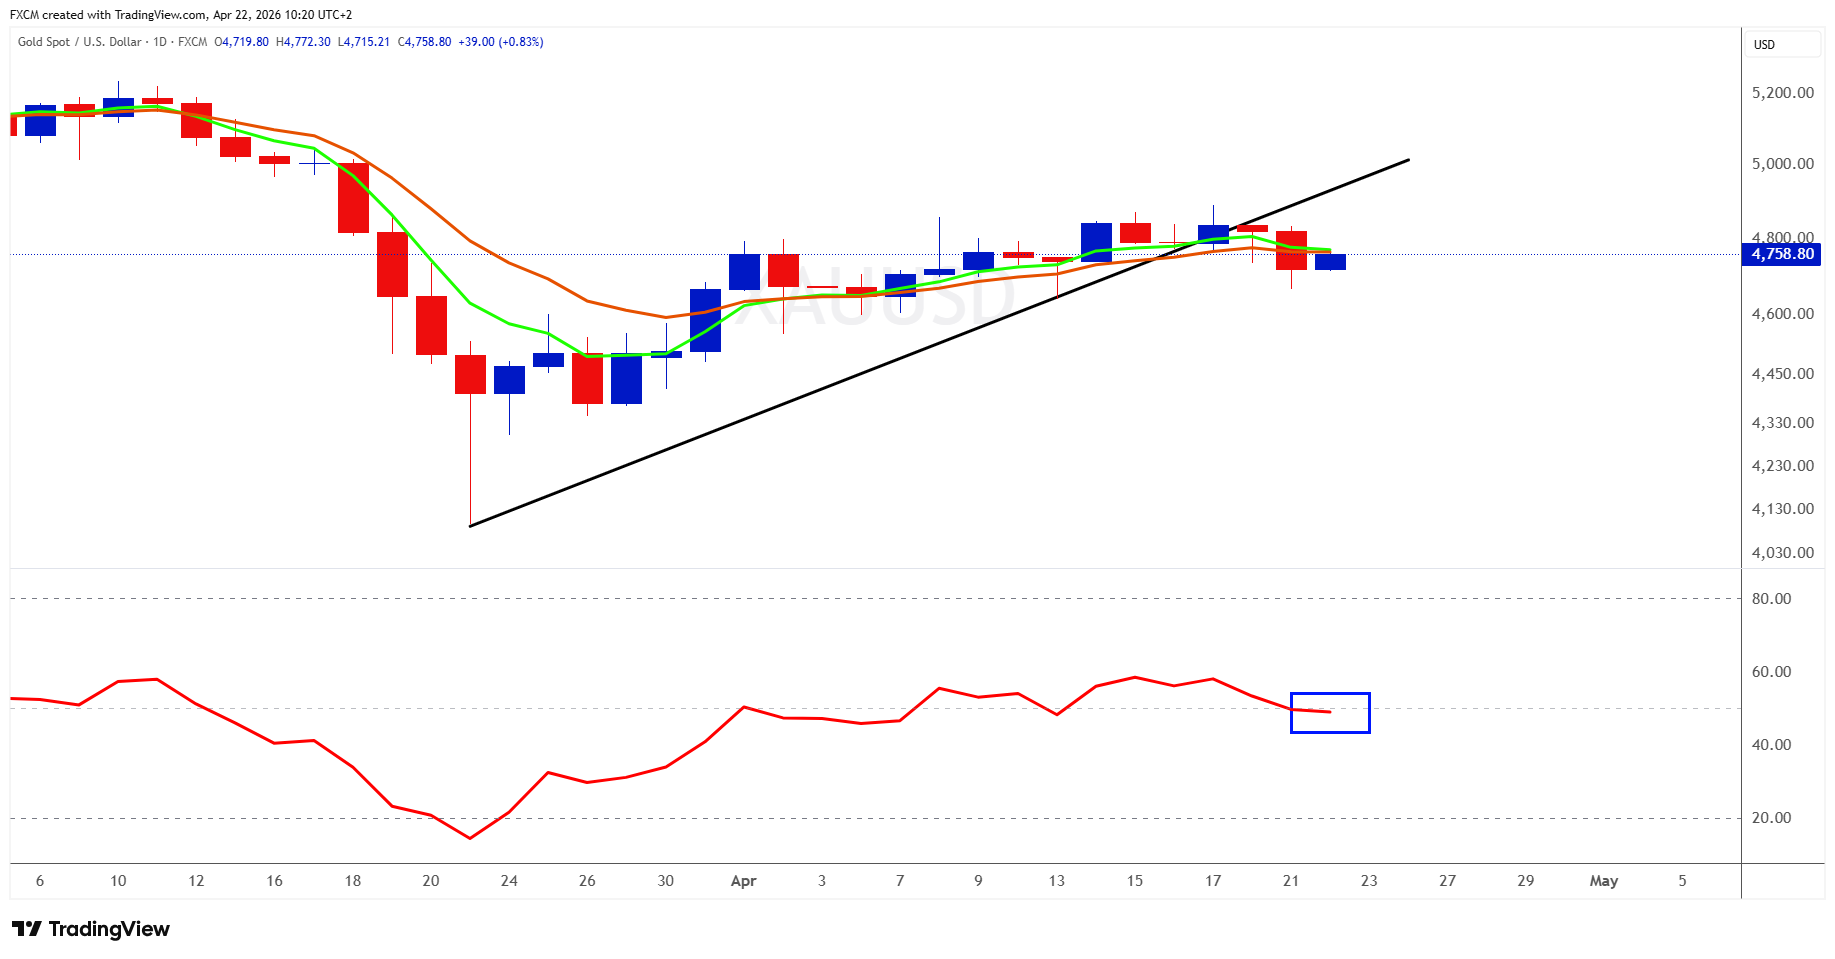
Gold's momentum is fading. The metal has broken below its black uptrend line, while the RSI has slipped beneath 50 (blue rectangle). If it holds below that level, it would signal a downside momentum bias and add further pressure on prices.
Performance has also been underwhelming. Gold is up less than 2% in April, lagging the S&P 500, which has gained close to 9%. More broadly, the market feels indecisive, with neither bulls nor bears firmly in control.
A bearish EMA crossover would reinforce the negative outlook, though the key signal remains whether the RSI sustains levels below 50.
Fundamental Perspective
Gold is also tied to oil dynamics. Although not shown here, its correlation with UKOIL is around -81%, indicating a strong inverse relationship. If oil rises and that relationship holds, gold is likely to face further pressure. Conversely, progress on peace talks that pulls oil lower would tend to support gold.
The transmission is fairly straightforward. Higher oil lifts inflation, increasing the likelihood of tighter policy and higher yields, which makes interest-bearing assets more attractive relative to gold, which offers no yield. If oil declines and inflation pressures ease, yields tend to soften, improving gold's relative appeal.
Index in Focus: SPX500
Technical Analysis
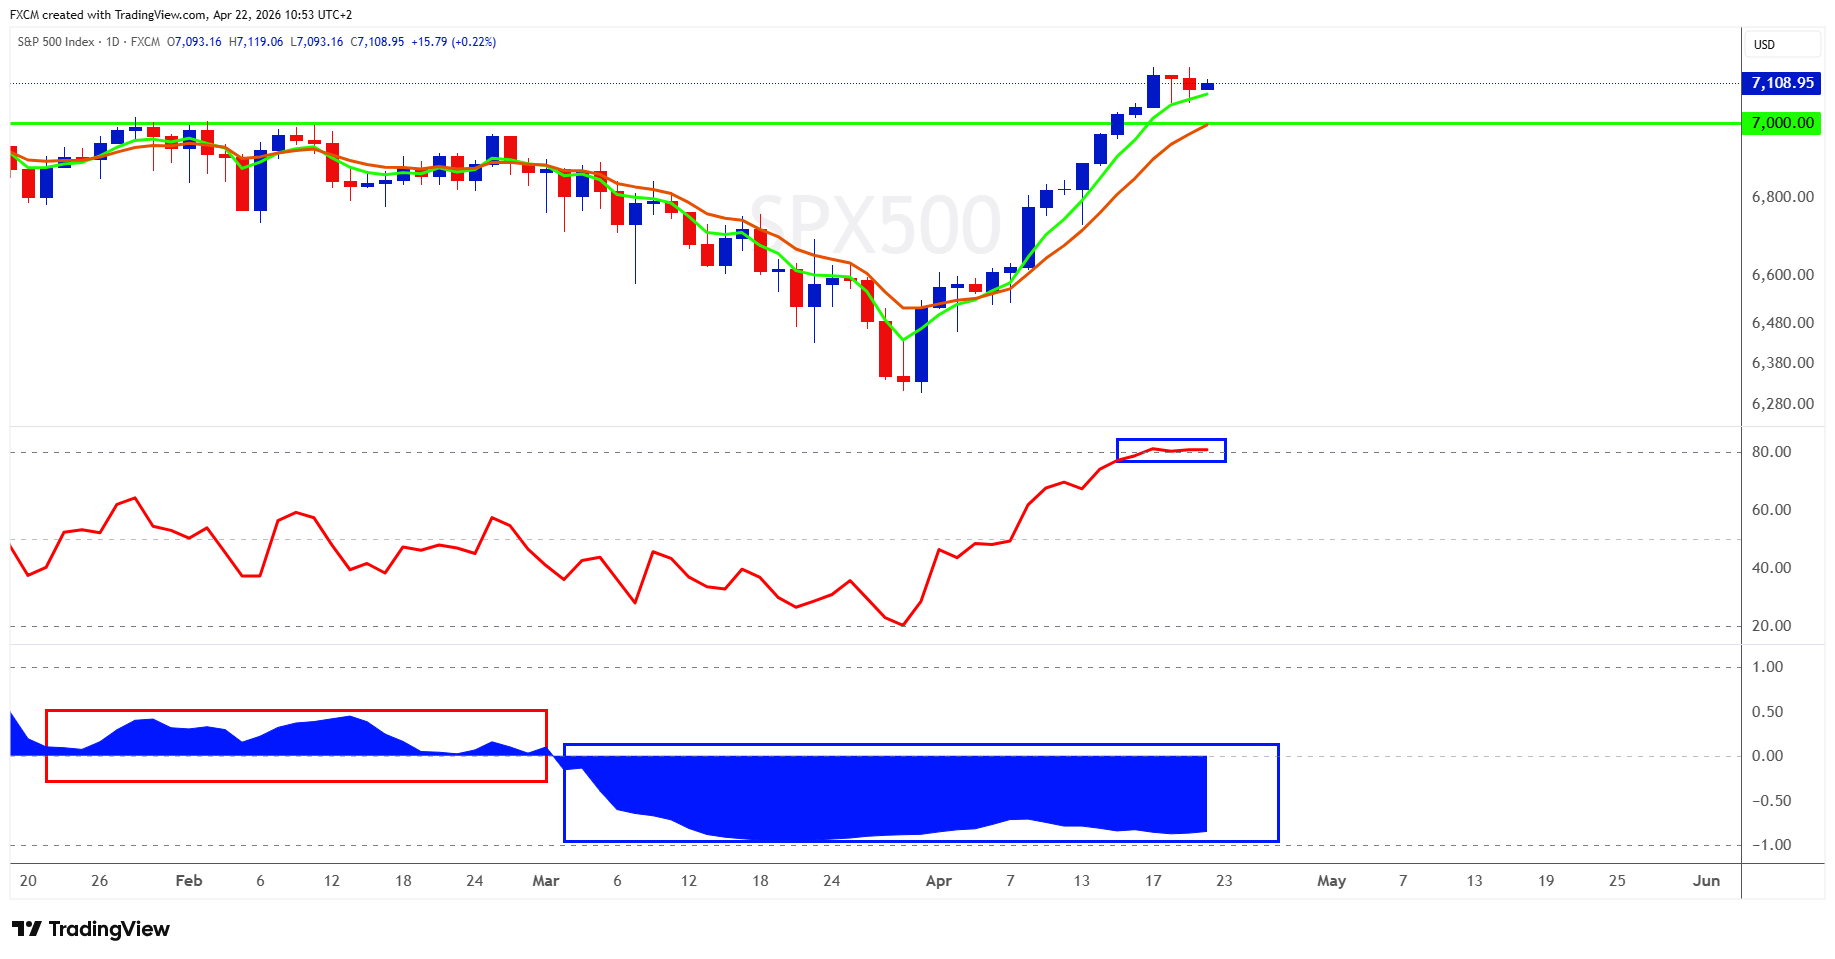
The SPX500 is trading above the key psychological 7,000 level, having gained around 9% in April, a strong move over a short period. The RSI is now above 80, firmly in overbought territory, so some form of pullback as momentum normalises would be a natural development.
Importantly, the 7,000 level may now act as underlying support, reinforcing the broader bullish structure. Any retracement is therefore likely to attract buyers, as market participants look to buy into dips within the prevailing uptrend.
Fundamental Perspective
What makes the current market dynamic so compelling is not just the move itself, but what is quietly driving it beneath the surface. The SPX500 and UKOIL are currently showing a strongly negative relationship, around -85% (bottom blue rectangle), pointing to oil's renewed role as a key macro driver of equity direction.
That is typical during periods of geopolitical tension, when oil shocks feed through into inflation expectations, interest rates, and ultimately equity valuations. In those environments, moves in energy markets can have an outsized influence on broader risk assets.
What makes this moment different is the timing. This is all unfolding in the middle of earnings season, leaving markets pulled in two directions. Solid corporate results are offering support, while higher oil prices are tightening the macro backdrop. It leaves the SPX500 finely balanced, with the next move likely to hinge less on earnings beats and more on where oil heads from here.
Russell Shor
Senior Market Strategist
Russell Shor is a Senior Market Strategist at FXCM, having been promoted to the role in 2025 in recognition of his depth of insight and consistent delivery of high-impact market analysis. He originally joined FXCM in October 2017 as a Senior Market Specialist.
Russell holds an Honours Degree in Economics from the University of South Africa, is a certified FMVA®, and a full member of the Society of Technical Analysts (UK). With over 20 years of experience in financial markets, his work is renowned for its clarity, precision, and strategic value across asset classes.
Any opinions, news, research, analyses, prices, other information, or links to third-party sites contained on this website are provided on an "as-is" basis, as general market commentary and do not constitute investment advice. The market commentary has not been prepared in accordance with legal requirements designed to promote the independence of investment research, and it is therefore not subject to any prohibition on dealing ahead of dissemination. Although this commentary is not produced by an independent source, FXCM takes all sufficient steps to eliminate or prevent any conflicts of interests arising out of the production and dissemination of this communication. The employees of FXCM commit to acting in the clients' best interests and represent their views without misleading, deceiving, or otherwise impairing the clients' ability to make informed investment decisions. For more information about the FXCM's internal organizational and administrative arrangements for the prevention of conflicts, please refer to the Firms' Managing Conflicts Policy. Please ensure that you read and understand our Full Disclaimer and Liability provision concerning the foregoing Information, which can be accessed here.