Copper Makes Upbeat Q3 Start after Sharp Pullback

Copper Analysis
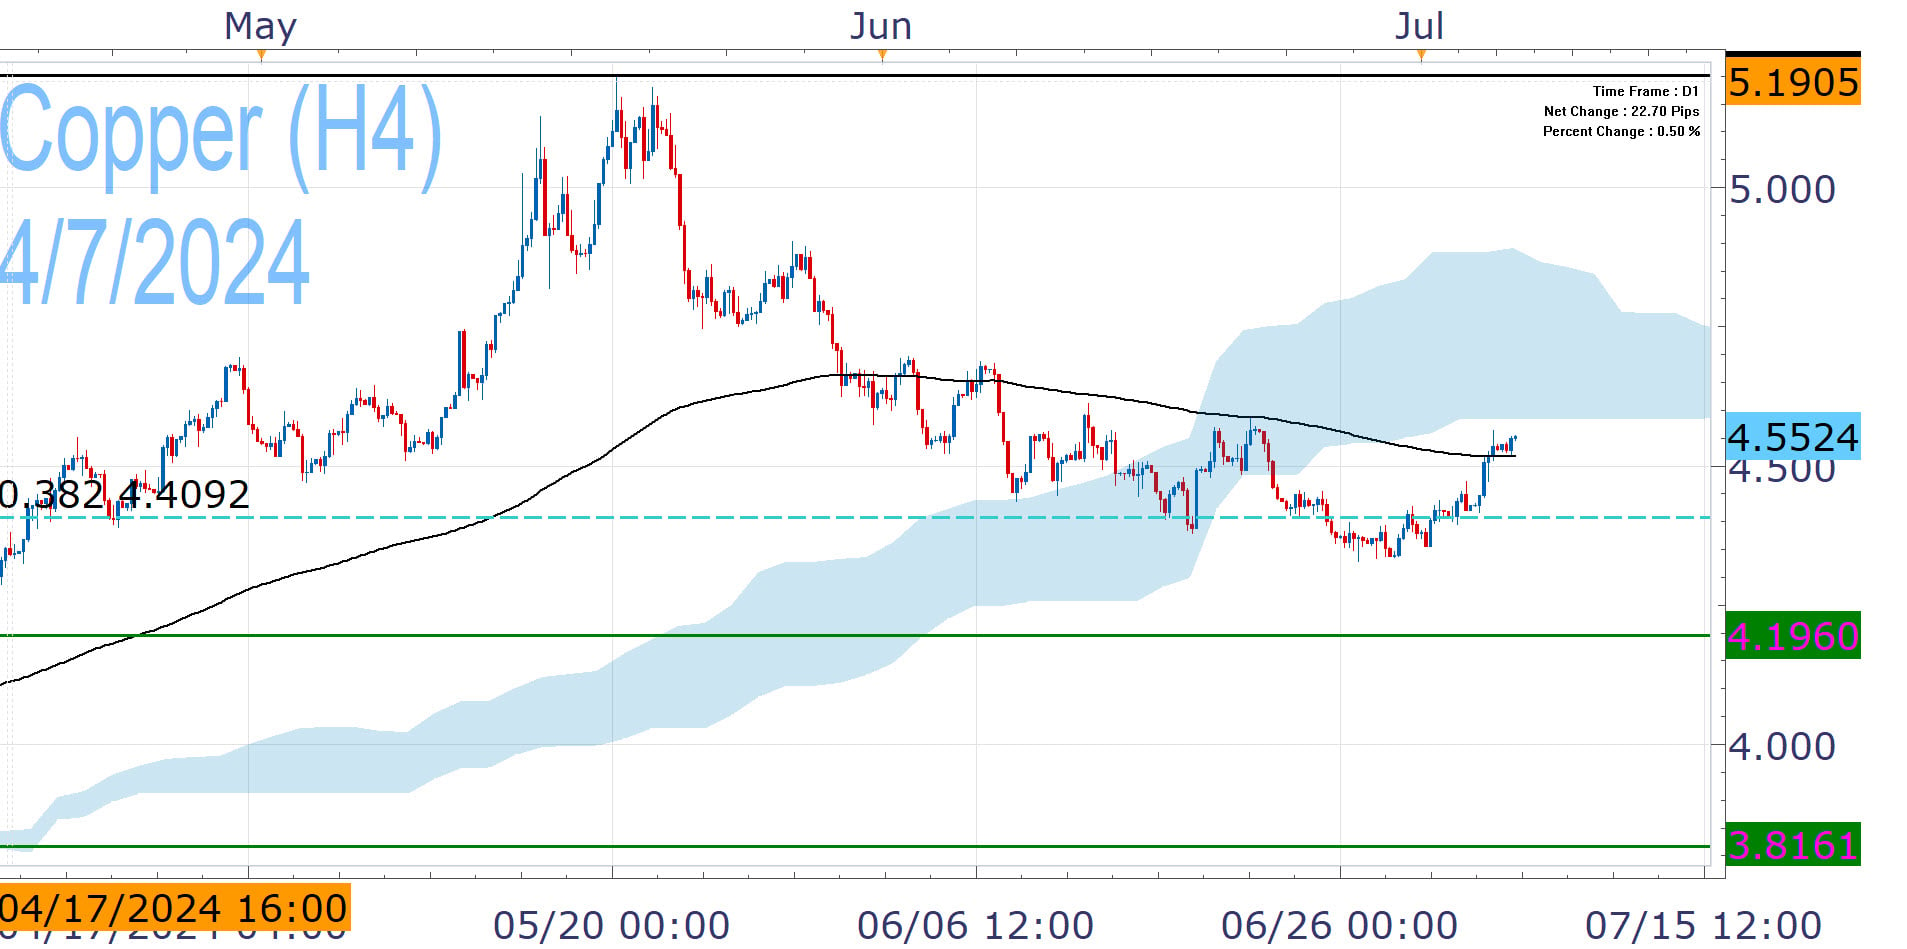
After surging to record highs in May, prices pulled back sharply below the EMA200 (black line) and breached the 38.2% Fibonacci. This casts some doubt over the technical outlook and creates scope for deeper correction towards 4.196-64.
However, Copper is up more than 15% year-to-date, staging a rebound over the past several days. After defending the pivotal 38.2% Fibonacci, it now reclaims the EMA200. Although the overbought conditions and the daily Ichimoku can contain the recovery in the near term, bulls have the potential to push again for the record peak (5.200).
This year's rally is fueled by improved fundamentals, which can support further upside. The market has tightened substantially as key smelters slash their activity this year, with First Quantum standing out. At the same time demand rises, as Copper is an essential component in semiconductors used in the AI boom. The none-ferrous metal is also a critical element of the clean energy transitions is used in electric car batteries and chargers, renewables infrastructure and more. There are risks to this promising outlook though, emanating from China's bumpy recovery, the EV adoption slowdown, the Fed's higher-for-longer stance and other factors.
Nikos Tzabouras
Senior Financial Editorial Writer
Nikos Tzabouras is a graduate of the Department of International & European Economic Studies at the Athens University of Economics and Business. With extensive experience in market analysis and a strong foundation in international relations, he brings a unique perspective to financial markets. Nikos emphasizes not only technical analysis but also on fundamentals and the growing influence of geopolitics on financial trends.
As a Senior Financial Editorial Writer, he delivers comprehensive and forward-looking insights across a wide range of asset classes, including equities, commodities, and currencies. His work explores how macroeconomic events, political developments, and global policies impact market dynamics, providing readers with a deeper understanding of both short-term movements and long-term trends.
Any opinions, news, research, analyses, prices, other information, or links to third-party sites contained on this website are provided on an "as-is" basis, as general market commentary and do not constitute investment advice. The market commentary has not been prepared in accordance with legal requirements designed to promote the independence of investment research, and it is therefore not subject to any prohibition on dealing ahead of dissemination. Although this commentary is not produced by an independent source, FXCM takes all sufficient steps to eliminate or prevent any conflicts of interests arising out of the production and dissemination of this communication. The employees of FXCM commit to acting in the clients' best interests and represent their views without misleading, deceiving, or otherwise impairing the clients' ability to make informed investment decisions. For more information about the FXCM's internal organizational and administrative arrangements for the prevention of conflicts, please refer to the Firms' Managing Conflicts Policy. Please ensure that you read and understand our Full Disclaimer and Liability provision concerning the foregoing Information, which can be accessed here.