
AlphaTrack – SPX500 Testing Key Support


Thoughtful insights and approachable analysis.
- Microsoft faces a defining earnings test as fragile momentum collides with the biggest question in AI - can its massive investment finally deliver the growth and cash returns investors expect?
- Meta enters earnings with key support under pressure and investors waiting to see whether its advertising powerhouse can turn massive AI spending into stronger growth and returns.
- Apple storms into earnings near record highs, with $350 in sight as investors look for iPhone strength, record Services growth and an AI strategy capable of powering the next leg higher.
Quick Market Overview
US stocks began the week mixed as easing oil prices reduced geopolitical concerns, but renewed worries over AI spending weighed heavily on technology shares. Chipmakers led the declines, while lower Treasury yields provided some support for the broader market ahead of a busy week of corporate earnings, including several Magnificent Seven companies.
General Equity Market Health (SPX500)
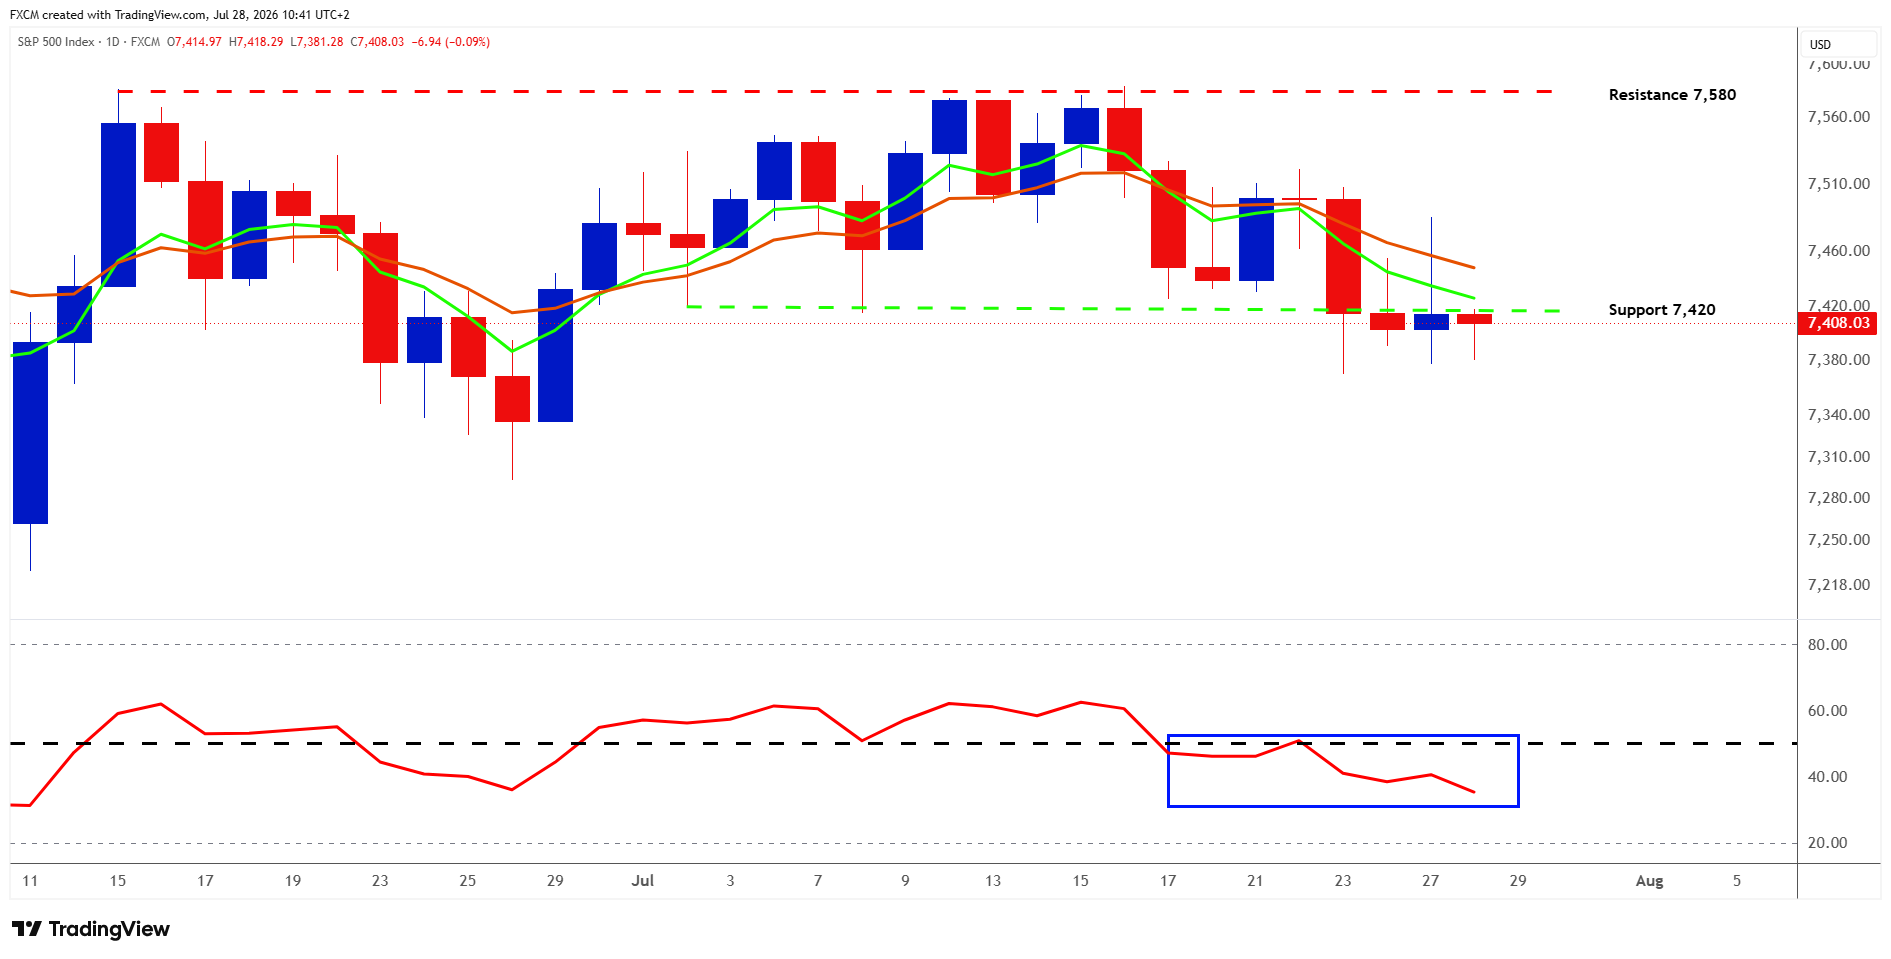
The SPX500's repeated failure at 7,580 has now developed into a clear loss of momentum, with lower highs, price slipping beneath both moving averages and the faster average turning down. The key 7,420 support is being tested, and, at roughly 7,408, marginally breached, while the RSI has fallen below 50 into the mid-30s, confirming that sellers are gaining control without the market yet being deeply oversold. A decisive daily close below 7,420 would strengthen the bearish case and expose the June congestion around 7,380-7,340; conversely, a quick recovery above 7,420 followed by a reclaim of the moving averages near 7,450-7,470 could turn this into a false breakdown.
The SPX500 trades at 20.1 times forward earnings, above its five- and ten-year averages, while the 10-year Treasury yield remains near 4.62%, leaving little room for weak guidance. The next two days could prove decisive: the Fed announces its decision on Wednesday alongside earnings from Microsoft and Meta, before June PCE inflation, second-quarter GDP, Apple and Amazon follow on Thursday. The question is no longer whether profits are growing, but whether Big Tech can convert that growth into durable cash flow sufficient to justify elevated valuations while risk-free yields remain high.
Potential Trade Setups
Big Tech faces a defining earnings week as Microsoft, Meta and Apple approach the market from very different positions. One is trying to prove that massive AI investment can deliver stronger returns, another must defend its advertising engine against a rising spending bill, while the third enters with powerful momentum and expectations already running high. Their results could either drive the next leg higher or reveal cracks beneath the surface.
Microsoft (MSFT.us)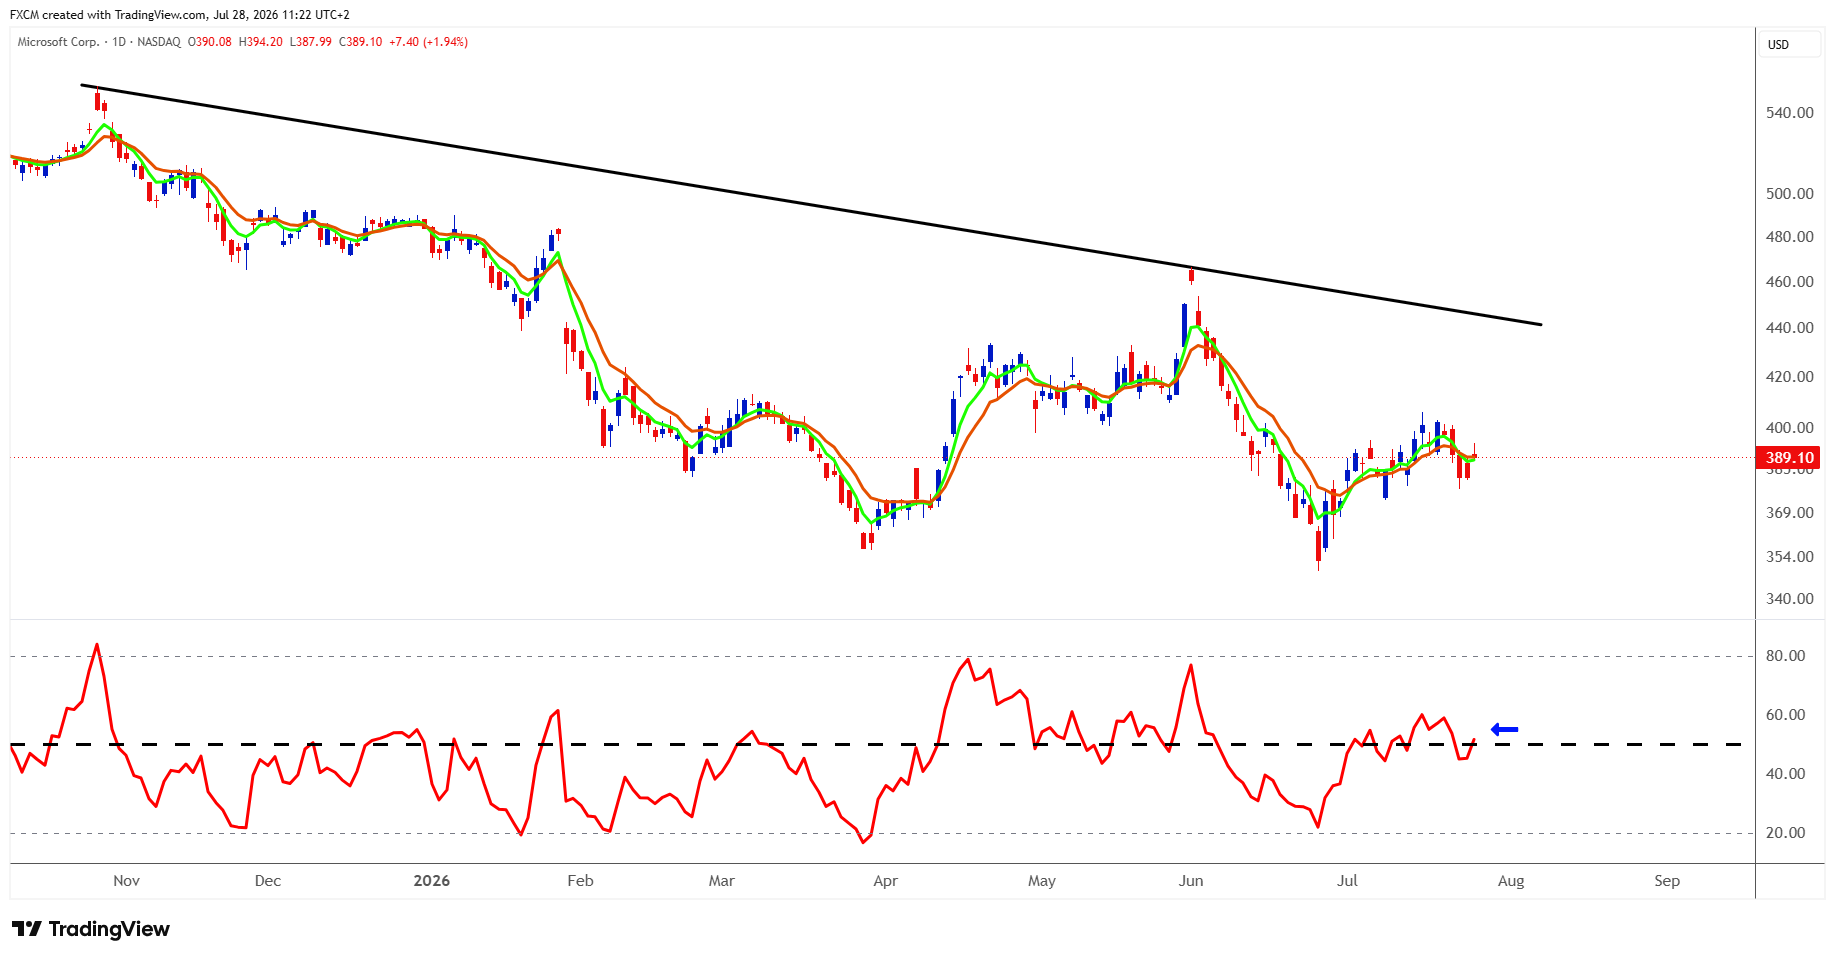
Technical Analysis
Microsoft's rebound from its early-July low near $350 has stalled around the psychologically important $400 level, with the share price slipping back toward its short-term moving averages and the RSI hovering near 50, signs of hesitation rather than renewed strength. A sustained move in the RSI above 50 would indicate improving momentum and should become increasingly supportive of the price. The broader technical picture remains bearish, however, while Microsoft trades below the long-running descending trendline near $440 and continues to form lower highs. A close above $400–$405 would strengthen the short-term outlook and open a path toward $420, while failure to reclaim that area would leave $380 as the first support, followed by $370 and the July low. Microsoft may be building a floor, but the recovery remains fragile and will need stronger momentum to sustain it.
Caveat
If the RSI falls below 50 and remains there, momentum would turn decisively negative, increasing the risk of further downside.
Fundamental Perspective
Microsoft's fiscal fourth-quarter report after the close tomorrow will test whether returns from AI are beginning to keep pace with the scale of its investment. Current analyst estimates point to roughly $87.7 billion in revenue and $4.24 in earnings per share, although Azure will probably carry more weight: Microsoft guided for 39%-40% constant-currency growth, compared with 39% last quarter. Investors will also examine Copilot adoption, AI revenue, cloud margins and the quality of Microsoft's enormous backlog, while looking for any new commentary on fiscal 2027 spending after the company guided quarterly capex to more than $40 billion. The most difficult outcome would be another increase in expected spending without stronger Azure or AI guidance, reinforcing concern that investment is rising faster than monetisation and cash returns.
Meta Platforms (META.us)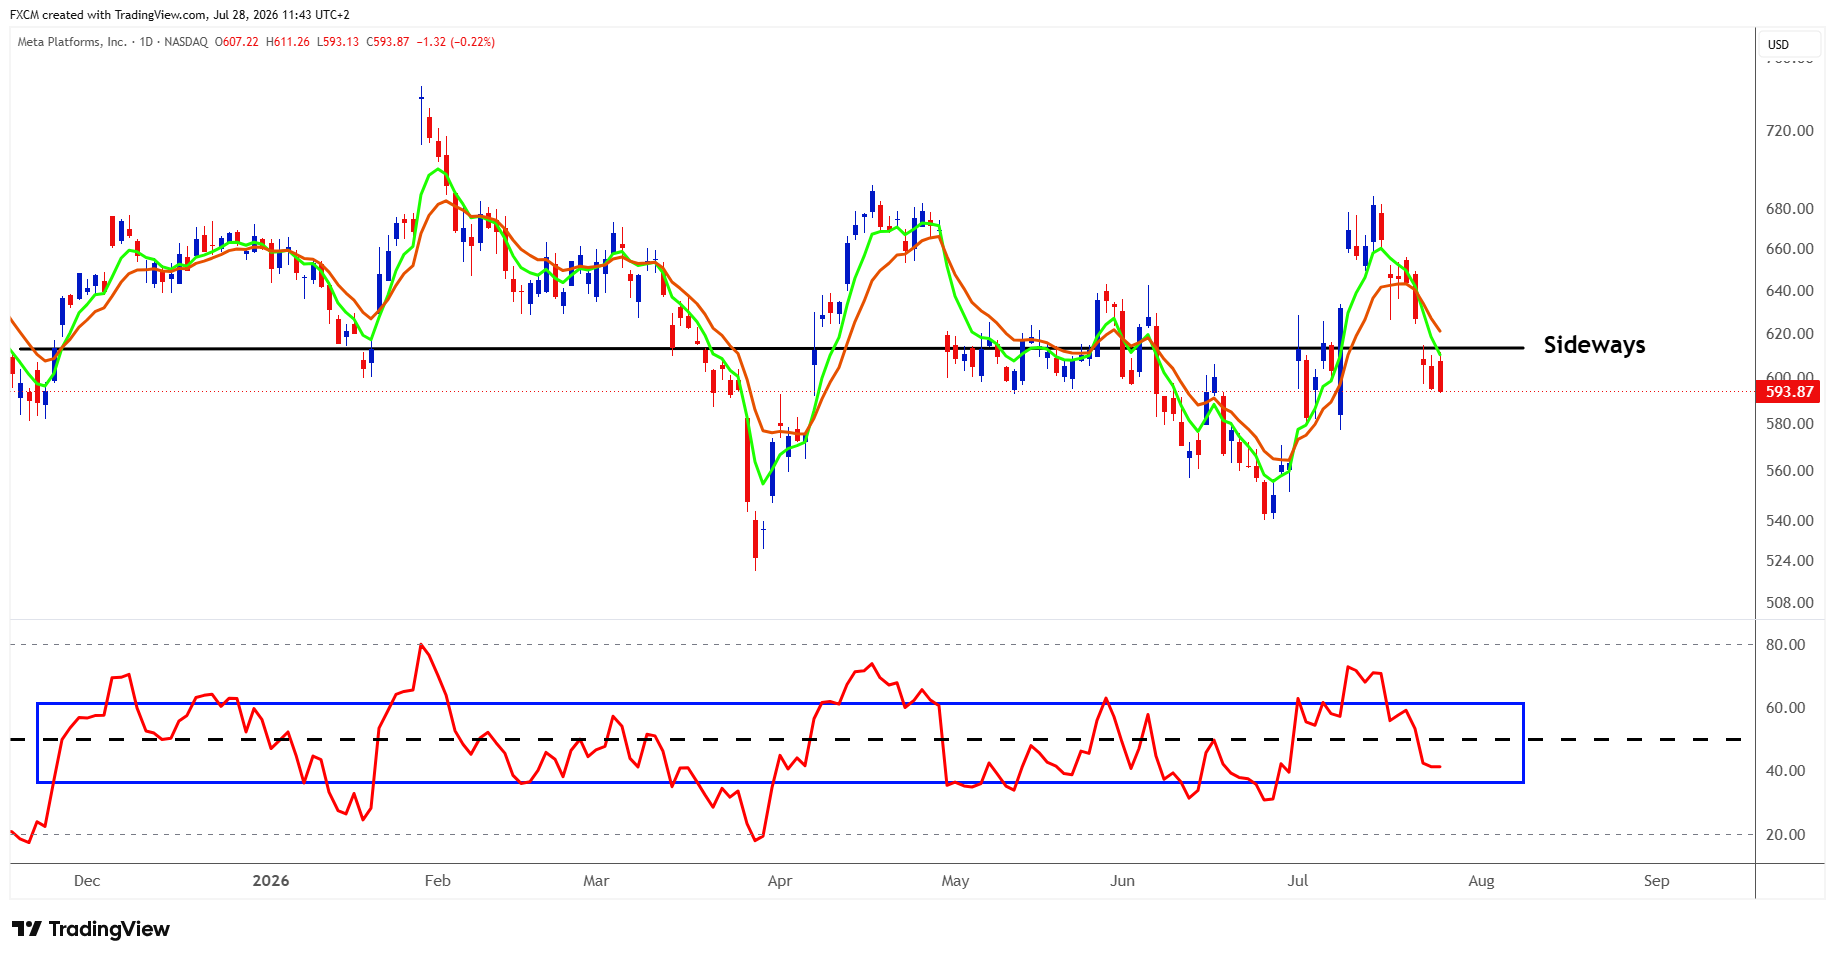
Technical Analysis
Meta has traded broadly sideways this year and has now slipped below the key $610–$615 pivot and both short-term moving averages after its July rally stalled near $680. The RSI has retreated into the low 40s, signalling weaker momentum without yet reaching oversold territory; holding above 40 could help the shares stabilise. For Meta to make meaningful inroads on the upside, the RSI needs to push above 50 and hold there. A recovery through $610–$620 would improve the technical picture and bring $640, followed by $660–$680, back into view. Conversely, a break below $590 would expose $580 and potentially the June lows around $550–$540. Meta is now testing the lower end of its recent range, and buyers will need to return soon to prevent that support from giving way.
Caveat
If the RSI remains below 50 for a sustained period, negative momentum is likely to persist and place further downward pressure on the share price.
Fundamental Perspective
Meta's second-quarter report after the close tomorrow will test whether its advertising engine can continue outrunning its rapidly rising AI bill. Estimates point to approximately $60.23 billion in revenue and $7.19 in earnings per share, placing sales near the top of Meta's $58 billion–$61 billion guidance range. Investors will watch advertising growth, engagement, operating margins and free cash flow for evidence that AI is strengthening the core business, although first-quarter increases of 19% in ad impressions and 12% in average price per ad do not, by themselves, prove that AI caused those gains. Just as important will be any change to Meta's $125 billion–$145 billion capital-expenditure forecast: strong advertising performance and stable spending guidance would strengthen the investment case, while another capex increase without clearer evidence of monetisation could revive concerns that investment is rising faster than shareholder returns.
Apple (AAPL.us)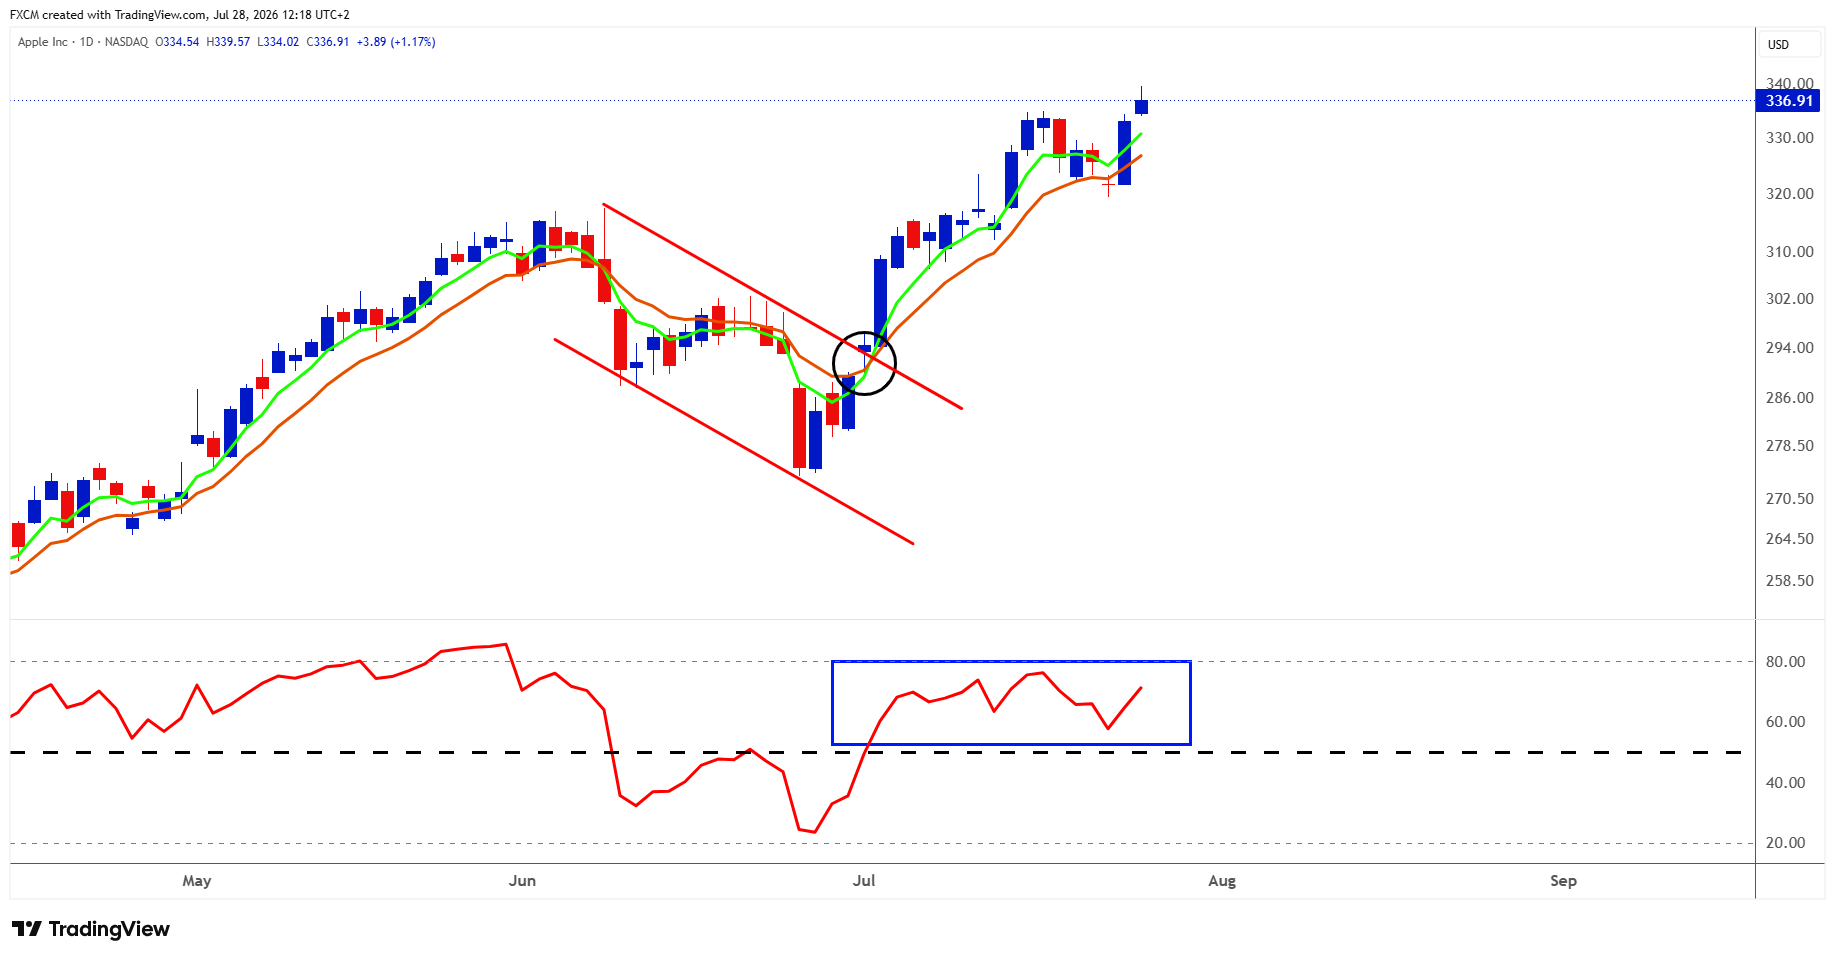
Technical Analysis
Apple's breakout from the June bullish flag has matured into a powerful uptrend, with the shares holding above both rising short-term moving averages and pushing to a fresh swing high near $340. The RSI remains firmly above 50 and has climbed into the low 70s, confirming strong momentum, although it also warns that the advance is becoming stretched and vulnerable to a pause. A decisive close above $340 would keep the breakout alive and open the door toward $350, while $330 is the first important psychological support, followed by the moving-average zone around $322–$325. Apple is now testing how far its momentum can carry it before buyers finally need to catch their breath.
Caveat
A break below the short-term EMAs would provide the first warning that Apple's uptrend is weakening, while an RSI move below 50 would mark a notable, and unusual, loss of momentum for the current advance.
Fundamental Perspective
Apple's fiscal third-quarter report after the close on Thursday arrives with the shares near record highs, raising the bar for both the results and the outlook. Estimates point to roughly $108.9 billion in revenue and $1.89 in earnings per share, although investors will focus closely on whether the March quarter's strength can continue after iPhone revenue rose 22%, Services reached a new record and total revenue increased 17% year on year. Greater China, gross margins and the September-quarter outlook will be especially important as component costs rise. Investors will also seek greater clarity on the rollout and commercial potential of Apple Intelligence and Siri AI, which remain largely future drivers rather than contributors to the quarter being reported. Apple's restrained infrastructure spending distinguishes it from other technology giants, but the longer-term test is whether that capital-light approach can still produce a meaningful AI-led device-upgrade cycle.
Hot News, Cold Logic
Global semiconductor stocks extended their sell-off as signs of improving Chinese chipmaking capabilities added to growing concerns over AI spending, valuations and future returns. Investors are increasingly questioning whether the hundreds of billions of dollars being invested in AI infrastructure can generate sufficient long-term profits, with upcoming earnings and capital-spending plans from major technology companies likely to determine whether sentiment stabilises.
Final Thought
Falling oil has offered some relief, but it has not been enough to offset the deepening semiconductor rout, mounting questions over the financing and returns of extraordinary AI investment, and unusual uncertainty surrounding the Federal Reserve's rate decision. The broader equity advance has not yet been broken, but sustaining it will require Big Tech to provide credible evidence that AI spending can generate durable commercial returns; in this environment, proof matters more than promise, and fundamental delivery more than momentum alone.

Russell Shor
Senior Market Strategist
Russell Shor is a Senior Market Strategist at FXCM, having been promoted to the role in 2025 in recognition of his depth of insight and consistent delivery of high-impact market analysis. He originally joined FXCM in October 2017 as a Senior Market Specialist.
Russell holds an Honours Degree in Economics from the University of South Africa, is a certified FMVA®, and a full member of the Society of Technical Analysts (UK). With over 20 years of experience in financial markets, his work is renowned for its clarity, precision, and strategic value across asset classes.


Any opinions, news, research, analyses, prices, other information, or links to third-party sites contained on this website are provided on an "as-is" basis, as general market commentary and do not constitute investment advice. The market commentary has not been prepared in accordance with legal requirements designed to promote the independence of investment research, and it is therefore not subject to any prohibition on dealing ahead of dissemination. Although this commentary is not produced by an independent source, FXCM takes all sufficient steps to eliminate or prevent any conflicts of interests arising out of the production and dissemination of this communication. The employees of FXCM commit to acting in the clients' best interests and represent their views without misleading, deceiving, or otherwise impairing the clients' ability to make informed investment decisions. For more information about the FXCM's internal organizational and administrative arrangements for the prevention of conflicts, please refer to the Firms' Managing Conflicts Policy. Please ensure that you read and understand our Full Disclaimer and Liability provision concerning the foregoing Information, which can be accessed here.