Russell Shor

Russell Shor

Senior Market Strategist

Russell Shor is a Senior Market Strategist at FXCM, having been promoted to the role in 2025 in recognition of his depth of insight and consistent delivery of high-impact market analysis. He originally joined FXCM in October 2017 as a Senior Market Specialist.

Russell holds an Honours Degree in Economics from the University of South Africa, is a certified FMVA®, and a full member of the Society of Technical Analysts (UK). With over 20 years of experience in financial markets, his work is renowned for its clarity, precision, and strategic value across asset classes.

Page 97 of 100

  • Salesforce Stock Has Been Accumulated Over Q3

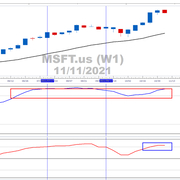
    Past performance is not an indicator of future results Source: www.tradingview.com Salesforce released its Q2 earnings on 25 August. This marks an important inflection point (dashed blue vertical) on the company's price chart. For most of 2021, the stock moved sideways, as did its volume (red dashed horizontal). The lower chart shows the OBV indicator, which shoots upwards, following the Q2 earnings release, as the price takes off. Past performance…

  • Intermarket Relationships Show Commodities To Be Strongest

    Past performance is not an indicator of future results Source: www.tradingview.com In the monthly chart above we show the long term relative strength between the major financial markets post the pandemic lows (dashed blue vertical): 1. Stocks [represented by the S&P 500 (SPX)]. 2. Bonds [represented by the iShares 7-10 Treasury ETF (IEF)]. 3. Commodities [represented by the Thomson Reuters CRB Index (TRJEFFCRB)]. The top chart shows the relative strength…

  • BoE December Rate Hike Still Not a Certainty

    The UK's 3-month moving average of average earnings (compared with the same period last year) came in at 5.8%. This was higher than the consensus of 5.5%. The unemployment rate declined to 4.3%, also under the consensus forecast of 4.4%. The inflation numbers will be released tomorrow, and Friday will see retail sales. During yesterday's Monetary Policy Report Hearings, the BoE governor, Andrew Bailey, told MPs that he is "very…

  • Consumer Sentiment Hit By Inflation Concerns

    In this article: 1. University of Michigan consumer survey misses consensus. 2. US consumers are gloomy. 3. Inflation is rampant. 4. The Fed may have to pivot on policy. Friday's preliminary consumer sentiment reading from the Univesity of Michigan was sobering. US consumers are hurting. Last month's print was 71.7, and 72.5 was the consensus for Friday's number - it came in at a paltry 66.8. Faced with the prospects…

  • USDOLLAR Starts Week With Short-term Support Holding

    In this article: 1. Poor consumer sentiment hurts dollar. 2. The greenback finds support on shorter-term chart. 3. Longer-term chart looks bullish. 4. Shorter-term particpants need to sync with longer-term trend USDOLLAR Charts: Past performance is not an indicator of future results Further to Friday's article, the dollar weakened after an exceptionally poor preliminary University of Michigan Consumer Sentiment number. The print came in at 66.8 against a consensus of…

  • USDOLLAR At Key Support On Hourly

    Past performance is not an indicator of future results The left chart shows the USDOLLAR daily. It sits in the area of strength (upper blue and upper red bands). The red Bollingers are expanding as dollar volatility increases. The right chart shows the hourly time frame. Current price action is at a confluence of support [central pivot (P) and price support (blue rectangle)]. We are looking to see if the…

  • NAS100 Excess Has Cleared On Daily; Possible Dip in Uptrend

    Past performance is not an indicator of future results Previously we suggested that the NAS100 was in a good position for participants to start banking profits. Since then the index has pullback and the overbought condition has normalised. The left chart shows the NAS100 daily. It is trading on the border between the bullish and neutral areas. The hourly chart is on the right. A bullish EMA crossover and stochastic…

  • Gold EMAs Surprisingly Look To Form Bullishly

    Past performance is not an indicator of future results Further to our previous analysis, gold's EMAs are pushing for a more bullish formation. EMAs are trend-following indicators and work under trend conditions. Consolidations tend to lead to whipsaw signals. The shorter-term green EMA has moved into a bullish position, and we are now looking for the mid-term orange EMA to cross above the longer-term red EMA (aqua ellipse). If this…

  • EURUSD Weekly Analysis

    Past Performance is not an indicator of future results. The weekly EURUSD is examined on several levels: 1. Head and shoulders top (blue rectangles). The positively sloped aqua line shows the pattern's neckline. The vertical aqua line derives the pattern's target following its breakout. The target is 1.1134 and is academic - it may or may not be achieved. However, it does give the sense of bearishness associated with breakdown.…

  • MSFT Is Overbought But Fundamentals Make Pullbacks Compelling

    The MSFT weekly chart is overbought (blue rectangle). At some stage, the RSI will need to normalise. However, weekly conditions are tricky because it may take weeks or even months before correcting. The last overbought condition took two months before clearing (blue verticals). The stochastic has also been showing tremendous strength and has been in the upper region since mid-June (red rectangle). Past Performance: Past Performance is not an indicator…

Disclosure

Any opinions, news, research, analyses, prices, other information, or links to third-party sites contained on this website are provided on an "as-is" basis, as general market commentary and do not constitute investment advice. The market commentary has not been prepared in accordance with legal requirements designed to promote the independence of investment research, and it is therefore not subject to any prohibition on dealing ahead of dissemination. Although this commentary is not produced by an independent source, FXCM takes all sufficient steps to eliminate or prevent any conflicts of interests arising out of the production and dissemination of this communication. The employees of FXCM commit to acting in the clients' best interests and represent their views without misleading, deceiving, or otherwise impairing the clients' ability to make informed investment decisions. For more information about the FXCM's internal organizational and administrative arrangements for the prevention of conflicts, please refer to the Firms' Managing Conflicts Policy. Please ensure that you read and understand our Full Disclaimer and Liability provision concerning the foregoing Information, which can be accessed here.

Spreads Widget: When static spreads are displayed, the figures reflect a time-stamped snapshot as of when the market closes. Spreads are variable and are subject to delay. Single Share prices are subject to a 15 minute delay. The spread figures are for informational purposes only. FXCM is not liable for errors, omissions or delays, or for actions relying on this information.